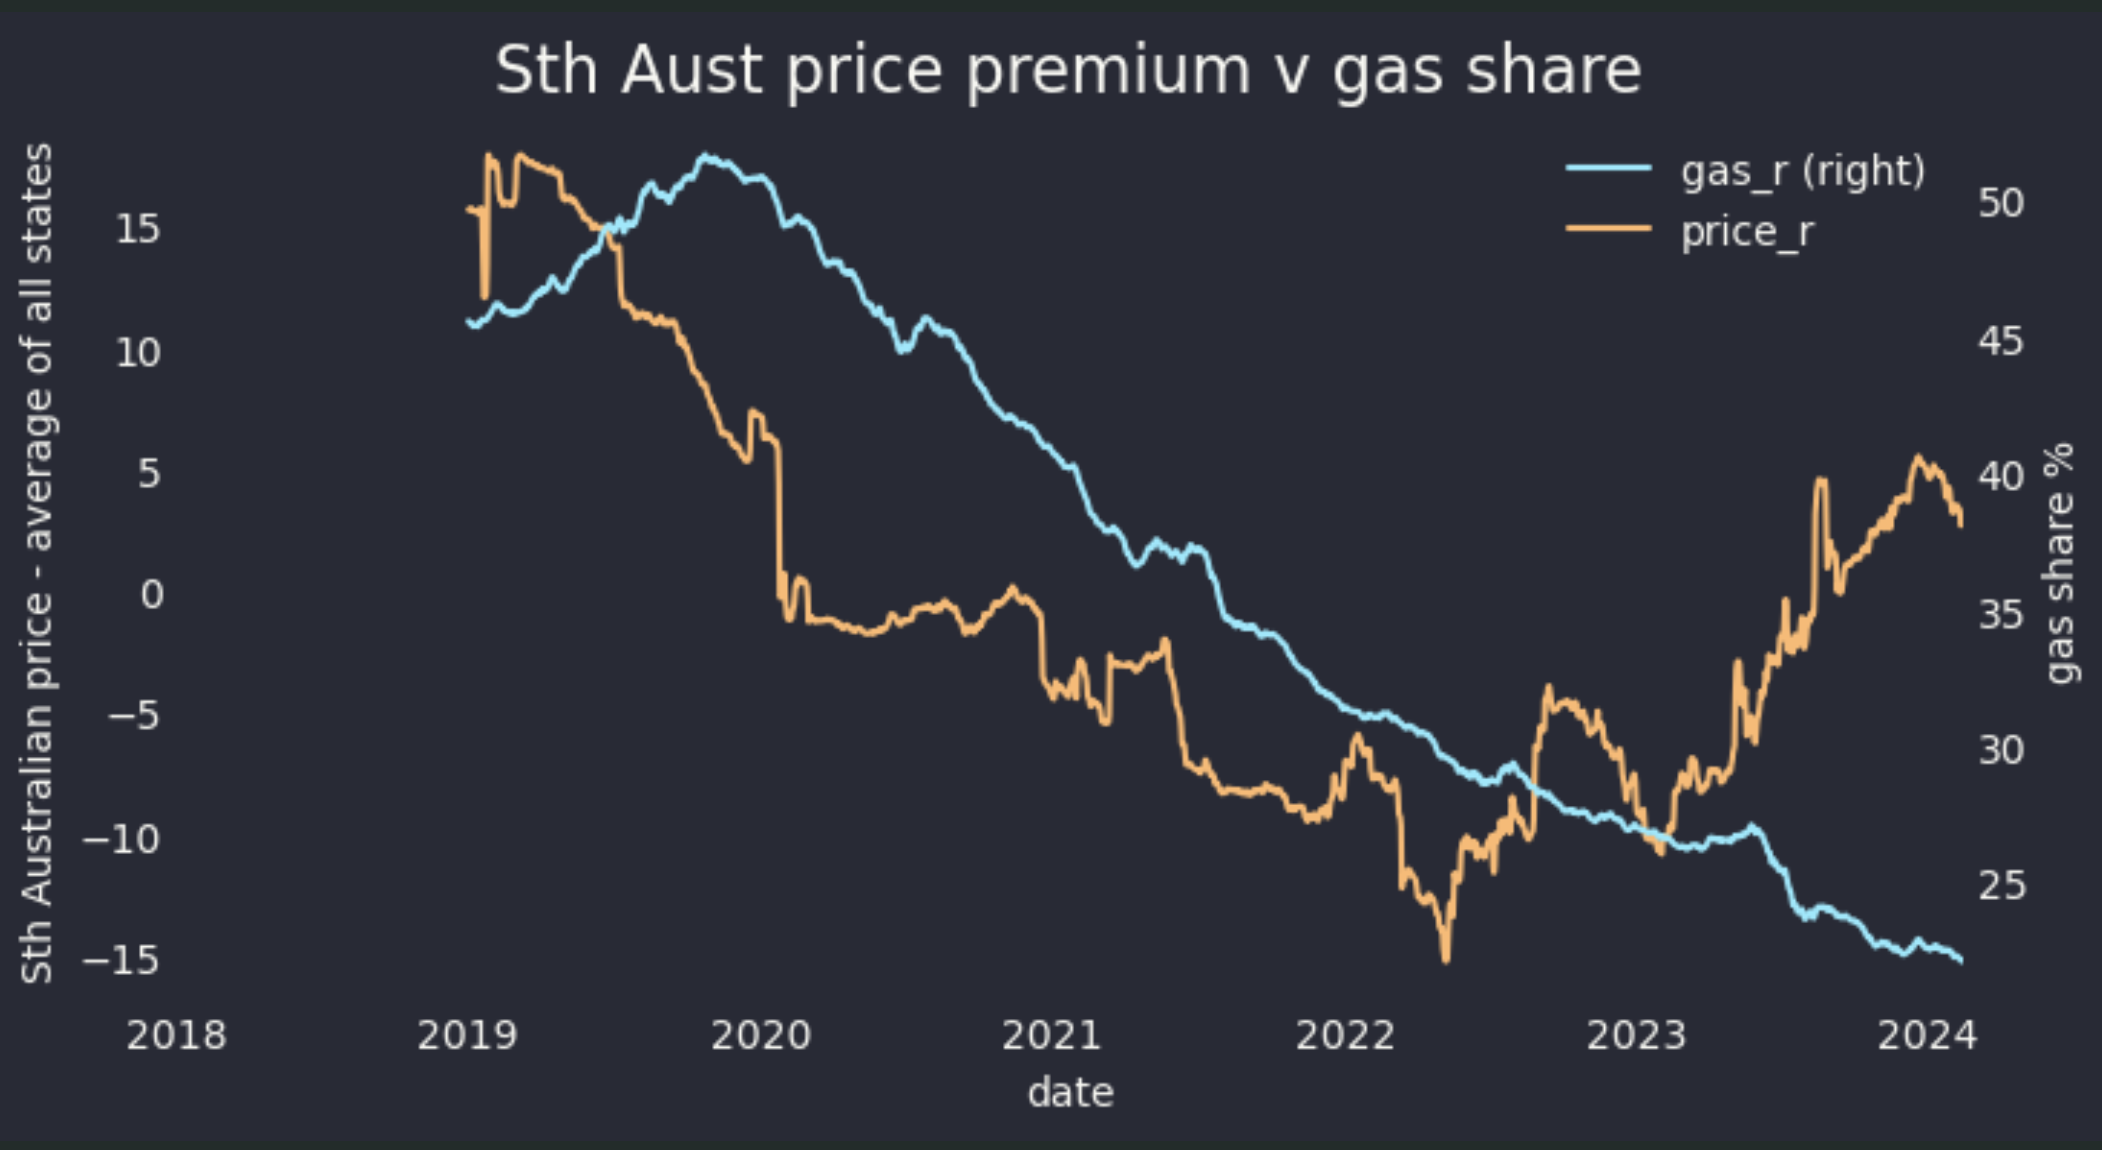
Despite 2022 the data shows that as the gas share of production falls so do electricity prices
The following chart shows a six year 365 day rolling history of the gas share of demand (demand includes net imports), compared to the South Australian price premium. The price premium was defined as the Sth. Aust. price - the average price of all the States in a half hour. Basically as the gas share falls so does the price. However the extreme circumstances of 2022 when gas prices were at rationing levels, meant that relative prices rose in South Australia, still the most gas dependent state.
Now that gas prices are declining South Australian prices can resum their relative fall
