For Australian coal supporters Asia is the be all and end all
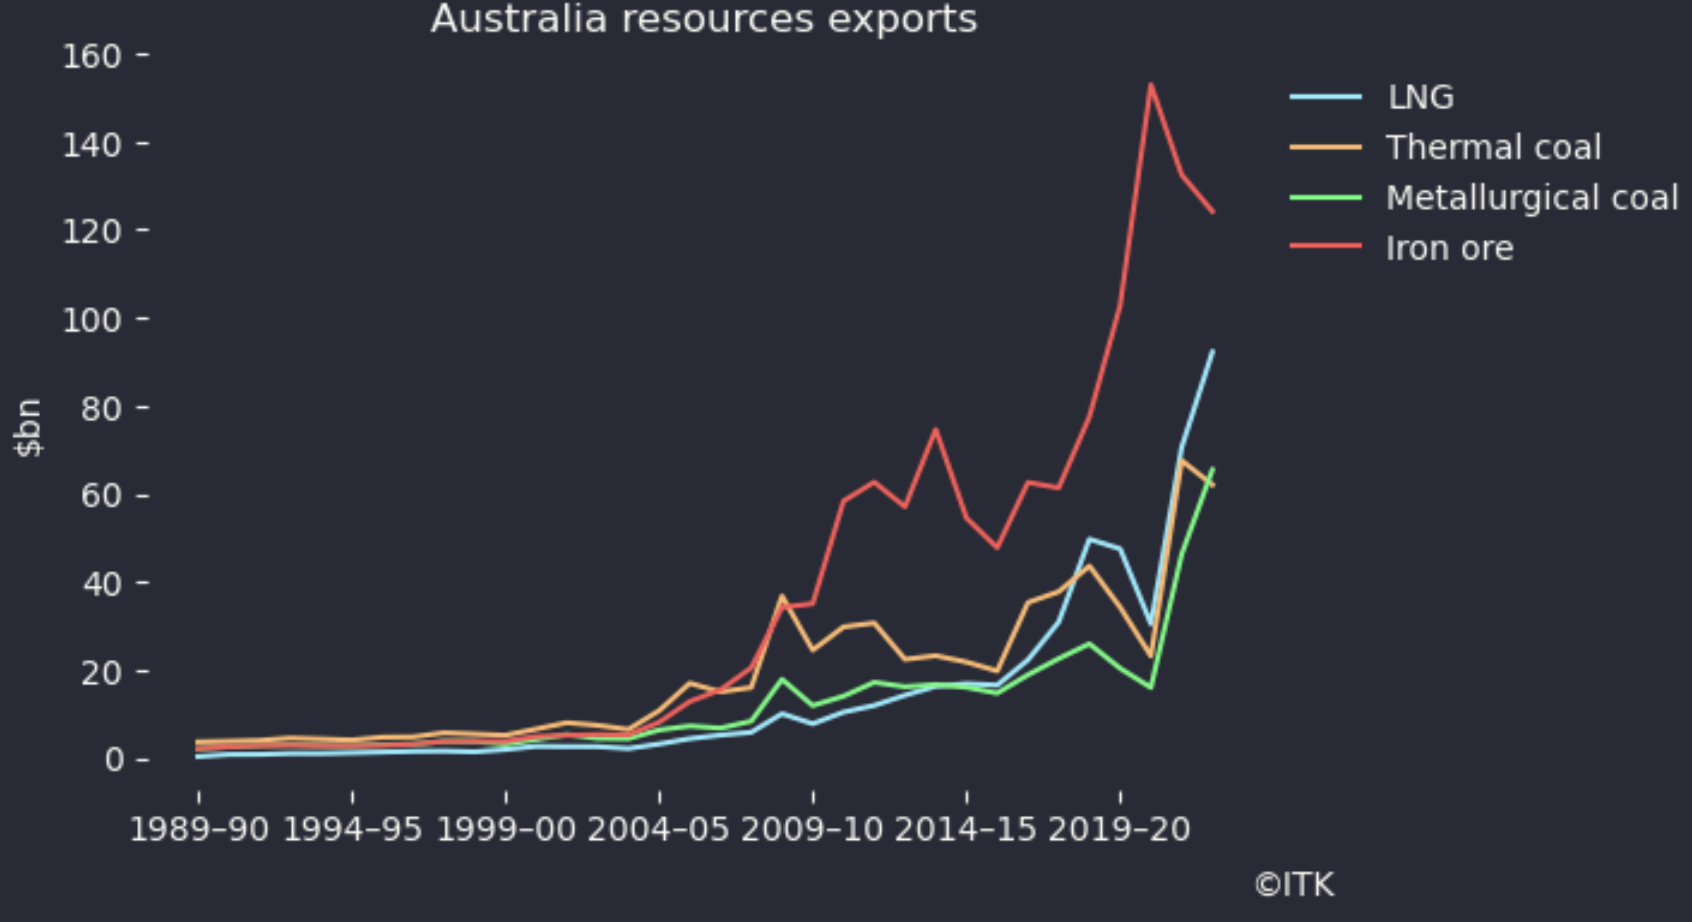
For Australia, Asia, and particularly China is the primary source of our export revenue. The following chart clearly shows how iron ore and mettalurgical coal exports took off in the late 2000s as China pursued its rapid urbanization and its enormous construction boom.
Equally even though thermal coal exports show signs of pausing its still a $60 bn a year business that Australia will need to replace over the coming decade.
Japan is in the G7 and they just agreed to phase out coal
Although Japan is likely to be the last to achieve the goal the latest G7 Meeting in Italy has agreed to phase out coal generation by 2035, or in Japan’s case at some unspecified date. I interpret that optimistaically as the expectation for Japan too to do its bit has clearly increased and been acknowledged. If Japan does adopt this stance then:
- Australia presently exports around 70 mt a year of thermal coal to Japan. That market will disappear.
- Japan will have to replace that generation;
- Other countries in Asia will pay attention.
Australia’s thermal coal exports to Asia are shown below. Regretably reliable figures from the Australian Govt for calendar 2023 are not yet published. As of early 2024 exports to China are larger than those to Japan. Broadly speaking about 150 mt of thermal goes to Asia worth @ A$120/t around A$18 bn a year. Arguably Vietnam should be on the chart, but its not included in the Resources and Energy Quarterly published by the “Chief Economist office”. Frankly the office could get its act together on the numbers a bit quicker.
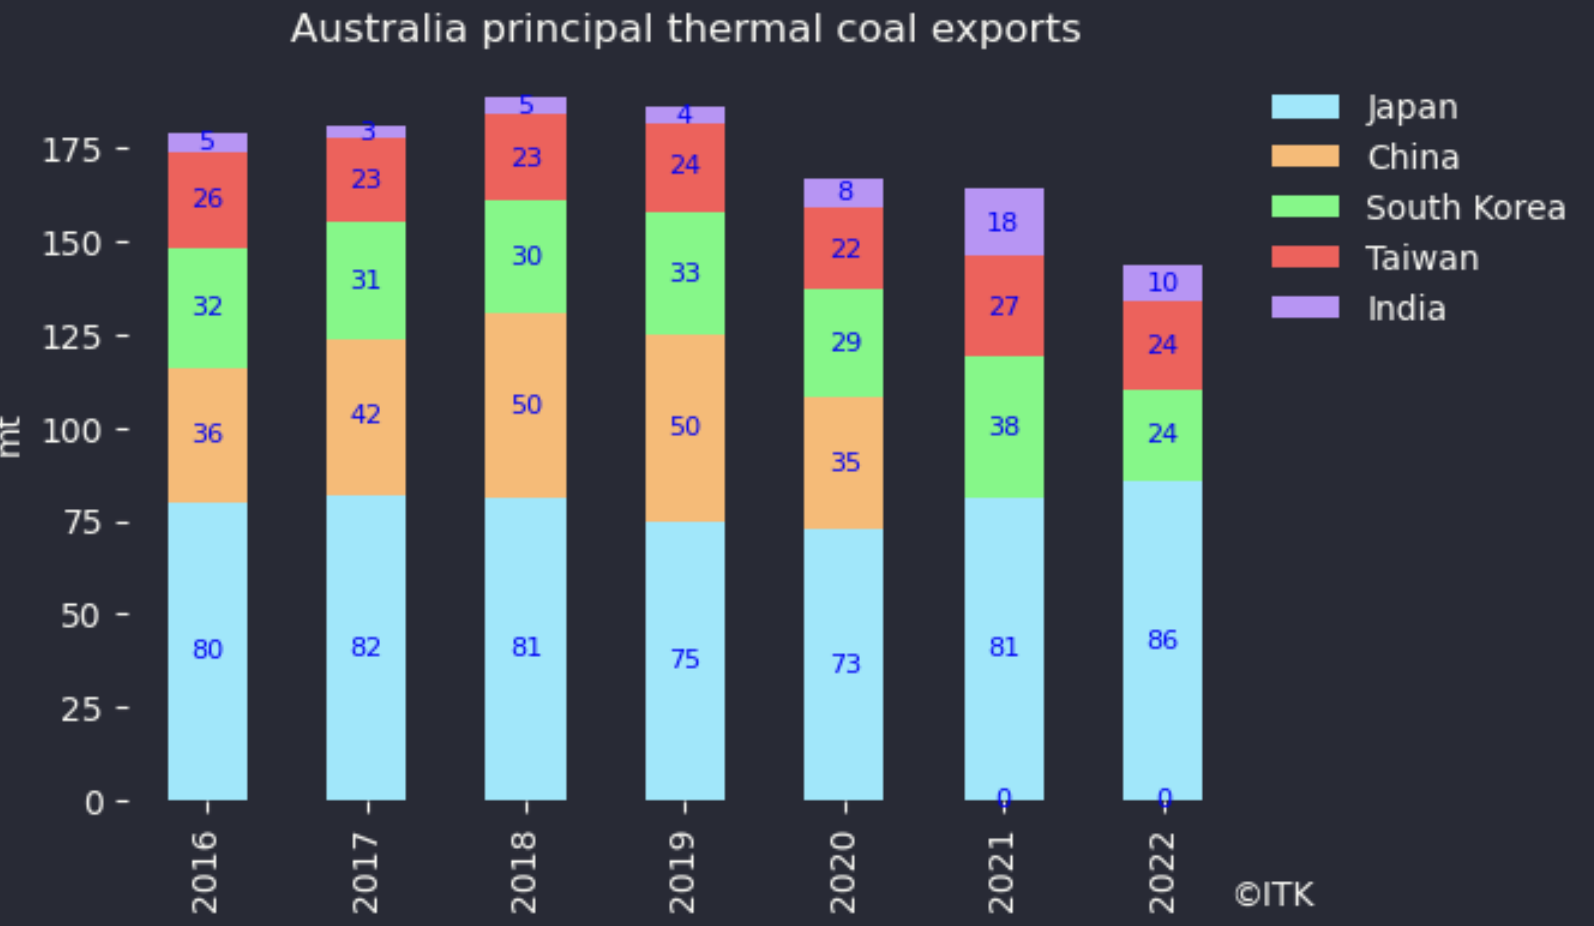
In my view Australia currently has no bankable replacement for those exports. Nevertheless at a minimum it should be obvious, but won’t be, even to the coal producers that this is no longer a growth market and, in my view, one that is going away quicker than would have been thought possible even 5 years ago. This then leads to the question of how Asia, and particularly in this case the Asean nations are going to get electricity, and perhaps the resulting cost.
Renewable energy and Asean
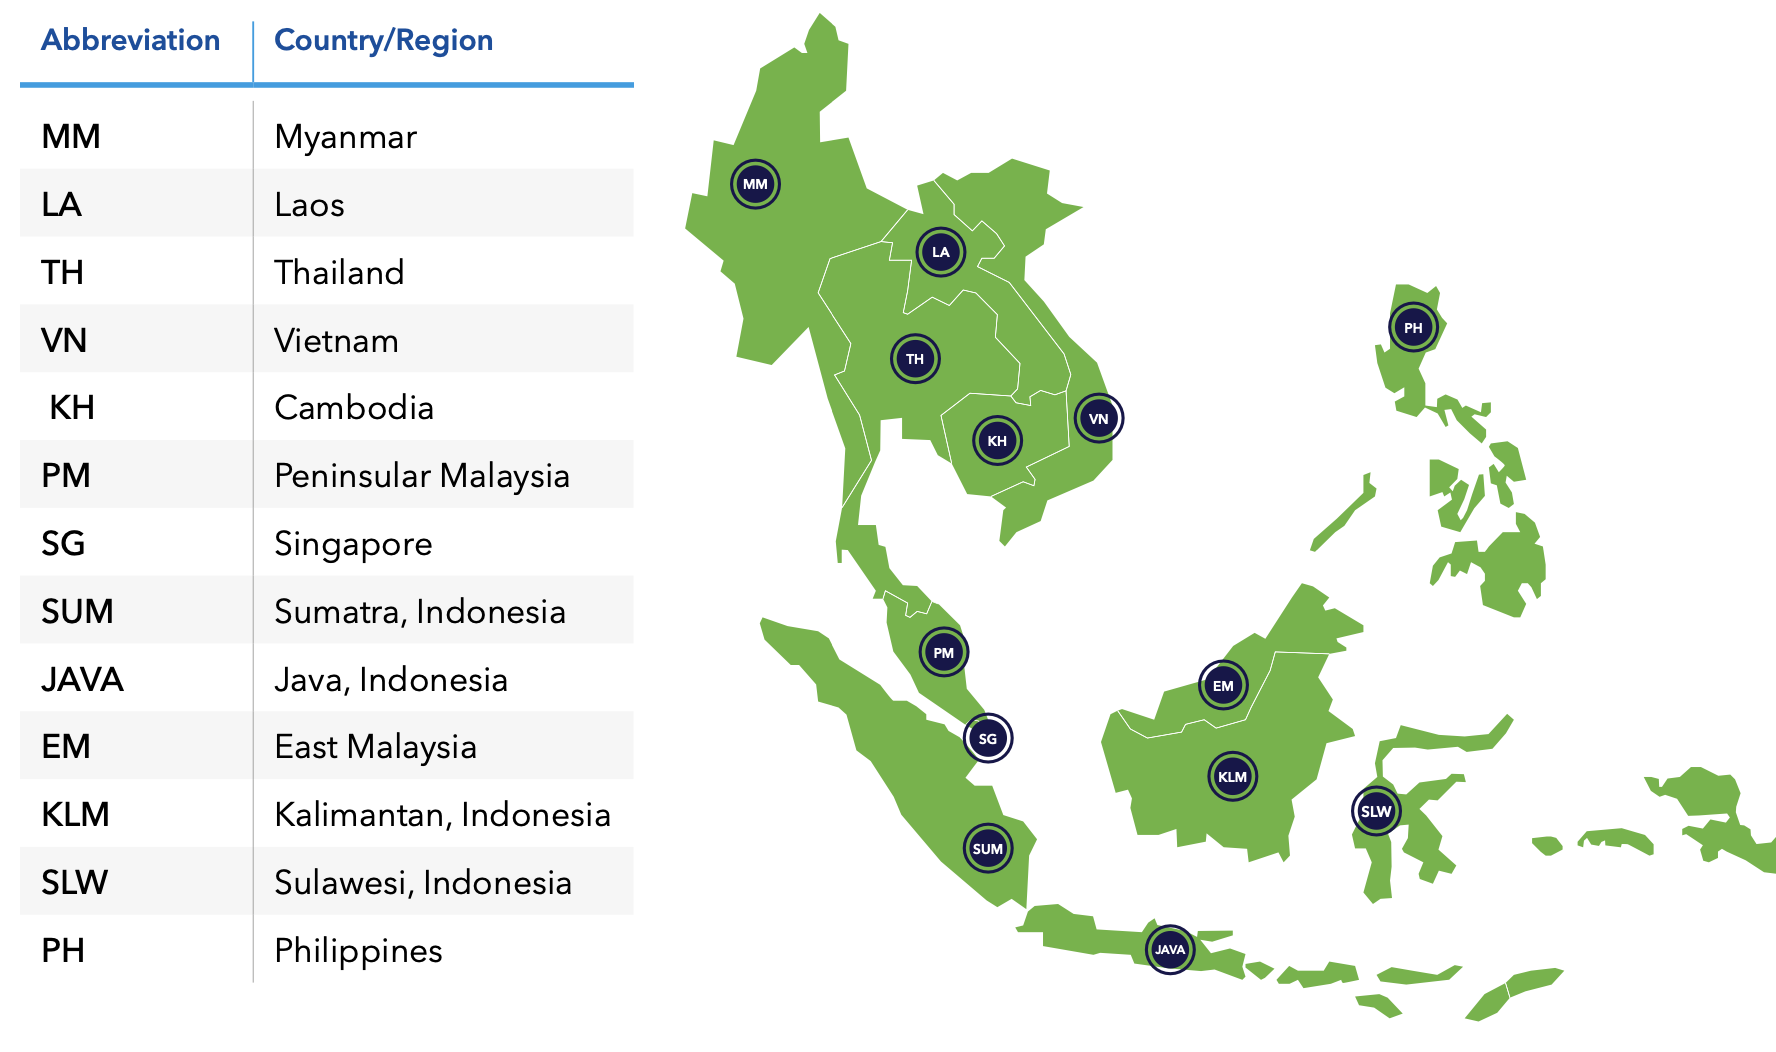
The following section is basically information extracted from a recent DNV report ” ASEAN interconnector study ” which looked at the benefits of connecting the ASEAN nations more deeply from an electricity point of view. I found the information presented in this study of great interest, revealing how little I knew about Australia’s neighbours.
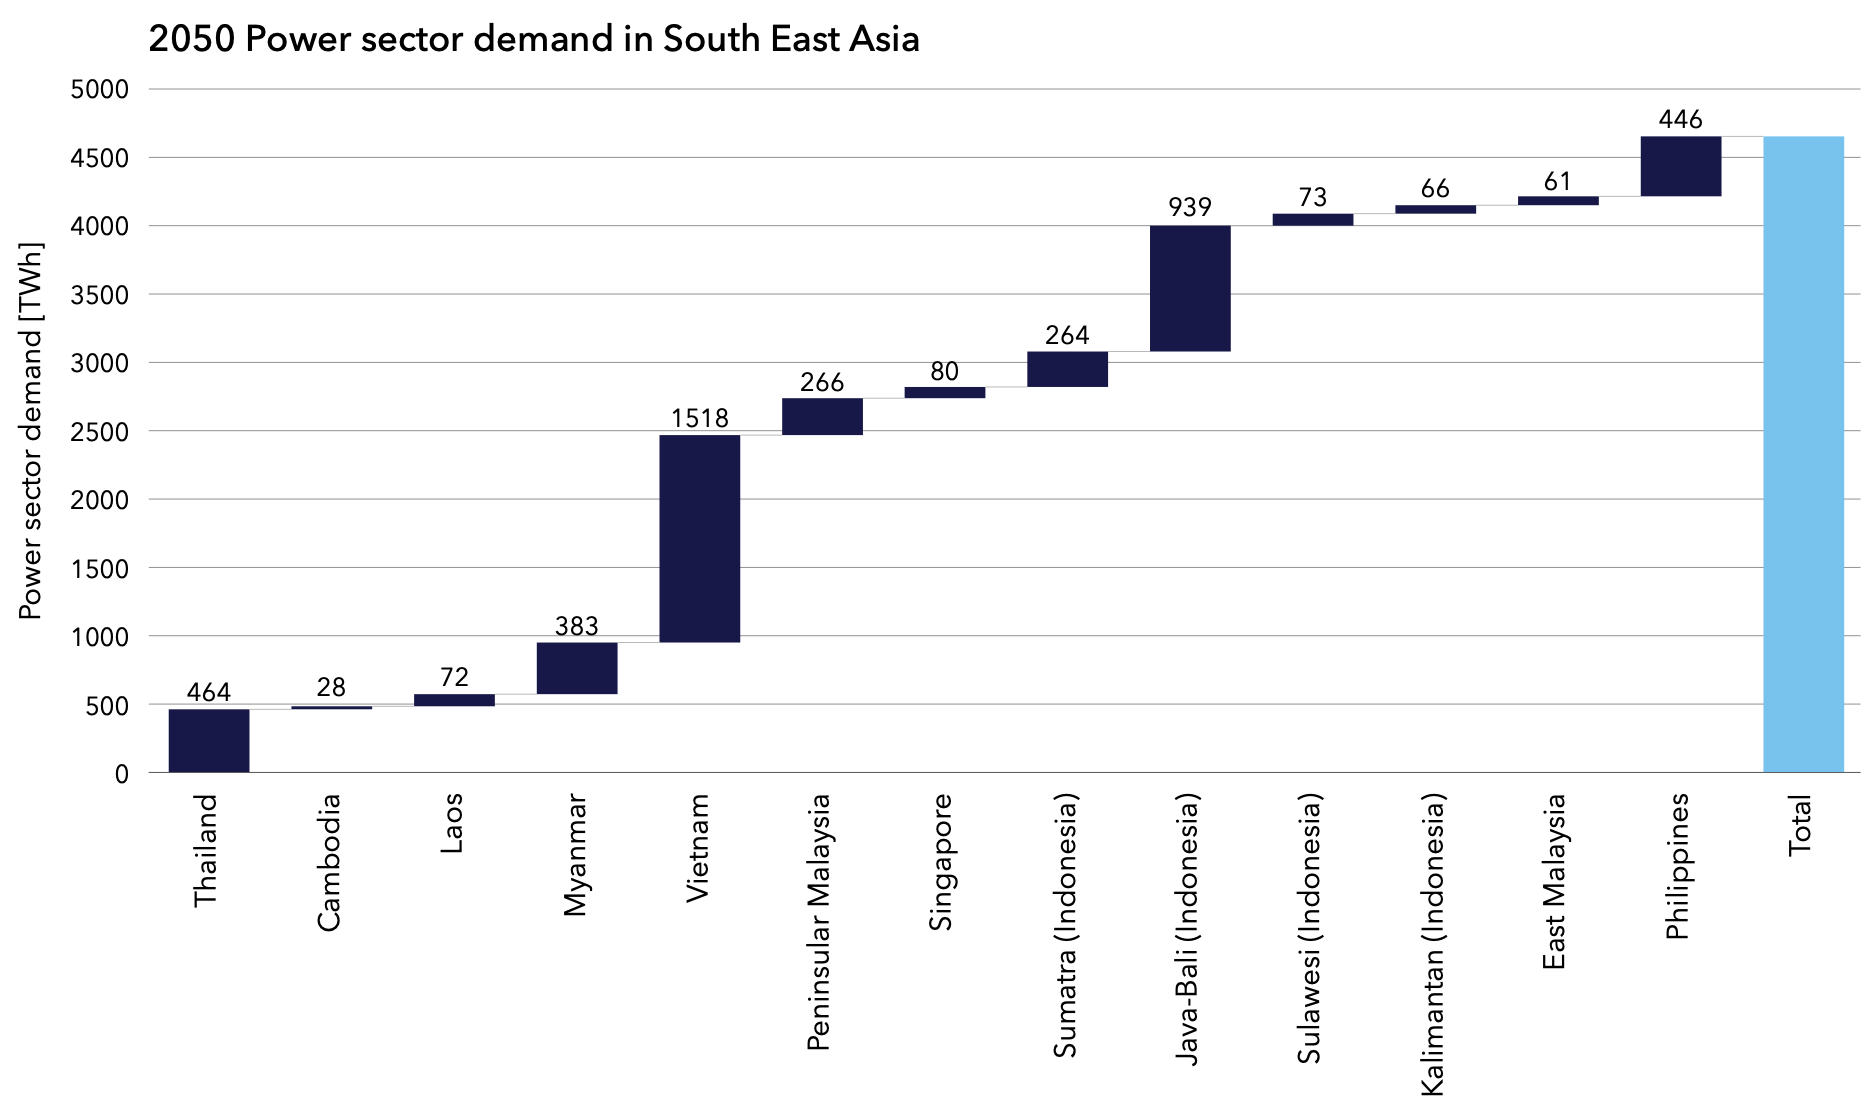
The surprise, to me, in electricity consumption, and this chart is for 2050, is Myanmar, comparable to Thailand. For Asean overalr 4.5 PWh in 2050 compares with 2023 China consumption of 8 PWh. Although the forecast will be wrong its yet another reminder of, depending on your personality, the opportunity or the challenge. From today’s perspective there is still almost unbounded growth ahead for renewable energy. The opportunity is large.
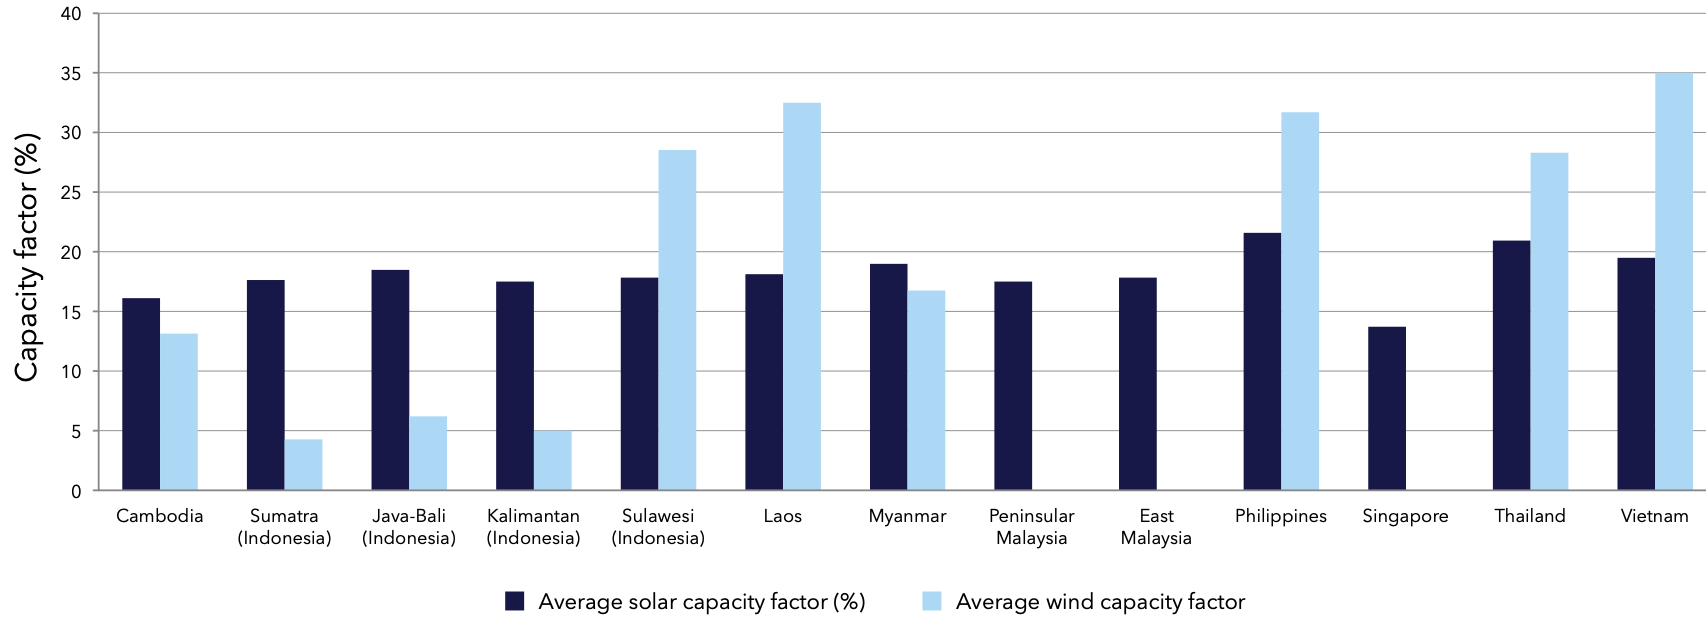
The next point was to note how low the expected onshore wind capacity factors are in say Indonesia, Myanmar and to a lesser extent even Thailand. And that as presented, the solar factors are also no better than rooftop results in Australia. An apparent limitation of the DNV study is that solar capacity factors appear to have been calcuated for fixed ground mounted solar on a DC basis. Quite different to how its done in many places.
Using those capacity factors results in the following solar and wind capacity required for each country to decarbonise before considering the region as a portfolio and then the required transmission.
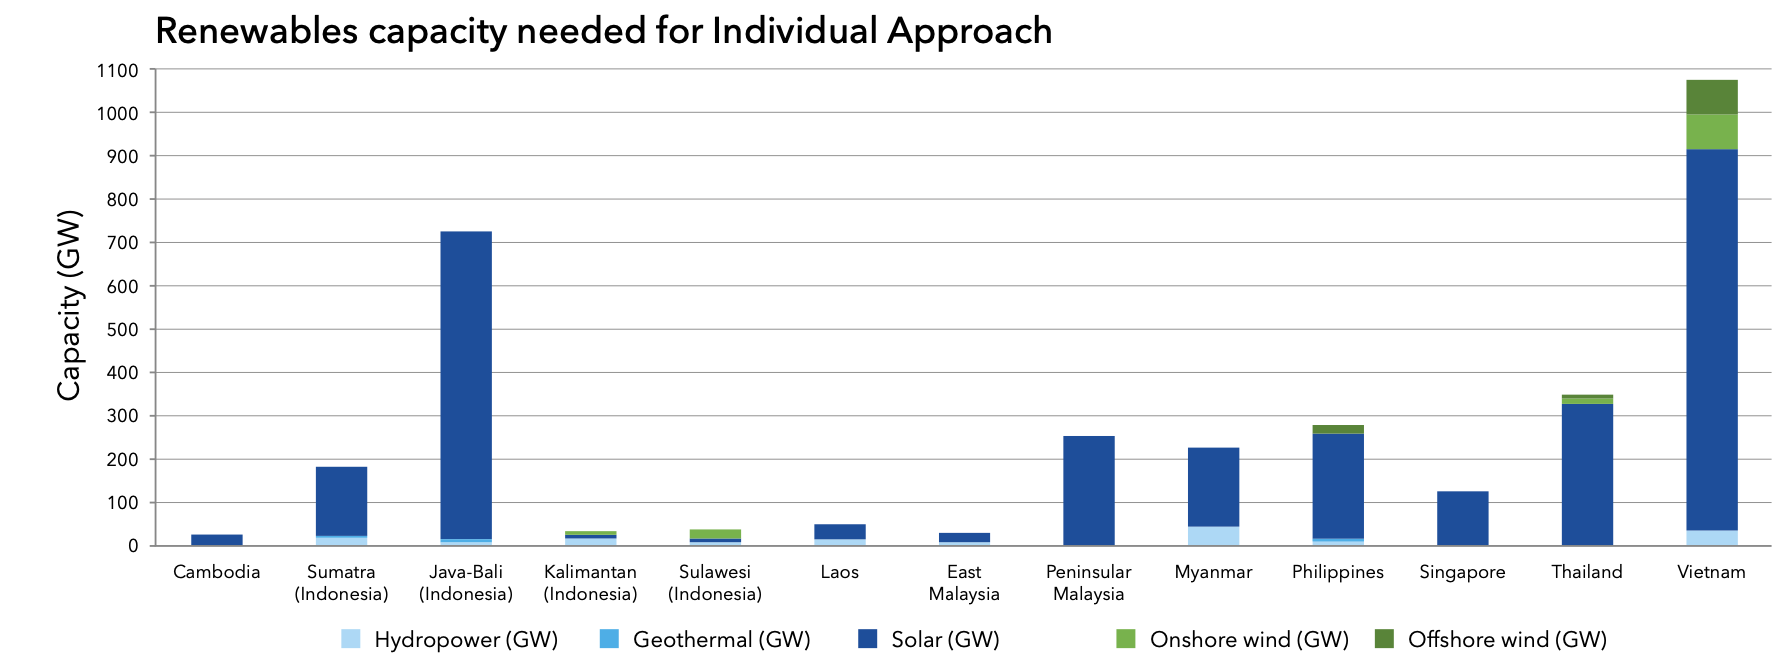
To this must of cousre be added storage, transmission and hydrogen. DNV estimated the total cost at somewhere in the US$6-8 trillion level, which seems high to me. However Figure 6 also broadly illustrates that Vietnam and Bali have potentially big roles to play.
Limited interconnection at present
The ASEAN interconnection grid has been a concept since 1997 and has a conceptually supported study known as the Asean Interconnection Masterplan Study (AIMS). Three such studies have been done, in 2003, in 2010 and in 2021. As is usual with transmission the benefits are:
- Economic (a portfolio impact);
- Security (insurance);
- Facilitates decarbonisation.
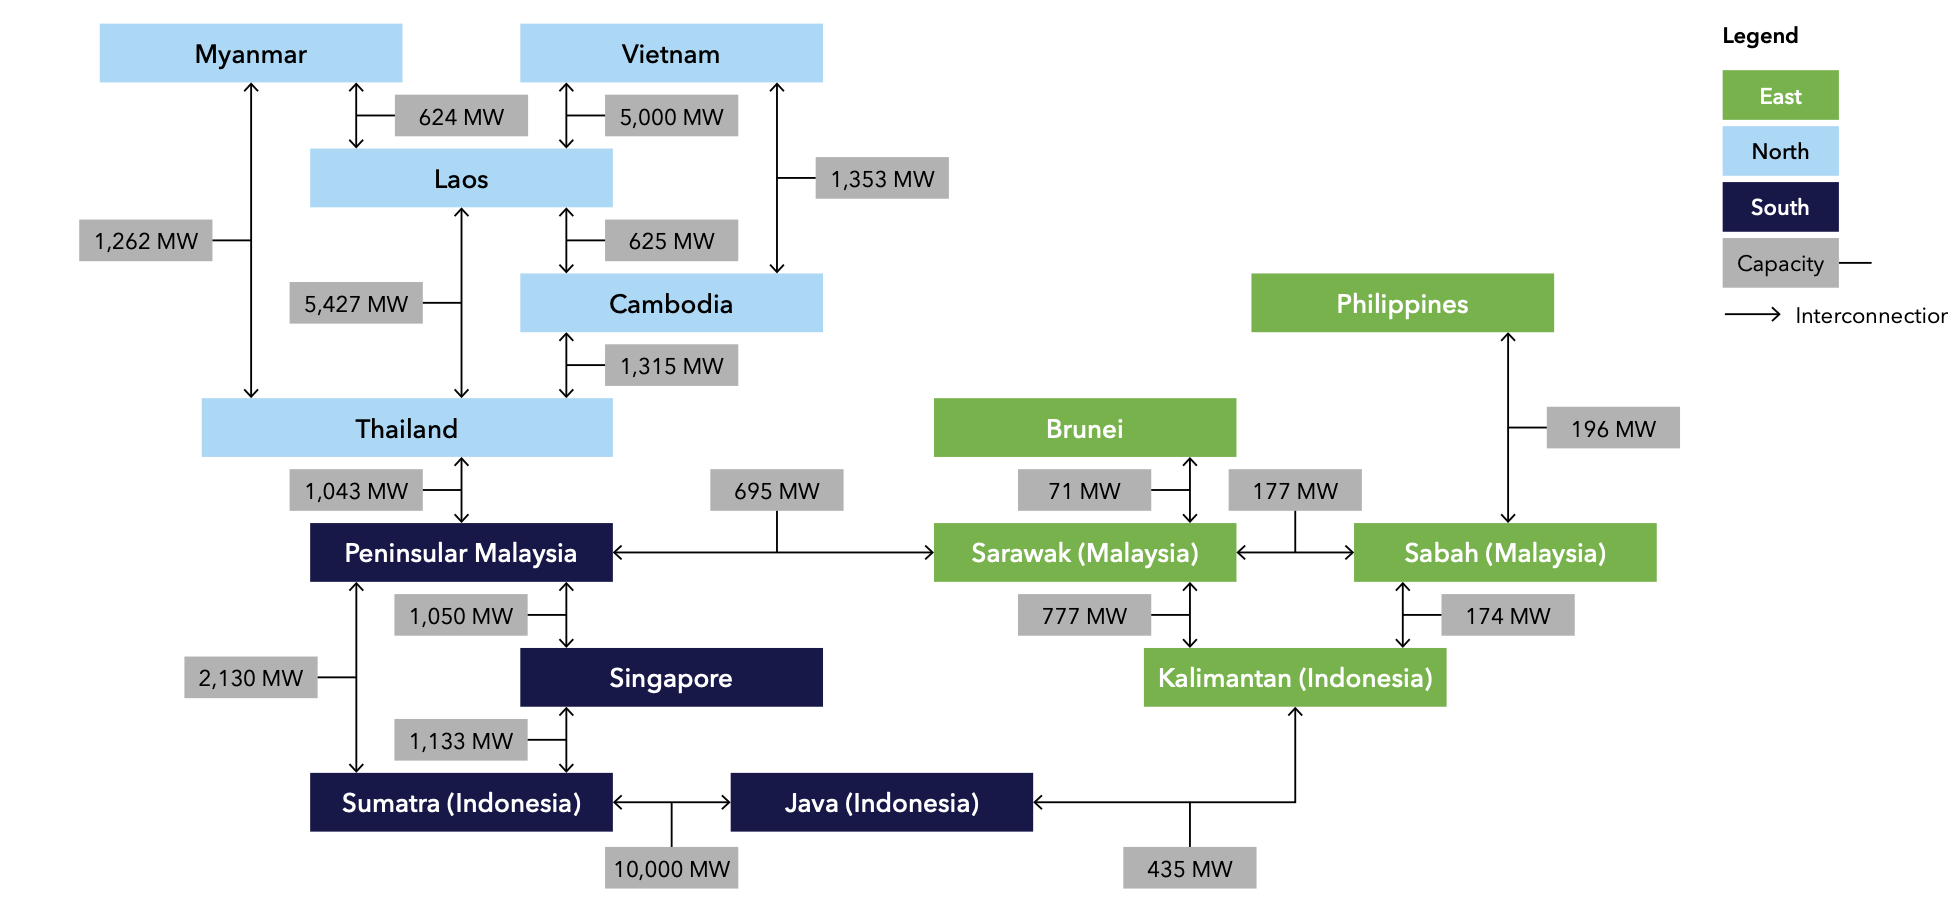
The latest version of the AIMS plan appears to envisage links between countries typically round the 1 GW level:
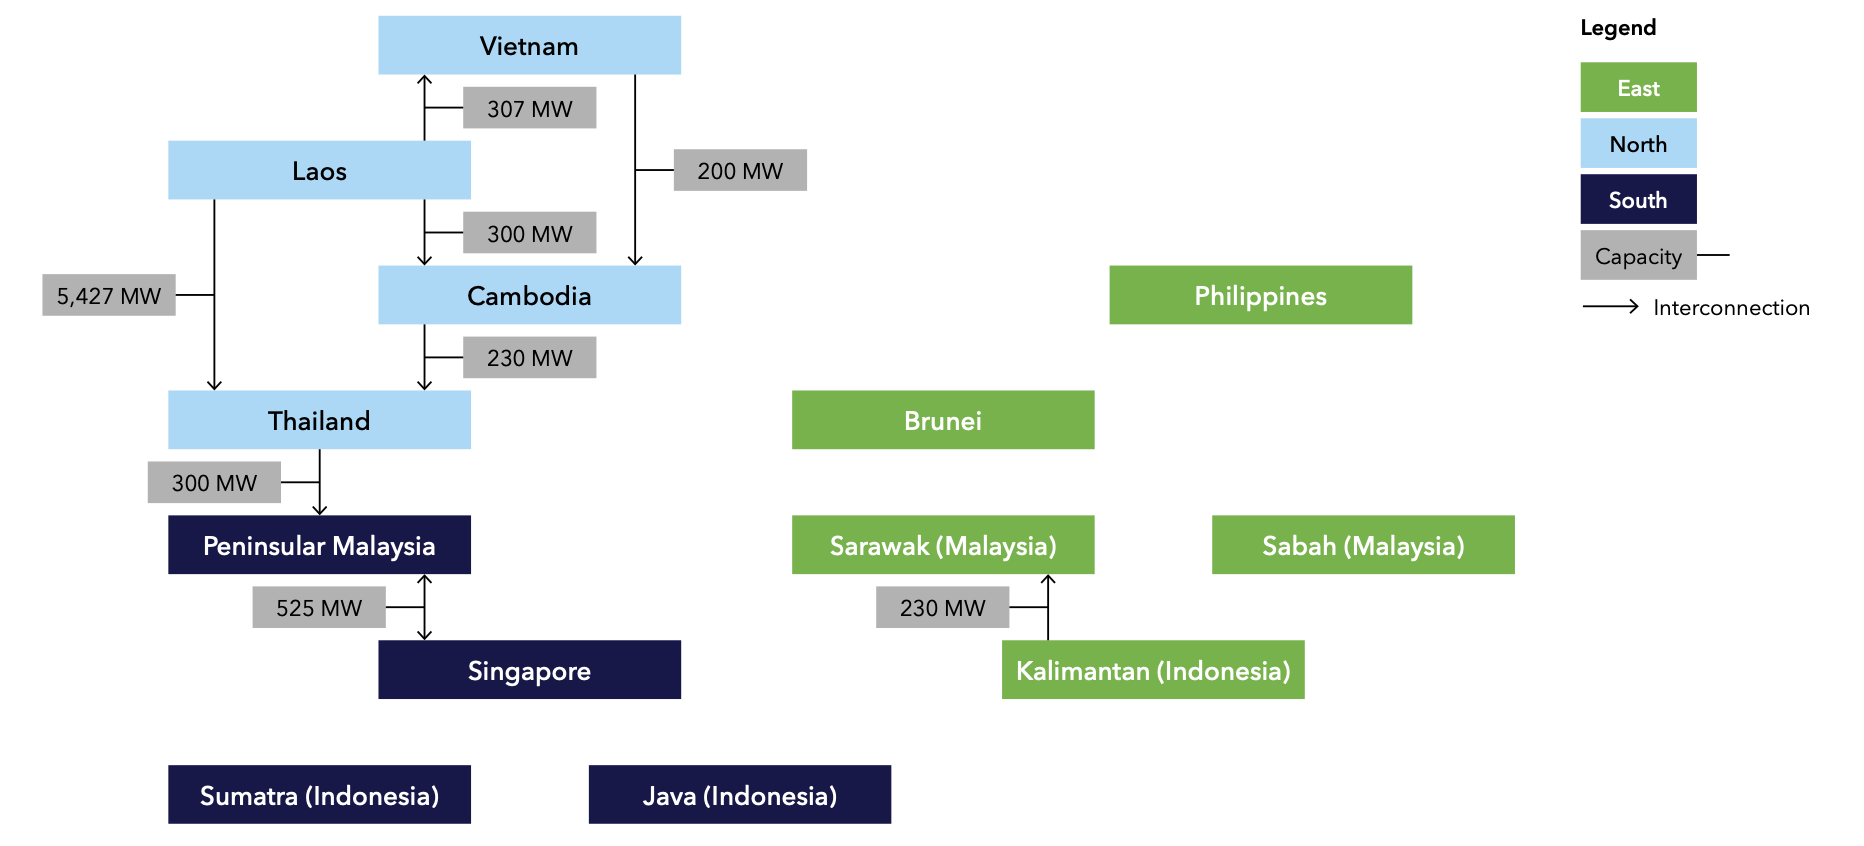
The modelled outcomes compare with the very limited existing transmission links other than between Laos and Thailand.
DNV max transmission case seems aggressive.
Its great to read the results of the DNV study which suggests that up to US$1 trillion can be saved on the decarbonisation journey by building stronger interconnectors but I must say I raised my eyebrows when I saw interconnectors as big as 286 GW in the modelled solution. A solution which also required considerable hydrogen flow. Outside of China, as far as I know transmission capacity greater than 10 GW on any single route is quite low. China’s largest single line under construction is the astonishing 1600 km, 800 KVA Ningxia-Hunan link. By my often faulty arithmetic that’s an 8GW link capable of shifting 40 TWh (20% of NEM wide consumption).