Modelling spot prices in a post-coal NEM
Our analysis finds that electricity prices can be kept near today’s levels in a post-coal NEM under the current, energy-only market design, but require a system in which solar is structurally supported and batteries become the dominant price-forming technology. Alternatively, more gas might do the same job.
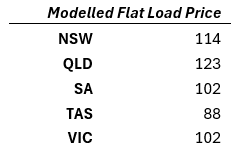
We test this by modelling the calendar year 2040, under the assumption that all NEM coal-fired generation (including Queensland) has exited the system. An optimiser is used in conjunction with ITK’s half-hourly spot price dispatch engine 1: to determine the lowest-cost capacity mix of utility-scale solar, onshore wind and battery storage (2-hour and 8-hour durations modelled), subject to those technologies earning a return on capital and the volume-weighted average electricity price remaining below a defined ceiling.
Optimised capacity mix
Capital cost assumptions come from CSIRO’s latest GenCost draft. More detail included in methods.
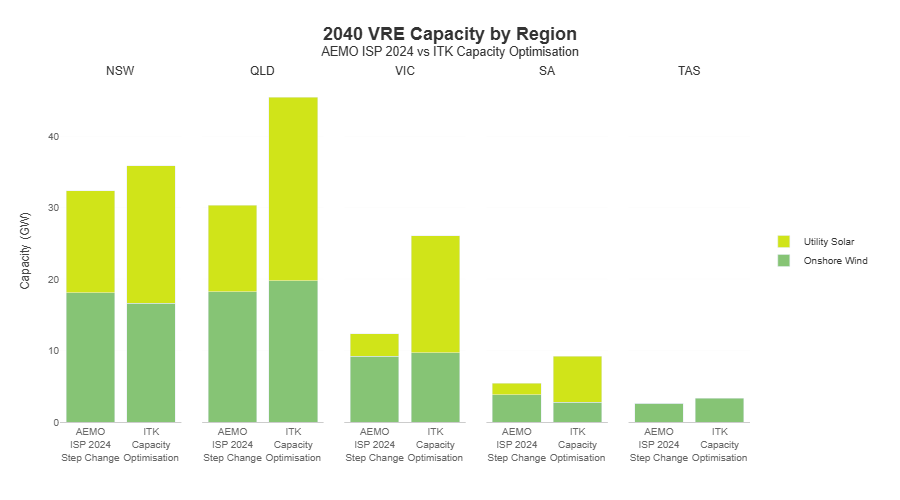
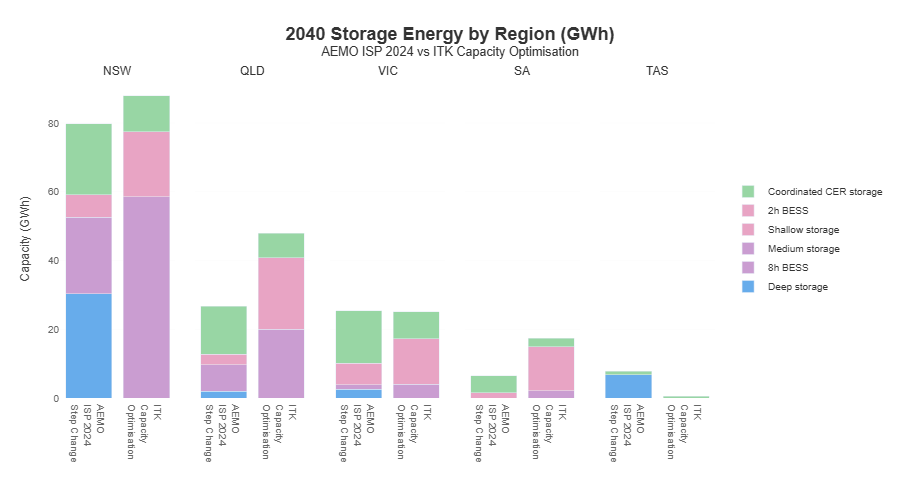
Due in part to continued capital cost reductions for BESS and also its dispatch flexibillity compared to wind, the optimiser favoured a much more solar/BESS heavy mix than AEMO’s 2024 ISP Step Change scenario. In particular, QLD, VIC and SA solar capacities were far higher than Step Change. The optimiser results also indicated sufficient investment incentive for additional gas capacity - we assumed Step Change capacities for mid-merit and flexible gas - but this will be discussed in future analyses.
The charts below compare our optimum capacity mix to Step Change.
Solar requires external support
Significant buildout of solar and BESS is required to support coal exit by 2040 and maintain reasonable prices for consumers. The indicated requirement of substantially higher total VRE capacity by 2040 compared to step change is reflective of the nature of the two analyses: namely, the ISP focusses on system reliability, but we are modelling electricity prices with an optimisation that requires them to be below a reasonable threshold.
Utility solar is essential to the system, but in aggregate won’t pay for itself through merchant revenues alone. In every scenario we tested, merchant solar returned poor ROI. When we forced the optimiser to hit solar ROI floors, it broke something else: either electricity prices rose beyond reasonable levels, or returns from wind and storage were cannibalized to compensate. This reflects the reality that solar’s value is increasingly systemic rather than merchant.
Thanks to batteries and wind, intraday prices are flatter post-coal
Based on current VRE project pipeline, policy knowledge, industry outreach, and modelling we construct a base case capacity buildout regime from 2026 towards the optimized 2040 capacities. We then use our dispatch engine to forecast half-hourly generation mix, interconnector flows and electricity prices for that horizon.
The intraday price curve flattens as price formation shifts. Sharp morning and evening spikes - forming the “duck curve” characteristic of the NEM, particularly over the past 3-4 years - are replaced by lower-amplitude, broader price profiles, and extreme daytime price collapse is largely avoided. This reflects a large expansion of evening-available capacity (wind and BESS) and substantial daytime battery charging demand that absorbs surplus solar. At the system level, aggregate battery state of charge becomes a dominant price driver: high fleet-wide state of charge increases dispatch willingness and suppresses prices, while lower state of charge during periods of mid-to-high demand tightens effective supply. Examples of this SoC-Price relationship already exist, and this WattClarity Article by Allan O’Neill goes through a specific one. The result is a subdued traditional evening peak, but prices that remain elevated for longer into the evening as batteries progressively discharge.

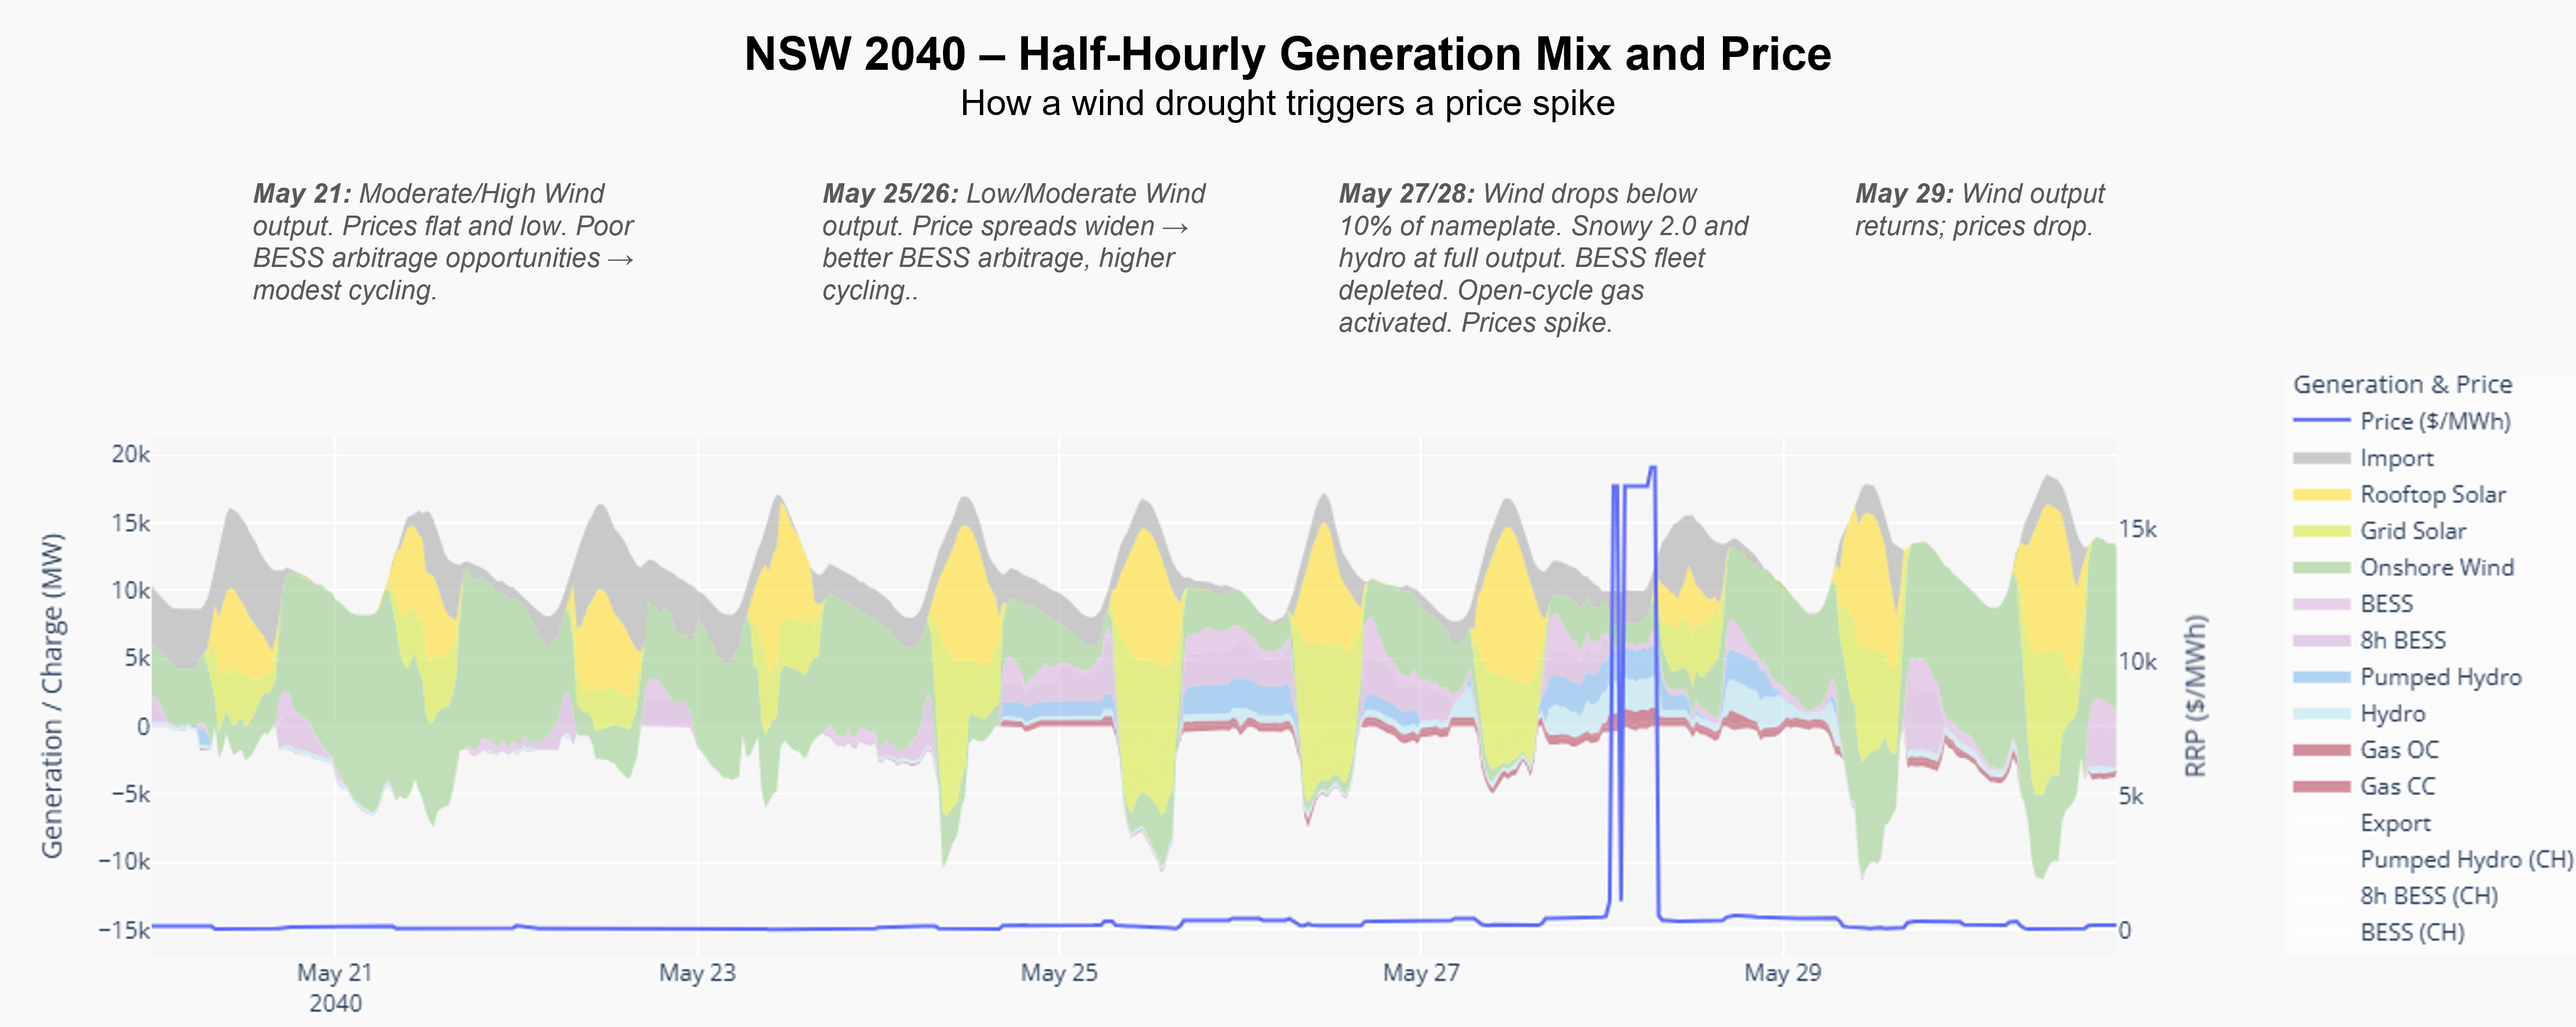
Price spike mechanism during wind drought
The chart below illustrates a common price-spike mechanism in our post-coal modelled NEM. A sustained drop in wind output initially widens intraday spreads, encouraging higher BESS cycling. As the wind shortfall persists, deep storage and pumped hydro are progressively dispatched and the aggregate battery fleet is materially depleted. Once stored energy is exhausted, peaking and reserve gas sets the marginal price, resulting in sharp scarcity-driven price spikes.
Prices become more seasonal
In periods of low residential demand and strong wind output, prices remain persistently low for extended stretches. Most volatility and high-price outcomes are concentrated in winter, when residential demand rises, solar output falls, and periods of weaker regional wind place greater pressure on dispatchable supply, activating reserve gas, pumped hydro and other deep storage far more frequently. 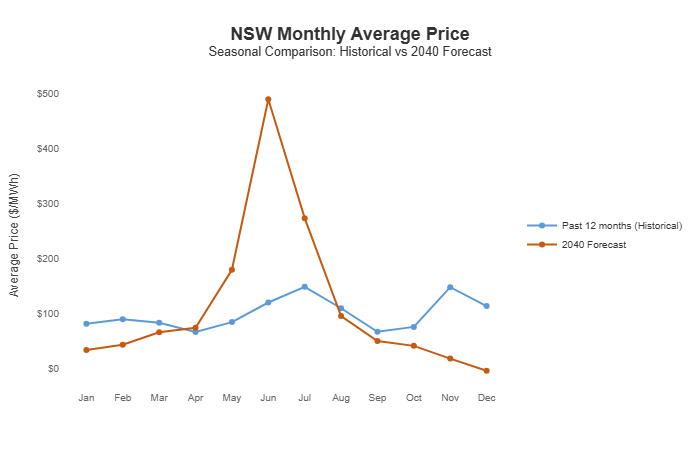
Scarcity pricing in context: frequent low prices, episodic extremes
Figure 6 places the modelled post-coal price outcomes in context by decomposing average prices into contributions from different price bands, alongside 2024 outcomes and the past twelve months. While low-to-mid price intervals continue to account for the majority of the average price, the results also show that post-coal prices are strongly influenced by scarcity events, particularly during periods of sustained low wind output. These higher-priced intervals play a material role in setting average prices, but do not dominate them, even in a more weather-driven, VRE-heavy system. This provides context that the price outcomes implied by the capacity optimisation reflect a structurally different market, yet remain anchored by frequent low- and mid-priced periods, with average prices broadly similar to today’s levels despite a greater role for scarcity events. 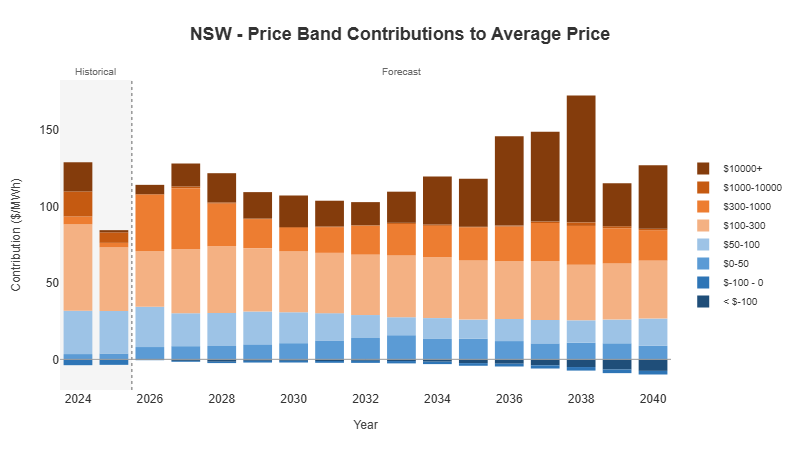
Modelling approach (optional technical detail)
Dispatch Engine
Electricity prices and generation outcomes are produced using ITK’s half-hourly dispatch and capacity optimisation framework, designed to model price formation under the existing energy-only market design and focussed on a highly renewable, post-coal NEM.
At the core of the price analysis is a linear-programming–based half-hourly dispatch engine. For each interval, generation from utility-scale solar, wind, storage (including batteries of multiple durations and pumped hydro such as Borumba and Snowy 2.0), conventional hydro, coal (in pre-retirement years), and gas (mid-merit and flexible) is represented through technology-specific bid stacks and dispatched to meet regional demand, subject to interconnector limits and a selected set of network constraints. Spot prices are derived from the marginal cost of supplying an additional unit of energy in each region, as implied by the optimisation solution, and aren’t necessarily tied to a single marginal generating unit.
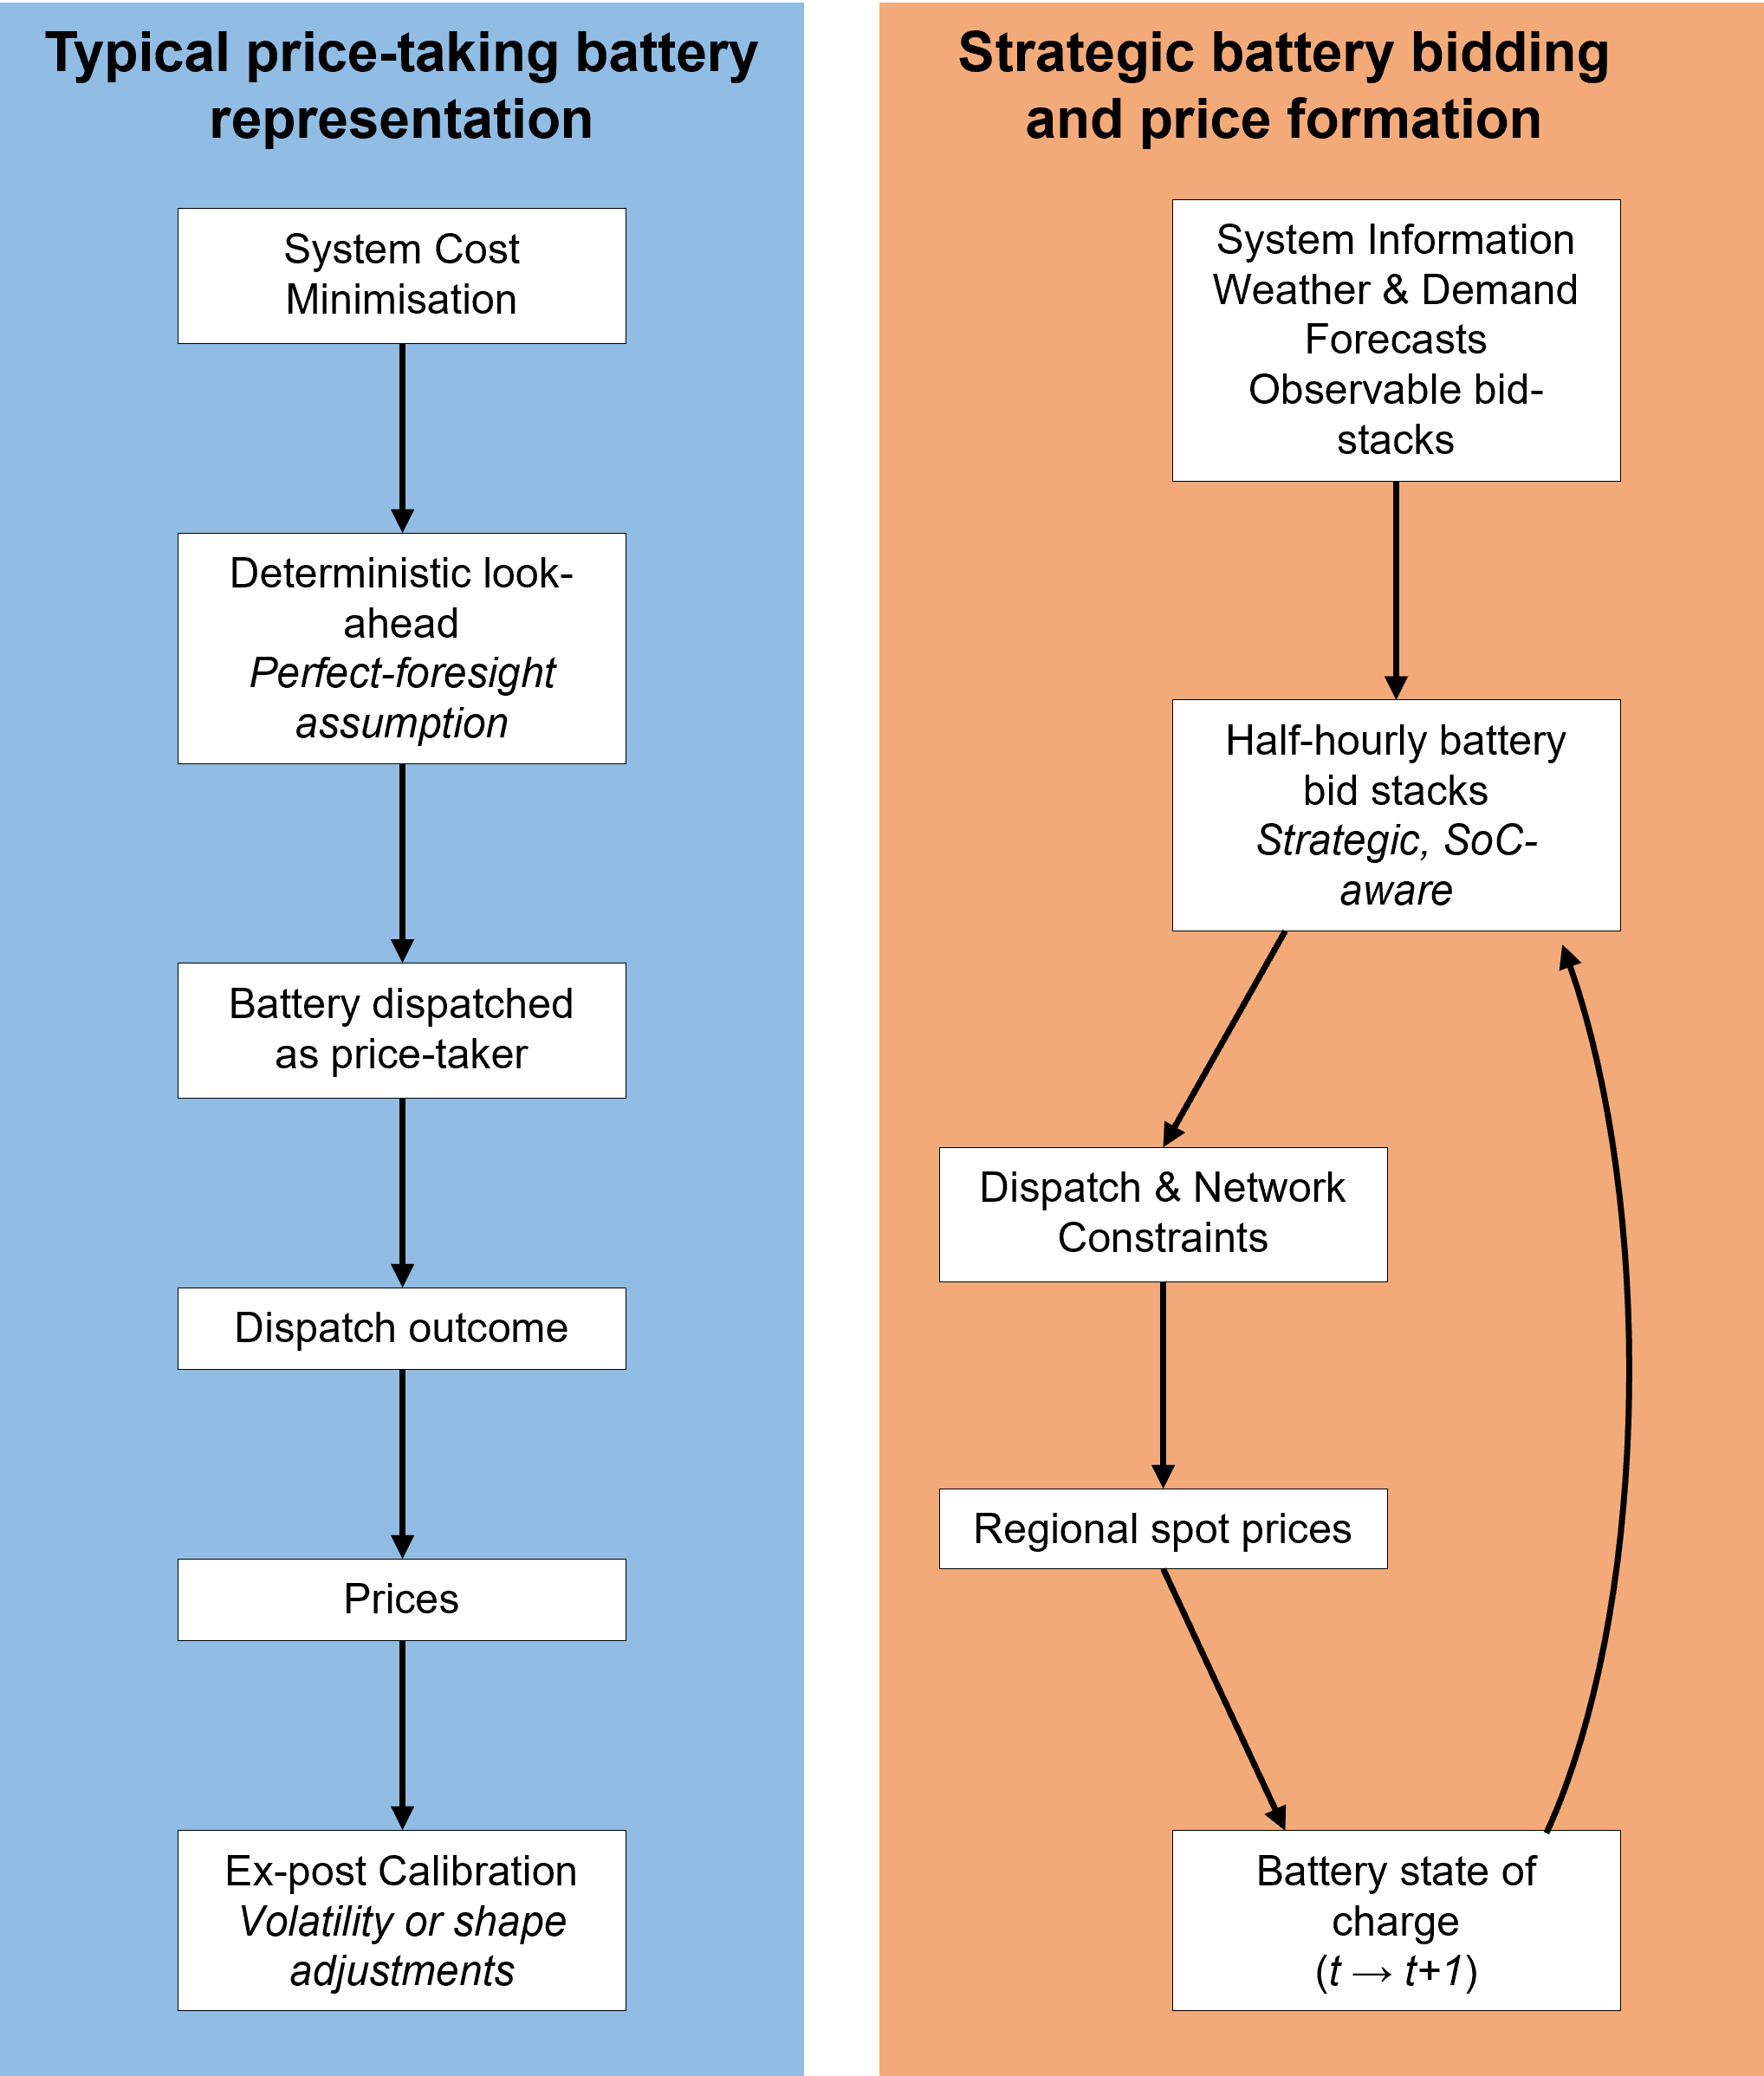
Battery storage is modelled explicitly and treated as an active market participant rather than a passive price taker. In most publicly documented long-term NEM planning models, batteries are represented as price-taking assets dispatched through system cost minimisation. This simplification was relatively benign when storage penetration was low, but becomes increasingly consequential as batteries move to the margin and begin to shape prices.
In our framework, battery state of charge is tracked through time, and charge and discharge volumes are determined endogenously via a proprietary bidding framework embedded directly within the dispatch optimisation. Rather than assuming batteries arbitrage a fixed price shape or applying volatility adjustments after the fact, we explicitly model battery bidding behaviour. Battery operators are assumed to act on information available in the real world - including weather and demand forecasts, and observable bid stacks from other participants - and dynamically position their charge and discharge bids accordingly, subject to physical energy constraints. Prices and volatility therefore emerge endogenously from the interaction of strategic bidding, intertemporal energy limits, network conditions and demand, rather than being imposed through calibration. As a result, battery behaviour materially influences both intraday price shape and system-level price formation.
While this analysis is forward-looking, the pricing framework has been exercised extensively across historical conditions and futures scenarios, and is designed to capture the dominant drivers of spot price formation under an energy-only market.
Capacity Mix optimisation
Capacity optimisation is performed for a target post-coal system year (2040) across nameplate capacities for utility-scale solar, onshore wind, and battery storage of 2- and 8-hour duration. To reflect investment realism, we impose technology-specific ROI floors and ceilings: the floor signalling returns insufficient to justify further investment, and the ceiling indicating that additional capacity would be economically attractive. A ceiling is also applied to the NEM-wide volume-weighted average spot price in 2040. Breaches of any of these constraints incur a penalty within the optimisation.
Each simulation is evaluated across 13 historical weather reference years, with reported prices and returns expressed as averages across those outcomes to ensure robustness to interannual variability in wind and solar output. The optimiser then seeks the capacity mix that minimises total system cost, with additional penalties applied where the above investment and price constraints are violated.
This approach differs from traditional reliability-focused planning models. The optimisation is not designed to meet a prescribed reliability standard; instead, it solves for capacity mixes that are economically viable under an energy-only market while keeping prices within a reasonable range for consumers. Simplifying assumptions are made deliberately: FCAS markets are not modelled explicitly, unit commitment dynamics are abstracted, and thermal plant - we delineate coal, mid-merit gas and flexible gas - is represented as flexible reserve capacity per region rather than as individual units. The objective is to capture the dominant drivers of price formation and investment incentives in a post-coal system, rather than to reproduce full operational detail.
For this analysis we select a CMA-ES (covariance adapataion matrix evolution strategy) optimiser because the capacity mix problem involves multiple interacting technologies and regions, and each internal evaluation leverages our model’s full dispatch simulation. Such an optimisation does not lend itself to simple or reliable gradients.
Appendix
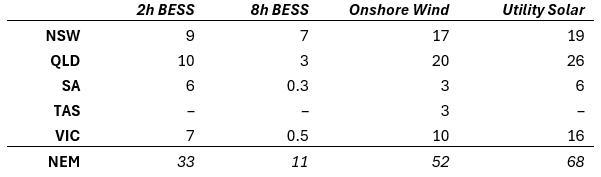
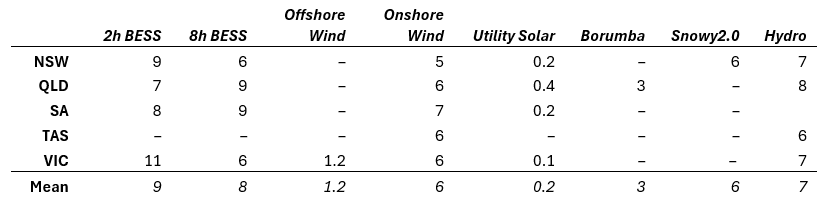
See merchant returns by technology and region below.
Table. Mean Modelled ROI (%) by region and technology for optimised capacity mix
Footnotes
Each internal optimiser run is evaluated using ITK’s half-hourly dispatch engine, which simulates generation dispatch, interconnector flows, select network constraints and spot prices across the NEM.↩︎