The main benefit of decarbonising alumina is cheaper energy, the decarbonisation benefit is secondary
Most of the excellent research that has looked at Australia’s alumina sector has focussed on the potential reduction in carbon emissions. However as an electricity analyst what I see is an absolutely massive demand response/battery. Alumina refineries in QLD can potentially provide the same amount of storage/demand response as a 2 GW/8 hour battery. To see how this can be the case, at least from within the reality distortion bubble of this note read on.
A reminder of the aluminium production process
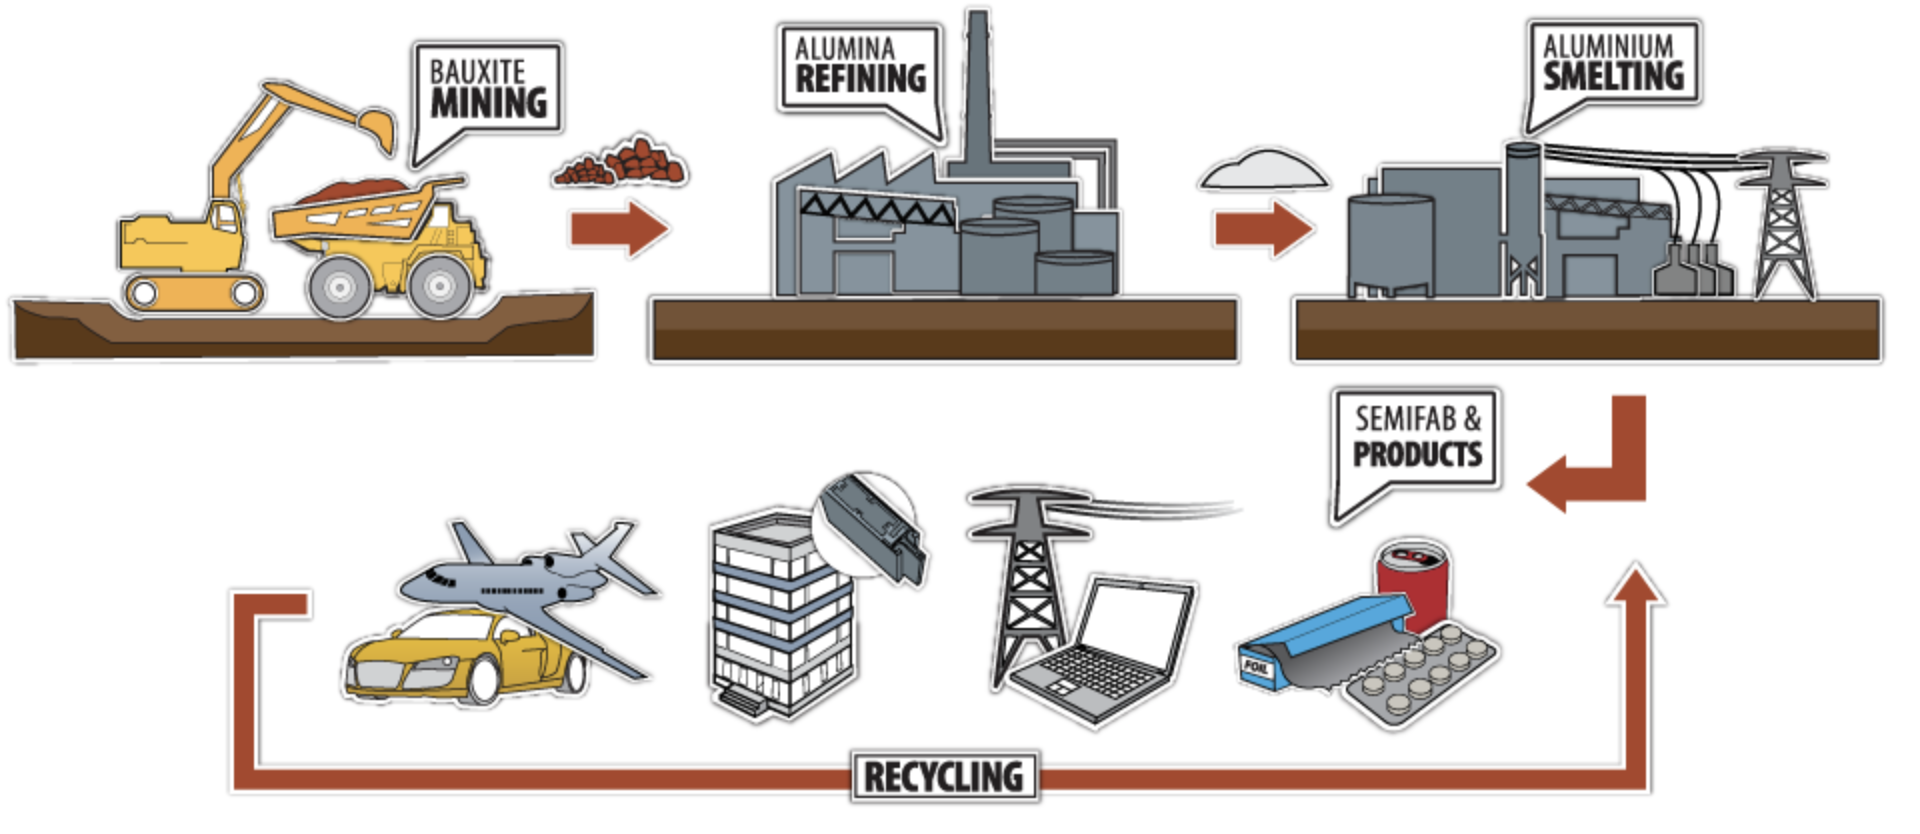
Figure 1 Aluminium production, source: Australian Aluminium Council
The aim in this note is to show the economic potential of the alumina refinery to firm renewable energy provided to an aluminum smelter at pretty much a break even price. Or at least its a break even in my reality distortion bubble. Decarbonisation is a side benefit. So is freeing up 46 PJ of annual gas consumption to remain in the ground.
Aluminum is 10% of NEM electricity consumption
Aluminum is still about the largest single consumer of electricity in Australia. Its responsible for 10% roughly of consumption in each of NSW, QLD and Victoria and probably more in Tasmania.
For some years many of us having been thinking about how to replace coal fuelled electricity with renewable electricity for aluminum smelting. However the difficulty (thanks Matt Howell ) is that aluminum smelting is basically a non interruptible process. Although you can cut power to a smelter for a couple of hours every now and then, doing so impacts the “pot” life and its really not what the process wants to do. So aluminum production is much better suited to something like hydro than to wind and solar. So in the absence of any intervention you would basically expect global production of aluminum to shift from coal intensive areas like China to hydro intensive areas like Russia and Canada as decarbonisation becomes a bigger and bigger deal.
This means that Australian smelters are at risk of closing. They face environmental costs which their Chinese competitors do not and they are not as easy to repower as it might seem. Even though smelter owners are notorious for wanting government handouts the basic reality is that they sell the product in a global market and it has to be one way or another globally competitive. This can be on cost where electricity is normally the sole differentiator of costs or it could be on value if there was say a “green” premium. But basically its cost.
Even though Australian wind and solar costs are likely very competitive with hydro it’s the firming component that’s difficult. So what looked like the obvious way to go about things was maybe not so obvious. Recently though I’ve been thinking a lot about the intermediate step in the aluminum process and that’s alumina.
Australia currently produces 14% of the world’s alumina
Australia has the largest, but not necessarily most economic, reserves of bauxite and Australia is a significant global producer for alumina. However, at least in Queenland the alumina refineries are old.
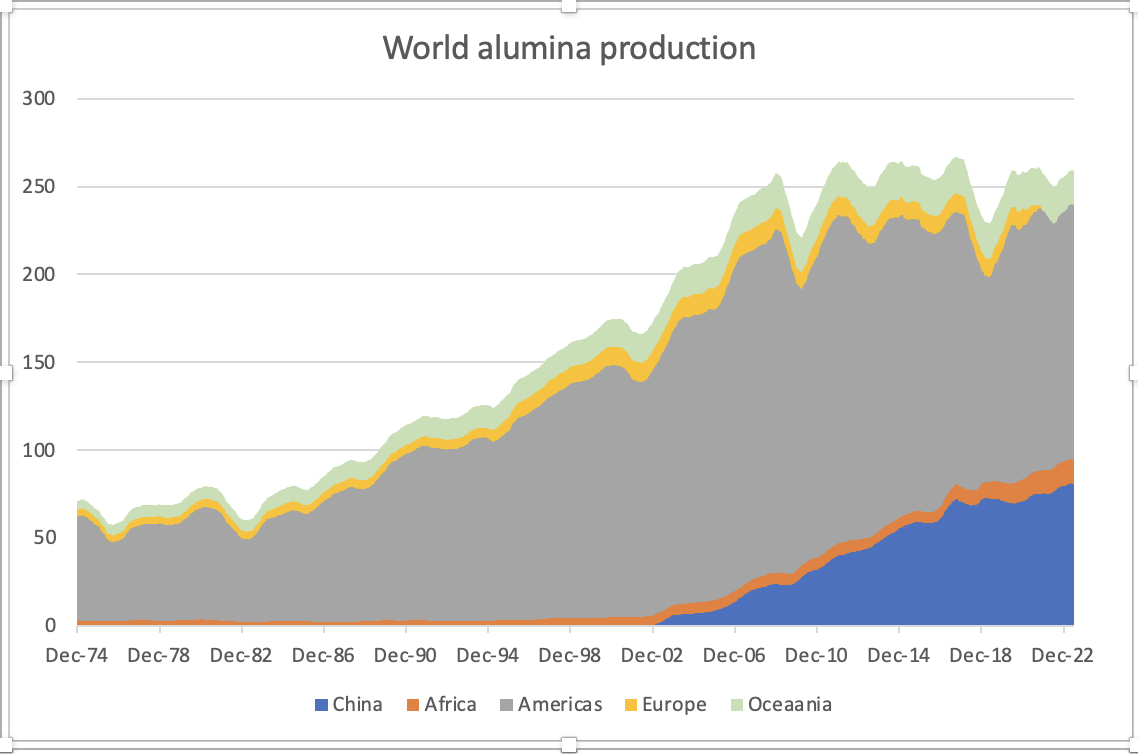
Figure 2 Global aluminium production. Source: International aluminium institute
Alumina is behind only LNG and power generation as a gas consumer in Australia
The next thing to appreciate is that alumina is the largest single consumer of gas in Australia outside of electricity generation and LNG production with total consumption in excess of 220 PJ. The overall flow of gas in Australia is shown below and I tip my hat to an excellent Sankey diagram:
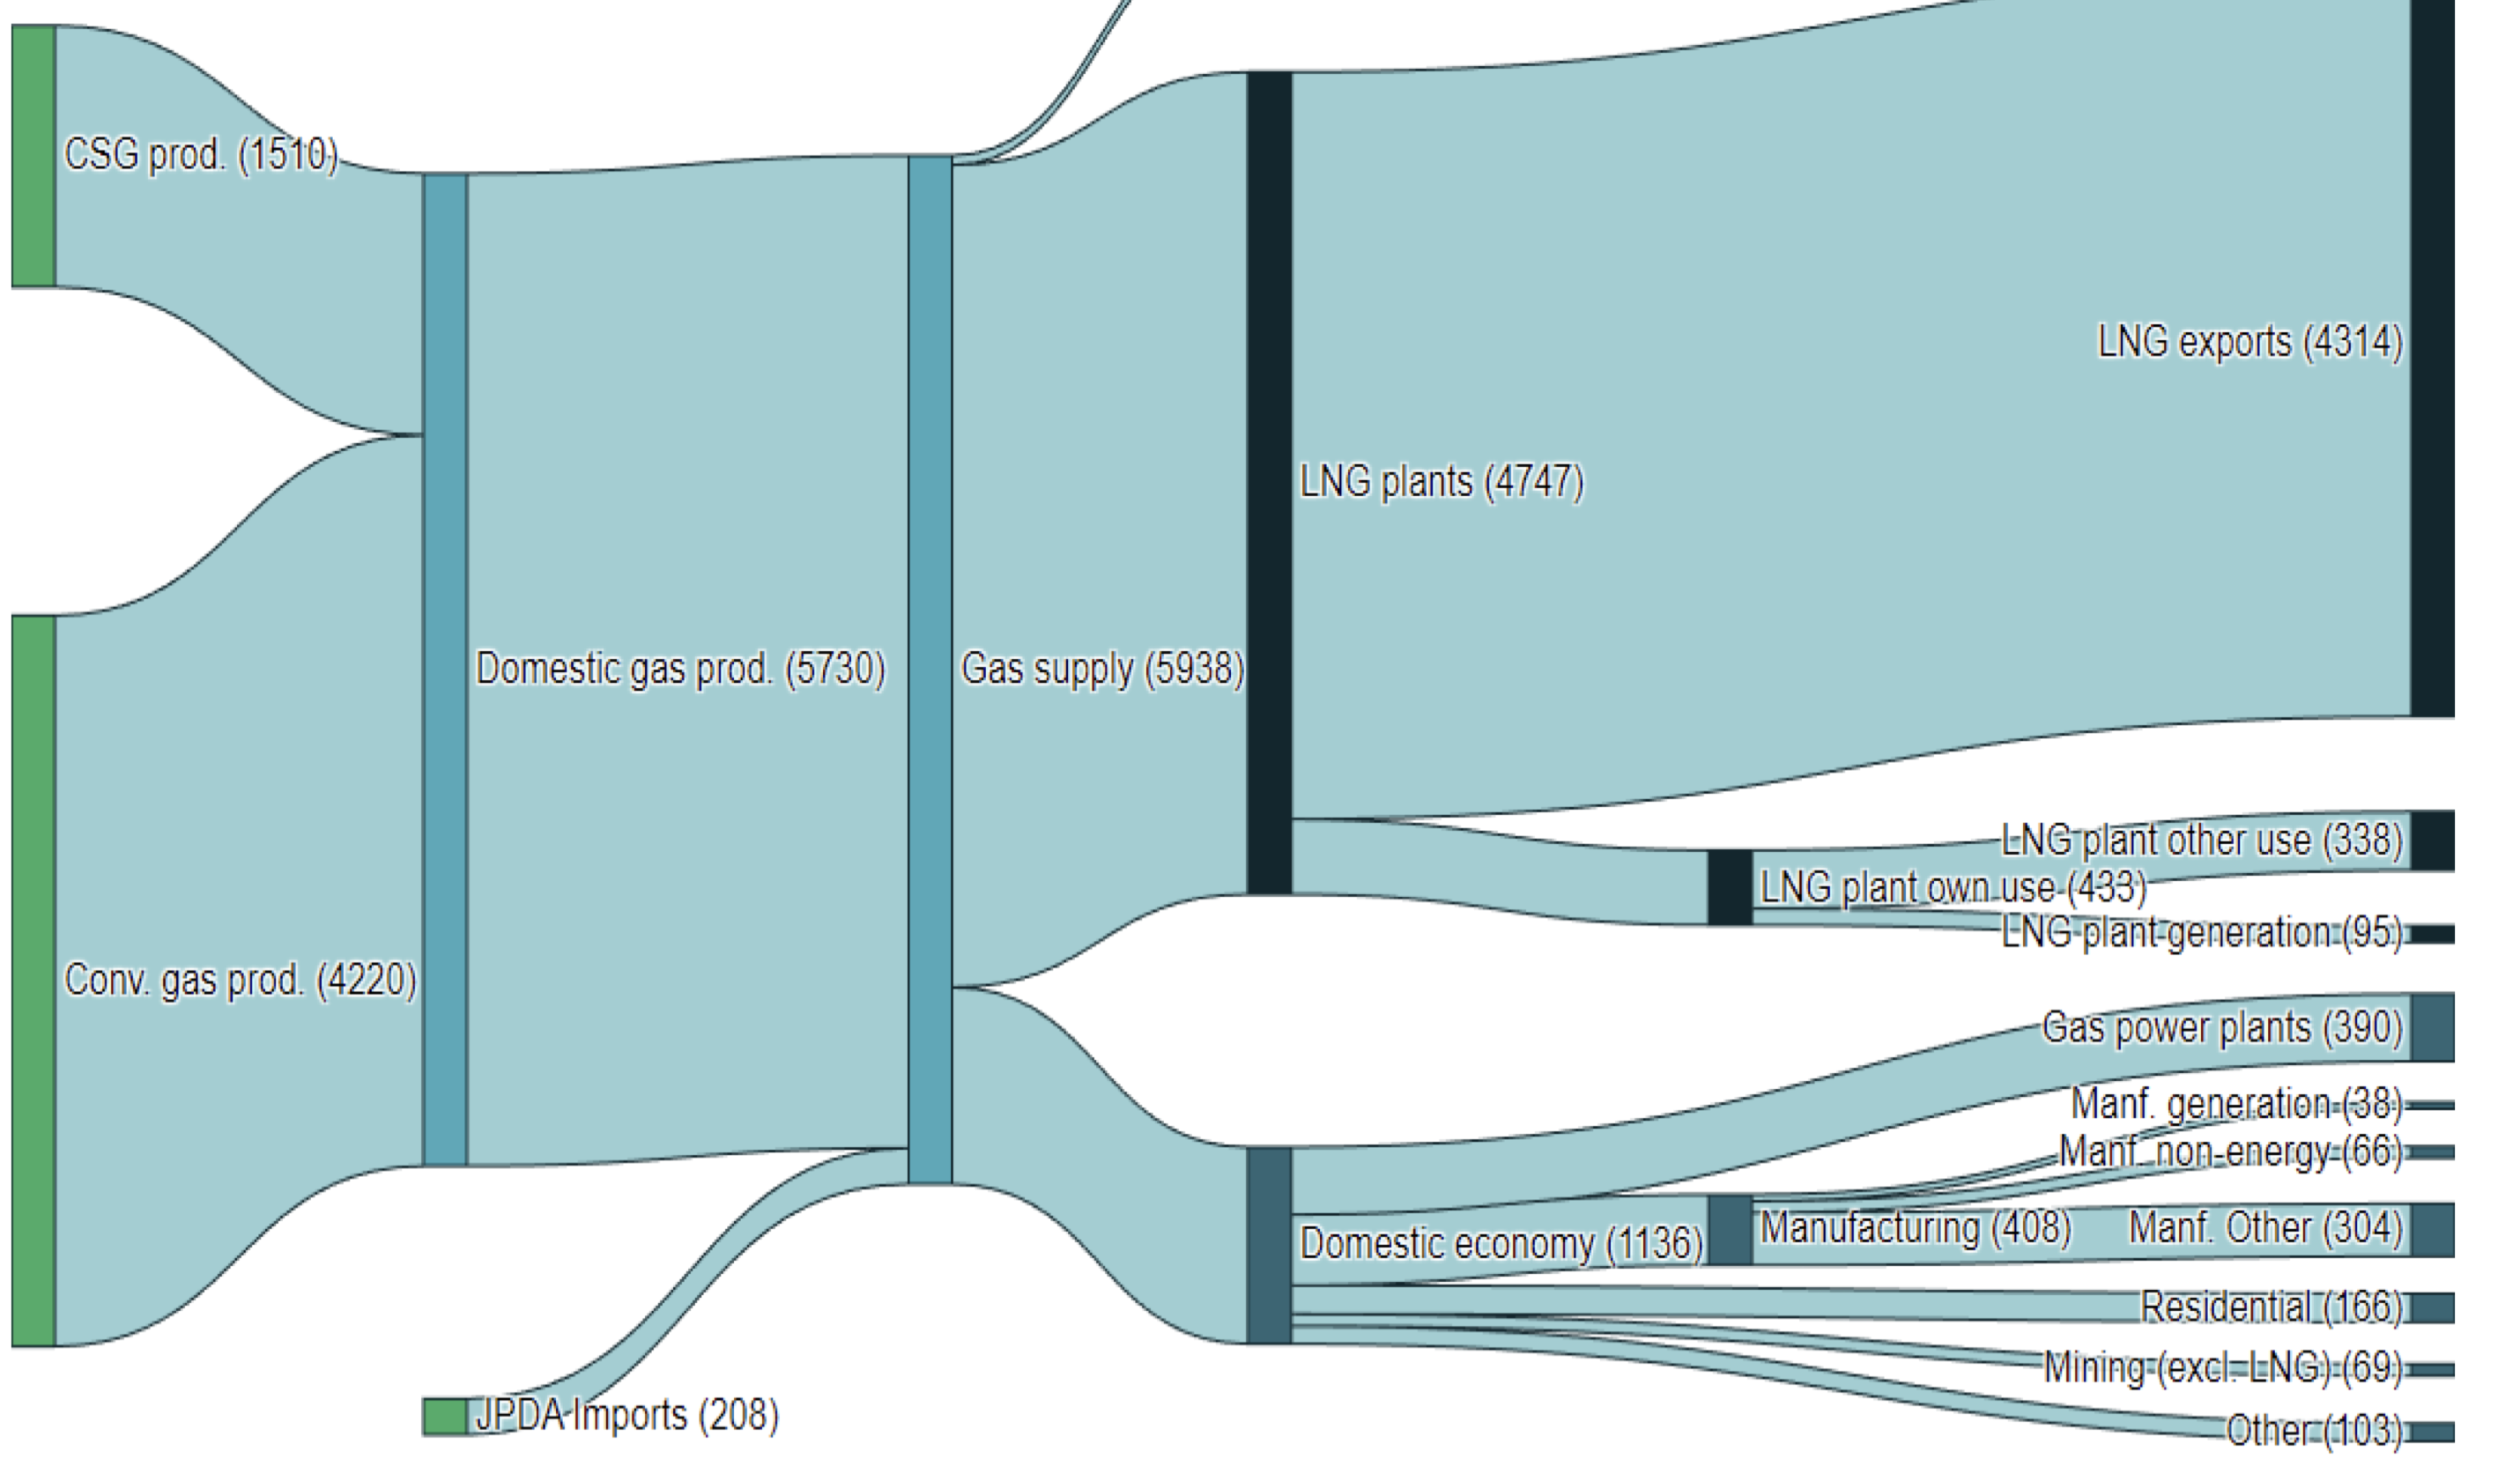
Figure 3 Australian gas production and uses. Source: Dept of Climate change
Eliminating gas in alumina would have a bigger impact than eliminating gas from all residential consumption let alone new consumption.
Alumina refineries are well suited to solar power, they can offer very large scale demand response.
The most important point to understand in this note is that alumina refineries and particular the digestors are flexible. Like a pot on the stove they can be turned up and down with no damage other than a loss of production. This potentially makes them incredibly useful when coupled with solar energy. It also may be possible, ah say MAY be possible, to store excess process heat from the digestor and release it over night.
So the ultimate idea is to run the flexible alumina refinery and the aluminum smelter next door on solar and wind energy. The refinery is run mainly on solar during the day with the excess heat stored. Over night the refinery cuts its wind solar input right down and supplements it with stored heat. The wind that the refinery consumes during the day then becomes available to the inflexible aluminium smelter next door to replace essentially lost solar production.
In addition any time the wind and solar input has a drought it’s the flexible refinery that takes the hit and the smelter largely keeps on going.
External firming may still be required but much less often freeing up the firming capacity, eg Borumba, for other uses. Indeed for those rare occasions where State wide there is such a drought that the refinery and Borumba cant handle it then backup generation (eg gas) is called into action.
The alumina production process
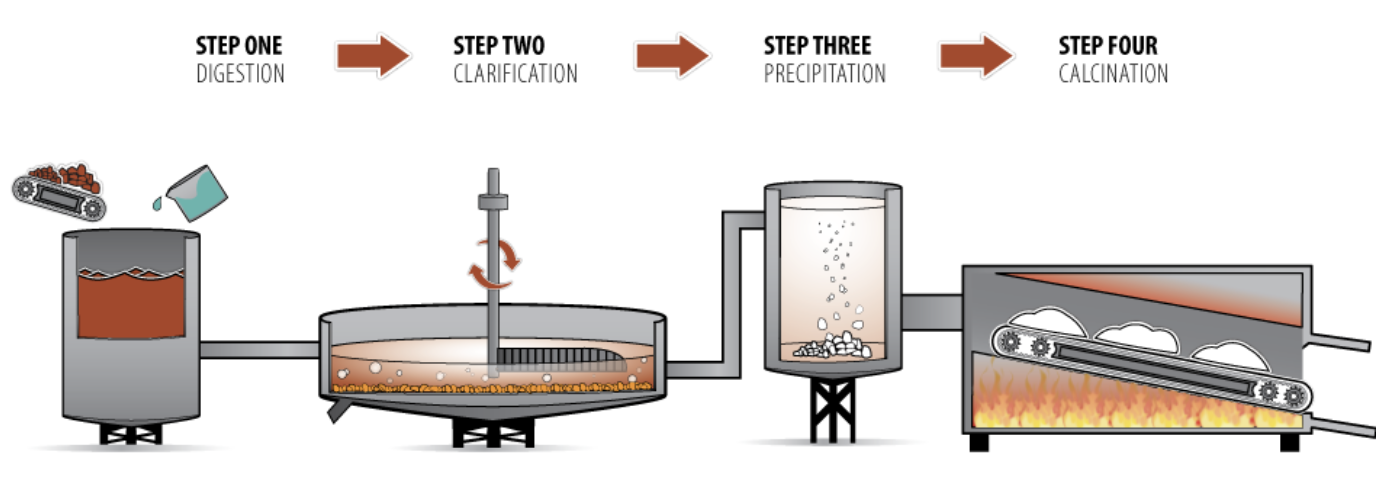
Figure 4 Alumina production process. Source: Australian aluminium council
The digestor consumes about 2/3 of the energy used in an alumina refinery and about 1/3 is used in the calciner. To cut a long story short to decarbonise the calciner most likely requires hydrogen. I ignore the more expensive problem of decarbonsing the calcining leg of alumina manufacturing..
The digestor which is basically a steam kettle can, if you were building a new refinery, “easily” be made to run on electricity and at relatively high efficiency. In the most basic view you just replace the gas heat with resistive heating.
Focus on QLD as no aluminum in WA
Using alumina refineries as demand response/batteries doesn’t require a coupled aluminum smelter but if they are coupled as in Gladstone it fits in very nicely with the coordinated industrial region approach that is increasingly regarded as the lowest cost and most efficient way to approach industrial decarbonisation see Climate works report. Indeed the use of alumina refineries as storage/demand response is exactly the sort of thing that emerges from a broader look.
A quick estimate is that the digestors use around 12-13 TWh of energy in QLd
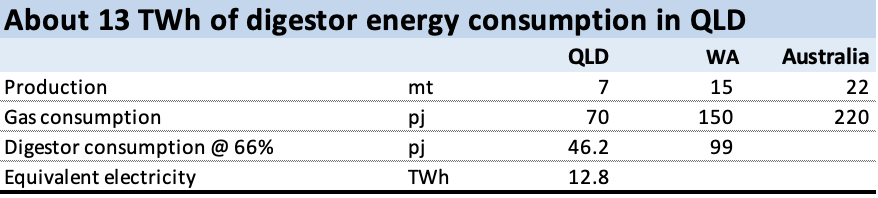 Figure 5 Alumina digestor energy. Source: Derived from ARENA report
So the alumina refineries in QLD use more energy even in the boilers, and before considering “double digestors” than the aluminum smelter.
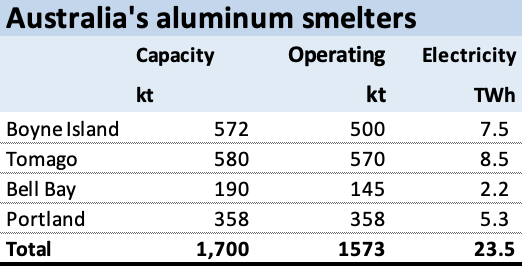
Figure 6 Australian aluminium smelter capacity. Source: ITK
So the combined QLD position is a requirement for about 22 TWh of renewable energy of which 60% is flexible demand:
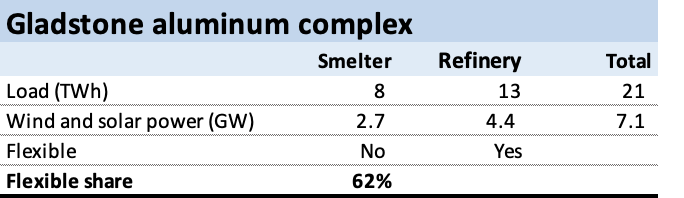
Figure 7 Gladstone aluminium complex. Source: ITK estimates
However since the idea in this note is to store digestor heat from solar energy we need more solar and more GW.
The first thing to note is that QLD total operational consumption was about 54 TWh last year so adding in the alumina refinery adds about 25% to consumption. Equally it frees up gas for other uses but that is of no concern to this note. 13 TWh is broadly equivalent to 1.4 GW of flat load and if we consider it to be a battery its about 70% the proposed size of the power that Borumba can provide. I won’t bore anyone with social license issues but unless I am even more clueless than I think I am then providing a clear future for the refineries is likely to be a social license winner.
What it would require is 12 rather than 8 GW of wind and solar, the more solar the more GW. But in fact its more than that, because enough power has to be produced in the middle of the day to fill the refinery storage for overnight operation. I compiled the portfolio to ensure that on average there was enough renewable average to cover demand for every half hour of the average day.
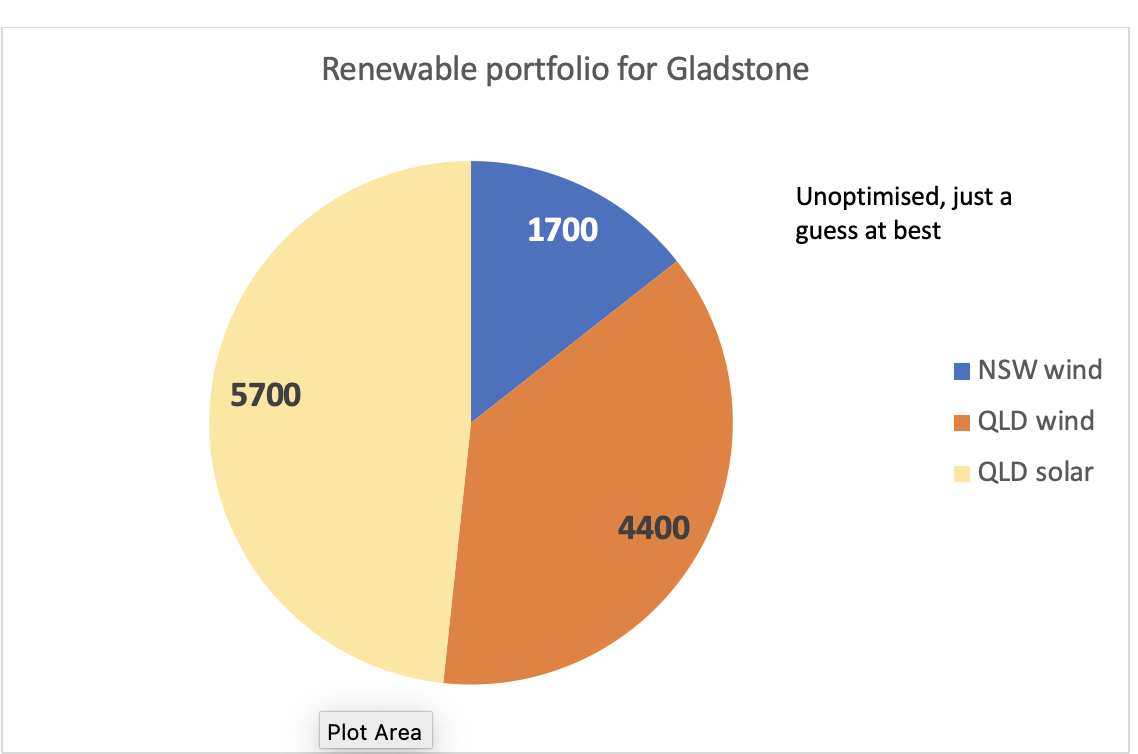
Figure 8 VRE portfolio to run Gladstone
It really works (in the spreadsheet)
The smelter load is 960 MW and the underlying alumina digestor load is 1800 MW. The digestor is run in two modes, peak and offpeak. Peak is when its sunny. During this mode the digestor uses excess daytime solar to charge its storage. This storage is assumed to be “cheap” storage of process heat. In this case the stored heat is just used to partly run the digestor at night. This is more than twice as efficient as using the stored heat to run a turbine that makes electricity. In this system the energy losses are very low. In the turbine case more than half the heat is wasted.
The digestor was modelled to run using an input power of 900 MW in non solar hours supplemented by storage. Again this is a guess. The process heat storage was enough to provide the missing 900 MW during non solar hours. In this model about 15 GWh of process heat storage is required (providing about 900 MW for roughly 16 hours a day) . To charge the storage and also run the refinery and smelter during the day required 4.5 GW of input power. However only 1800 MW of input power is required over night.
The most important point is that the smelter itself only needs 960 MW. Since the system has been sized to provide at least 1800 MW on average over night, it takes a severe wind drought for the smelter to need outside power.
The following chart shows how it works on average day over 508,000 modelled half hours using adjusted AEMO provided wind and solar REZ traces for the period 2024-2050.

Figure 9 Alumium smelter and alumin digestor run on wind and solar, average day. Source: ITK
This graph is of course just an average. If wind and solar output falls away then initially the burden falls on the refinery and some refinery output is lost. But the refinery can easily cope. Our main concern is keeping the power up to the smelter.
It turns out that for this model there are about 4200 half hours out of 508,000 modelled, that is less than 1% of the time, where there is not enough wind and solar to run the smelter. The following figure shows the distribution of those half hours by the shortfall.
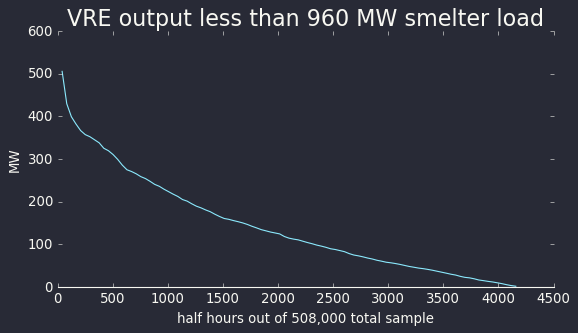
Figure 10 Need for aluminum smelter firming. Source: ITK
You can see that for 500 hours (0.1%) of the time 300-500 MW of external firming is required. A gas generator or a battery could do that easily. It’s a trivial problem.
Problems - what problems?
If it was this easy it would have been done already.
Its not that easy to get 12 GW of wind and solar capacity
Looking at the physical problems the first question is how easy is it in reality to get 12 GW of wind and solar destined for Gladstone? Right now we can’t get any new wind in NSW and even in “can do” QLD things are not really running all that hot just yet.
Process heat storage – what it is and how expensive
Solar thermal electricity has had a bad wrap recently. Its expensive and some plants have had operational issues. The biggest negative on such systems is the energy inefficiency. That’s because the stored heat has to be convereted to electricity by running it through a conventional turbine, often at quite low heat. However in this case the heat is reused as heat.
In Europe at low temperatures water can store lots of heat and can be used in “district” heating. At higher temperatures molten salt is typically used but there are some corrosion issues.
It comes down to material costs, material life, the volume of material required to store the heat, and how long the heat can be stored. For alumina digestors it’s a relatively simple problem. The heat doesn’t have to be stored for very long because it’s a daily cycle, and nor is there any transport of it required.
For most of the thermal storage technologies the cost of the storage medium is extremely cheap, but the balance of costs need to be managed. For example, storing heat in very high temperature water can store a lot of energy in a very cheap medium, but the pressure tank required would be enormously expensive. The view is that for something like Alumina refineries, refactory bricks and molten salts are the leading technologies. Some general comments are:
Molten salt – Proven. Pressure issues if you let it freeze (don’t do that). Corrosion issues and hard to pump. Nitrate salts are only in Chile and there are price shocks in concert with fertilizer.
Refractory brick – Proven. Still very cheap, but not as cheap as rocks or water. The “tank” is very cheap, just an insulated box. Scales really well – uses the three most abundant elements on Earth. No pressure/creep/degradation. No oxidation.
No special fluids or equipment. Charges fast during offpeak, but not as good on discharge, good enough to deliver baseload heat plus a bit of flex.
Sand/rocks – Very cheap/abundant medium. Thermal expansion creates pressure on the tank, eventually the medium crushes into dust. Needs stronger blower to get heat in/out which increases auxiliary losses.
Molten metal – good heat capacity [not actually valuable in stationary applications]. Oxidises in hot air – needs special barrier or fluid. Unproven material science for a long-lived asset.
Graphite – very conductive so easy to get heat in/out. Not cheap, but not prohibitive. Supply competition with lithium batteries. Catches fire in hot air – needs special fluid blanket.
Concrete – usually bad with heat, no particular advantages
If I pulled a number out of thin air of A$100/KWh capital cost, then 15 GWh costs $1500 million, just as an example.
The real point is if you want to run the smelter on renewable energy it needs 24 x 7 firmed power. Considering the smelter alone, the MW involved, that’s likely to be expensive. Using the flexible refineries produces a lot of value.
Spot energy
Despite the flexibility of the system there will be many occasions where generation is way too high for the alumina/aluminum system to handle. That’s because I’ve sized the system to ensure that on average there is enough power available.
The overall portfolio outputs are summarised below. On average there is 0.8 GW of spot energy available with a max of 6.3 GW. That is not a bad thing . It can be used for many other purposes including contributing significantly to QLD electricity supply or running say hydrogen fuelled calcining.
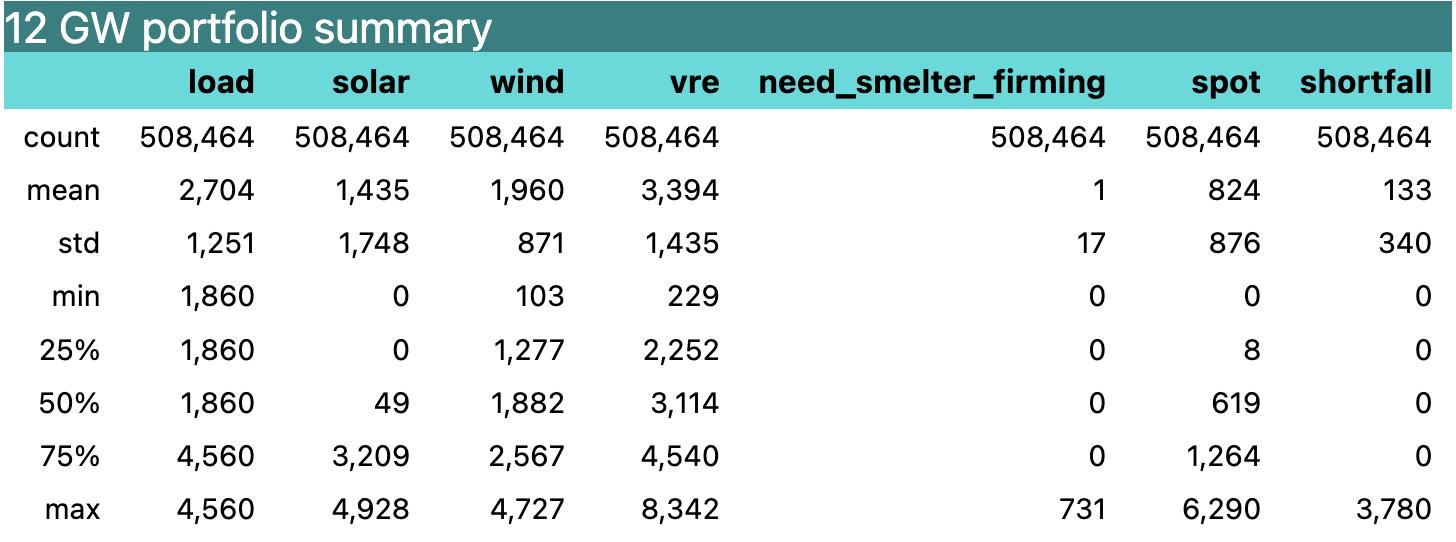
Figure 11 VRE portfolio summary. Source: ITK
Shortfall in the figure above is when VRE output is not enough to run the smelter and refinery at full capacity.It is assumed to result in lost alumina production at a rate of 1 tonne per 2 MWh
If we look at the daily distribution of the spot excess using the median rather than the average, so avoiding extremes there is still typically up to 2.5 GW surplus as the sun rises and as it sets because that is when the solar output is most volatile. At other times there is about 500-600 MW surplus to run overnight demand elsewhere. Notionally that surplus is relatively high value.
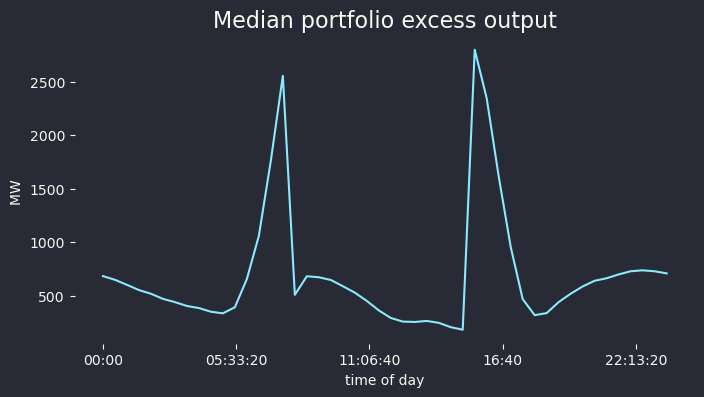
Figure 12 Portfolio surplus output.
Lost alumina production is about 10% of output.
Wind and solar input will rarely exactly equal demand. In most half hours there will be excess or shortfall. As discussed the excess can be sold on the market and in this model the shortfall is valued as lost production, roughly 700kt or 10% of annual output.
Site specific considerations
I have no real idea of how practical this system is. I don’t have any idea what the cost of a competitive alumina refinery is. I don’t really know whether there is enough space for the thermal storage imagined in this model. I have no concept of transmission issues.
The biggest unknown for me in regard to economics is the cost and performance of thermal storage.
Imaginary economics
In this section I make up some price assumptions and fiddle with the numbers until I get the result I want. Uh hang on that’s what I used to do in the research dept. This is the real deal. Just kidding. In fact you can make up any numbers you want for the input prices. These numbers are overnight costs ignoring transmission. The “green” price is assumed to be a constant. Somehow you can purchase wind and solar for $60/MWh and get an REC with a value of $30 thrown in. Then you can turn around and sell the surplus output for $50/MWh but without the certificate.
On the other hand who knows what coal generation will cost in QLD going forward. Its kind of a moot point because its all supposed to go away.
However the biggest point maybe that you only need a normal as opposed to do gooder, super greenie level of optimism to make the numbers seem possible.
I suspect that there are a few lines missing in these sums but no doubt the many eagle eyed readers will be quickly alert me to the many errors.
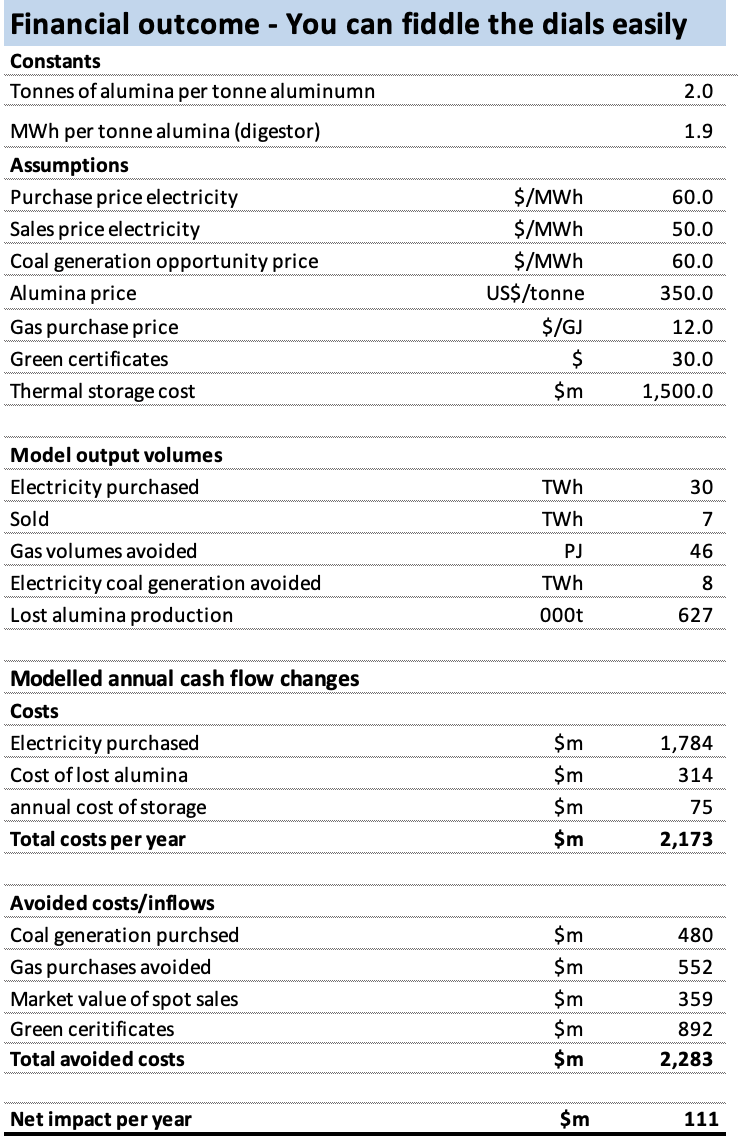
Figure 13 Decarbonising Gladstone aluminum production. Source: ITK dept of imagination
Using QLD and NSW wind together with QLD solar
In ITK’s opinion any large QLD renewable project that doesn’t take advantage of the portfolio benefit of including some NSW wind is nuts.
The following figure shows the correlation of wind output between the various Queensland and NSW REZs. Basically the deeper the brown colour the less correlated the two zones are and therefore the lower variability of a wind portfolio that combines them. Some zones actually are negatively correlated. Negative correlation is wonderful if you can get. It means that when one zone isn’t blowing the other one is likely to be blowing. Careful perusal of the “map” will show that combining Q3 and Q4 wind with N7 and N8 wind would be a good idea. It might be that in reality that can only be done financially.
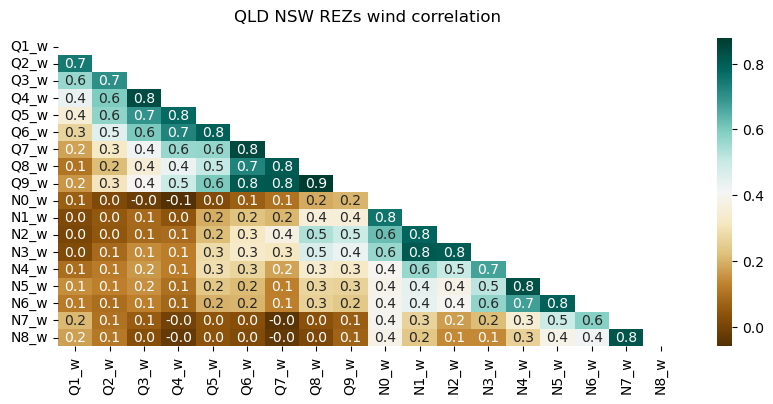
Figure 14 NSW and QLD REZ wind correlations. Source AEMO 2022 ISP, ITK calculations
The map below shows the zone locations. Plausible portfolios that don’t require too much transmission imagination might be N1 through N3 with say Q3- through Q7. Q8 and Q9 are too close to the northern NSW zones including Orana and don’t give the same portfolio benefit.
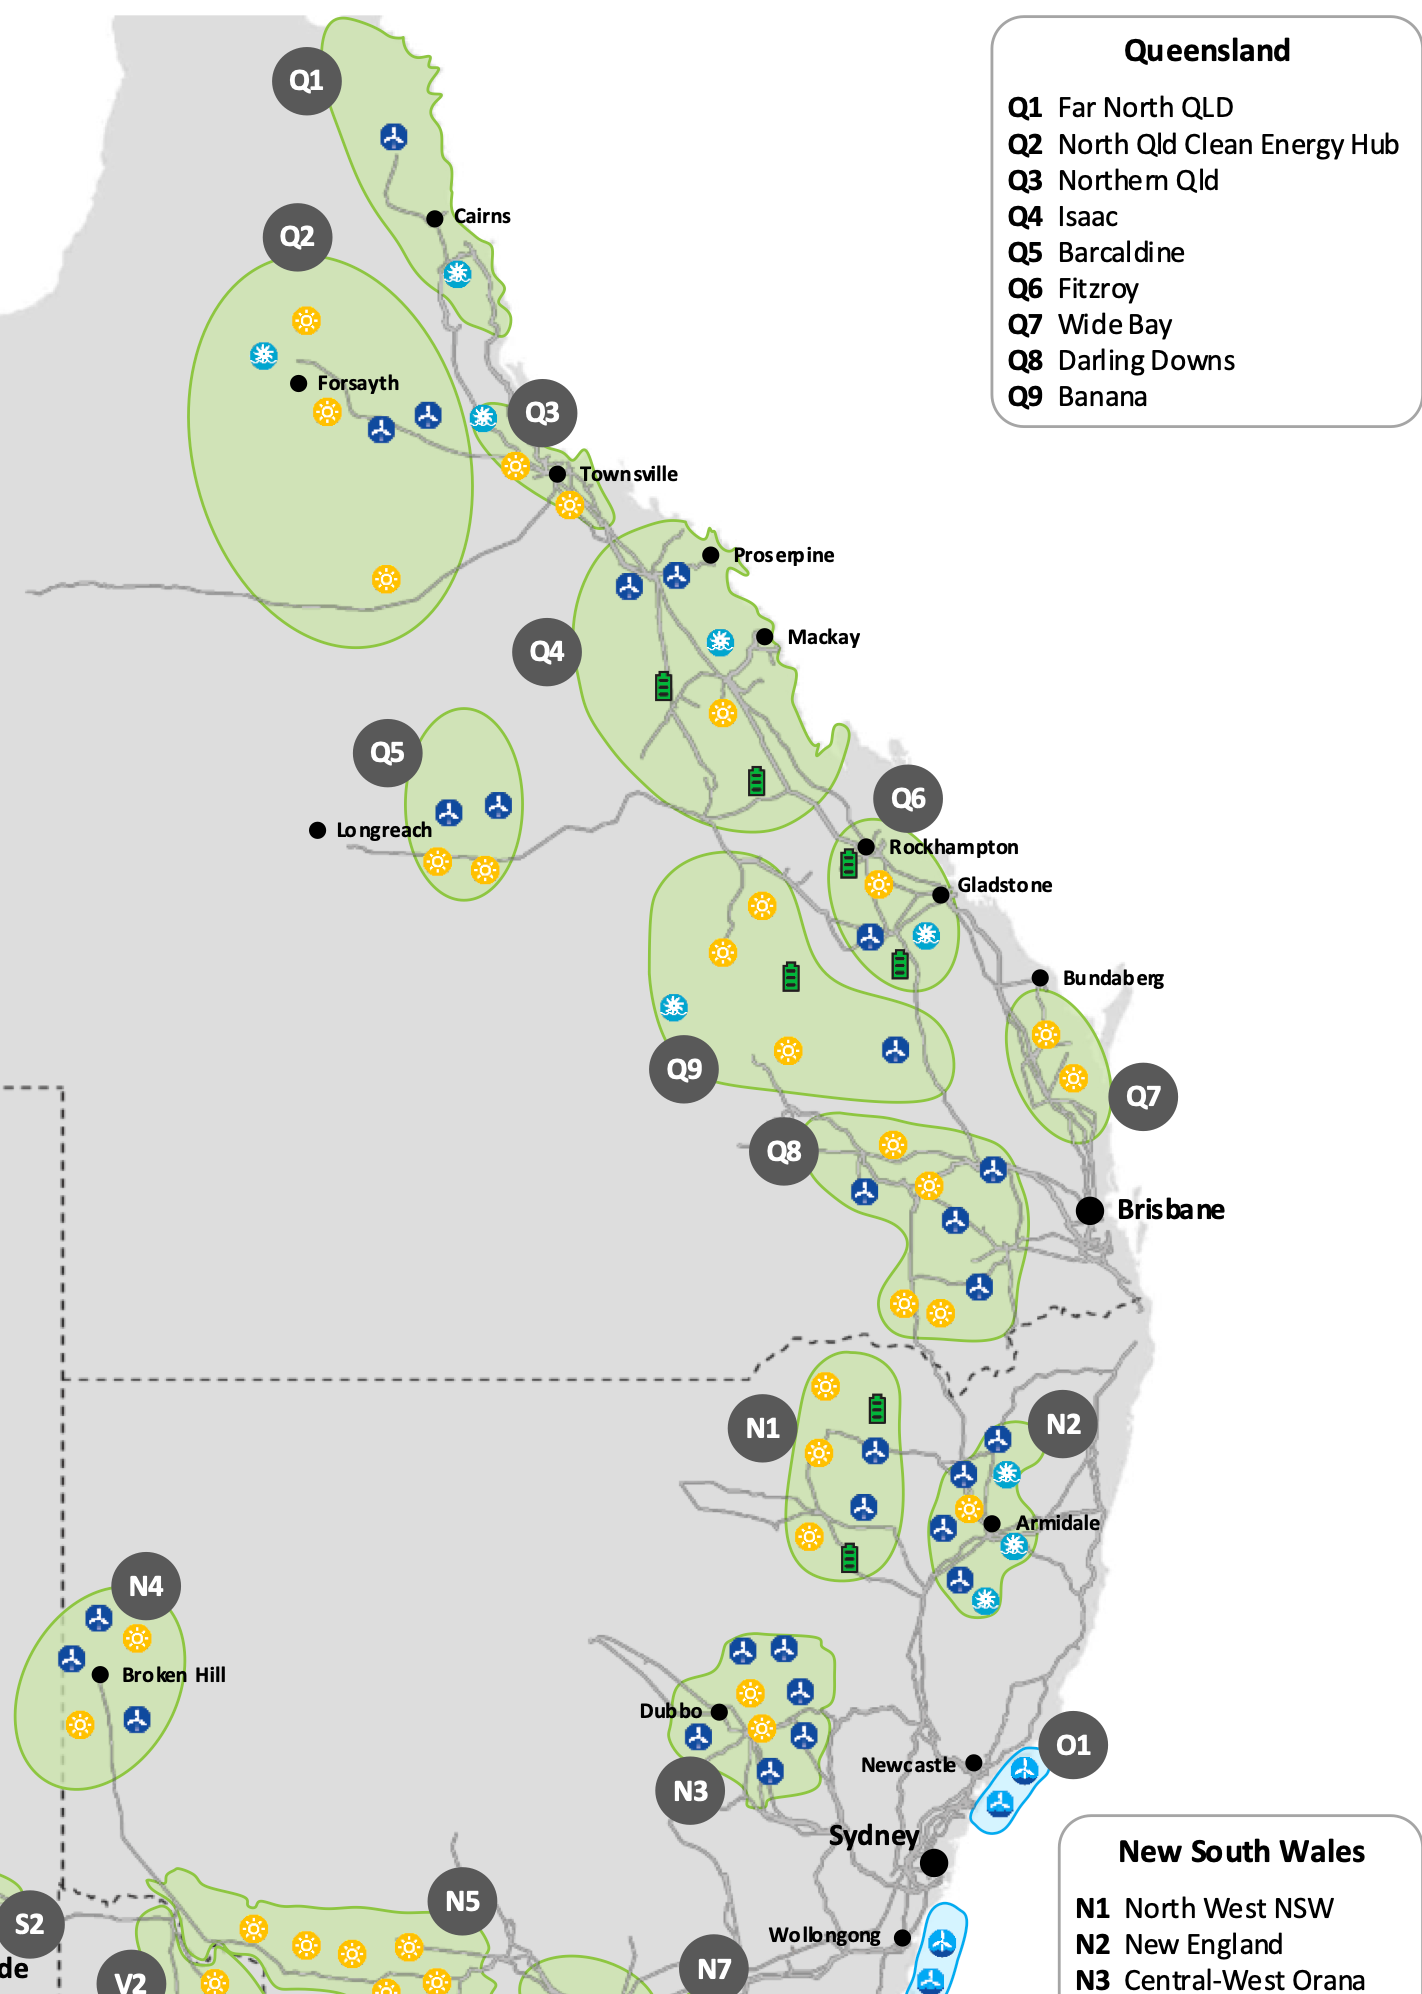
Figure 15 Modelled NSW and QLD REZs. Source: AEMO

Equally large scale solar can be built faster and possibly has a lower cost of energy than wind. Notionally such a large project could also manage the risk with access the spot market given the predictable surplus of midday power coming from behind the meter. That is you might undersize your contracted portfolio. That too is ignored here.
For most renewable systems in Australia, the general finding is that the ideal mix is about 70% wind and 30% solar. Because of the large solar resource in QLD and because we are viewing the refinery(s) as a pseudo battery lets push up the solar ratio to 50% with say 35% of power coming from QLD wind and 15% from NSW wind. I don’t worry about the solar side of things except to note that spreading the solar out within QLD will likely improve results.
These numbers are just guesss.
All real world issues like transmission are completely ignored.