Batteries can undercut gas but its hydro that might lose share first
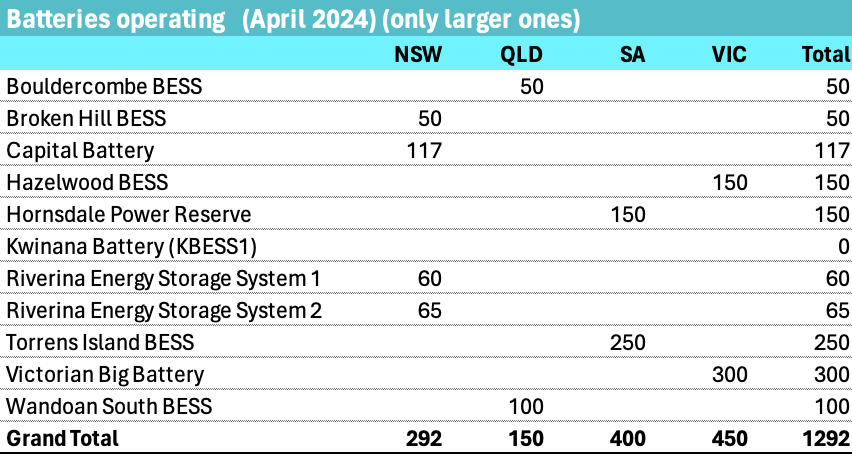
Utility battery power is going to grow from about 1.3 GW in the NEM to closer to 7 GW over the next 3 years. That is clearly going to have an impact on wholesale prices. 7 GW represents about 25% of the 26 gW of average peak evening demand between (QLD time) 6pm to 8pm.
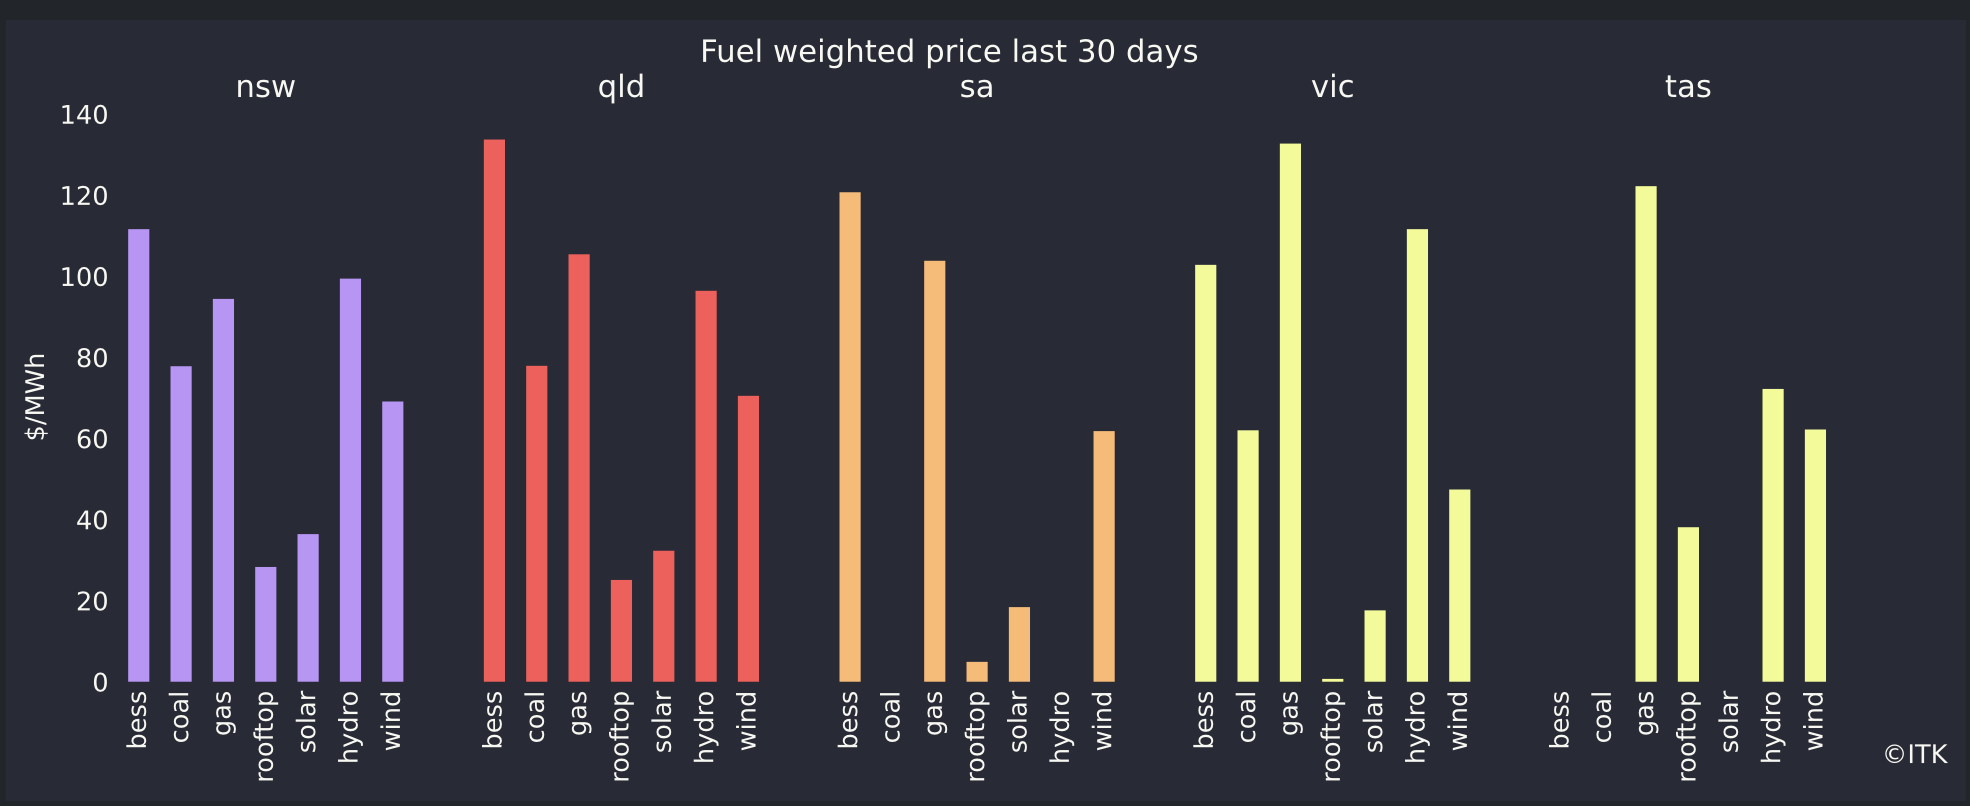
Peak prices are set by hydro and gas, more often hydro in fact but when gas does set the price it may be higher than the hydro price see Figure 7. Once the batteries are built they will have capacity roughly equal to what gas and hydro together dispatch on average at dinnertime see Figure 5. Of course there is generally lots of spare gas and hydro capacity beyond what is dispatched.
The fundamental view is that batteries, gas and hydro will compete for market share. Unlike hydro which is a tight oligopoly and even gas where much of the capacity is held by Origin and Snowyhydro, AGL and EA, batteries will initially be owned and operated by a wide variety of players. Like every other market the big guys will try to consolidate market share, but barriers to entry are low, provided you can navigate the connection rules. Gas requires that capacity be reserved on the transmission line for every half hour of the year, just in case. That’s why the gas is owned by the gas retailers, they rent the pipes anyway. And Snowy and Southern Hydro typically have strictly limited storage and so they ration supply. Batteries have few restrictions, only the limited number of cyles over their lifetime. But batteries are also incentivised to get a return before a cheaper capital cost battery turns up. So they will want their revenue from day 1.
What will another 20% of peak supply do peak prices? And by the way in QLD there is heaps more wind and return of coal as well the new batteries. I expect more total supply will also lower price. Wind supply tends to impact every half hour of the day. Against which must be set the closure of Eraring in the near terms
I’d argue that prices at 18:00 could fall even $100/MWh over the next couple of years as the batteries come on line. Overall I think that average fuly year flat load prices could fall by $10-$15/MWh as a result of the new battery supply. The fall in peak prices might be partly offset by a rise in midday prices. Whether it is will largely depend on when Eraring is closed as previously discussed.
Utility batteries probably require revenue per MWh, assuming 365 cycles per year of about $250/MWh maybe a bit more in order to justify investment.
But once built batteries have a low SRMC, close in fact to zero, or at worst in NSW $40/MWh. But so far, the tighter the overall supply demand balance -> the higher the average price -> the more likely batteries will charge more than gas. Or is that because NSW and QLD have less batteries relative to total demand?
Traditionally with the exception of hydro the SRMC has been driven by the fuel cost. Brown coal fuel cost is lower than black coal and so is dispatched first. Gas has a much higher fuel cost but a lower capital cost and so gas plant sits in reserve and only operates for a couple of hours a day. Hydro has pretty much zero SRMC but outside Tasmania there is a limited quantity which is generally held back for the highest price periods.
Then along comes variable renewable energy (VRE), except that really the solar is not all that variable. The impact of solar is obvious, it kills price in the middle of the day. The more so because coal has to keep running.
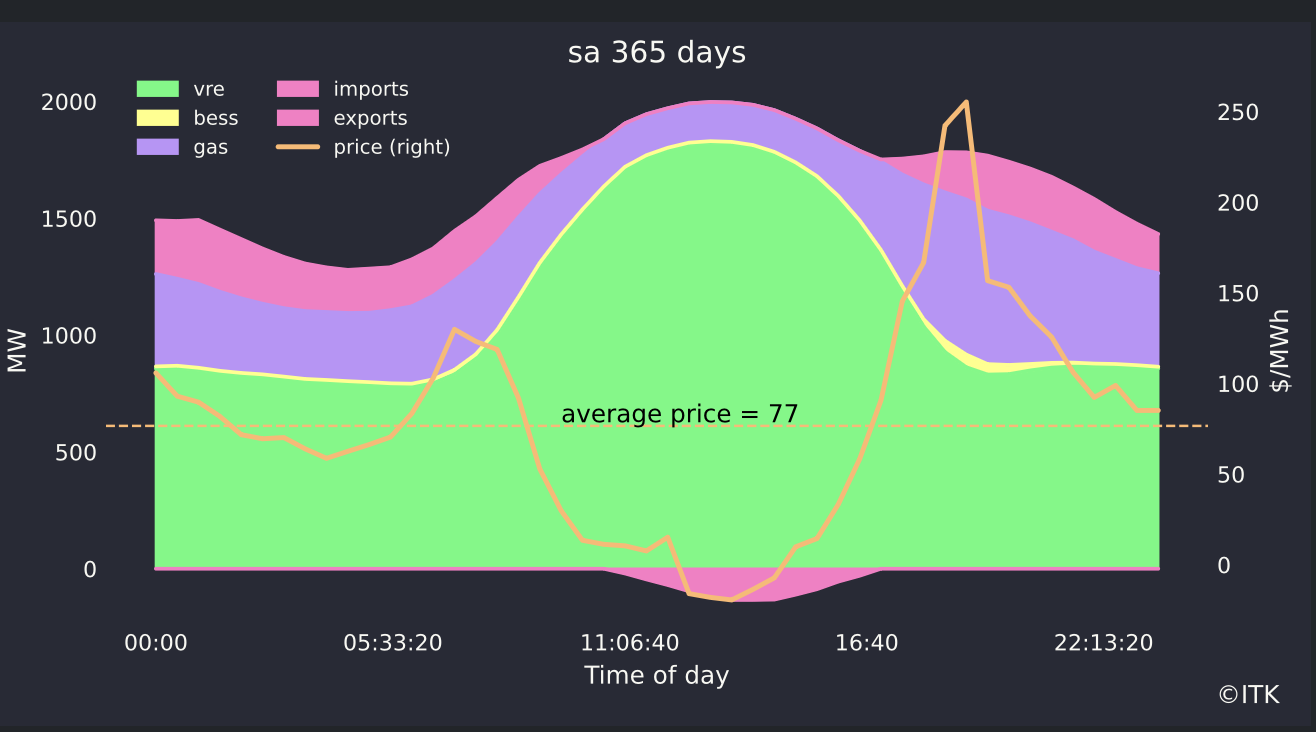
The impact of wind is best seen in South Australia:
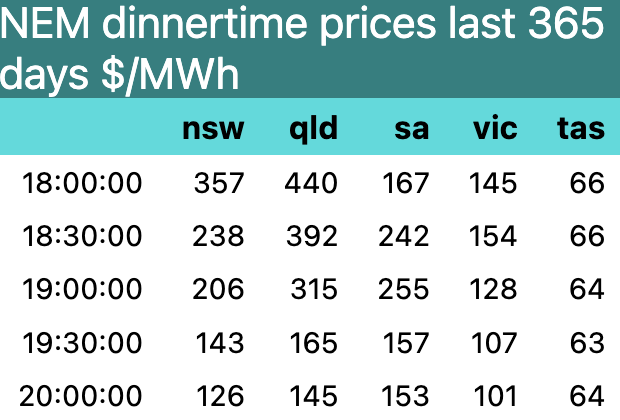
Looking at the average day, price spikes around 6:30 - 7:30 pm
So how much impact does the wind share have on that peak price?
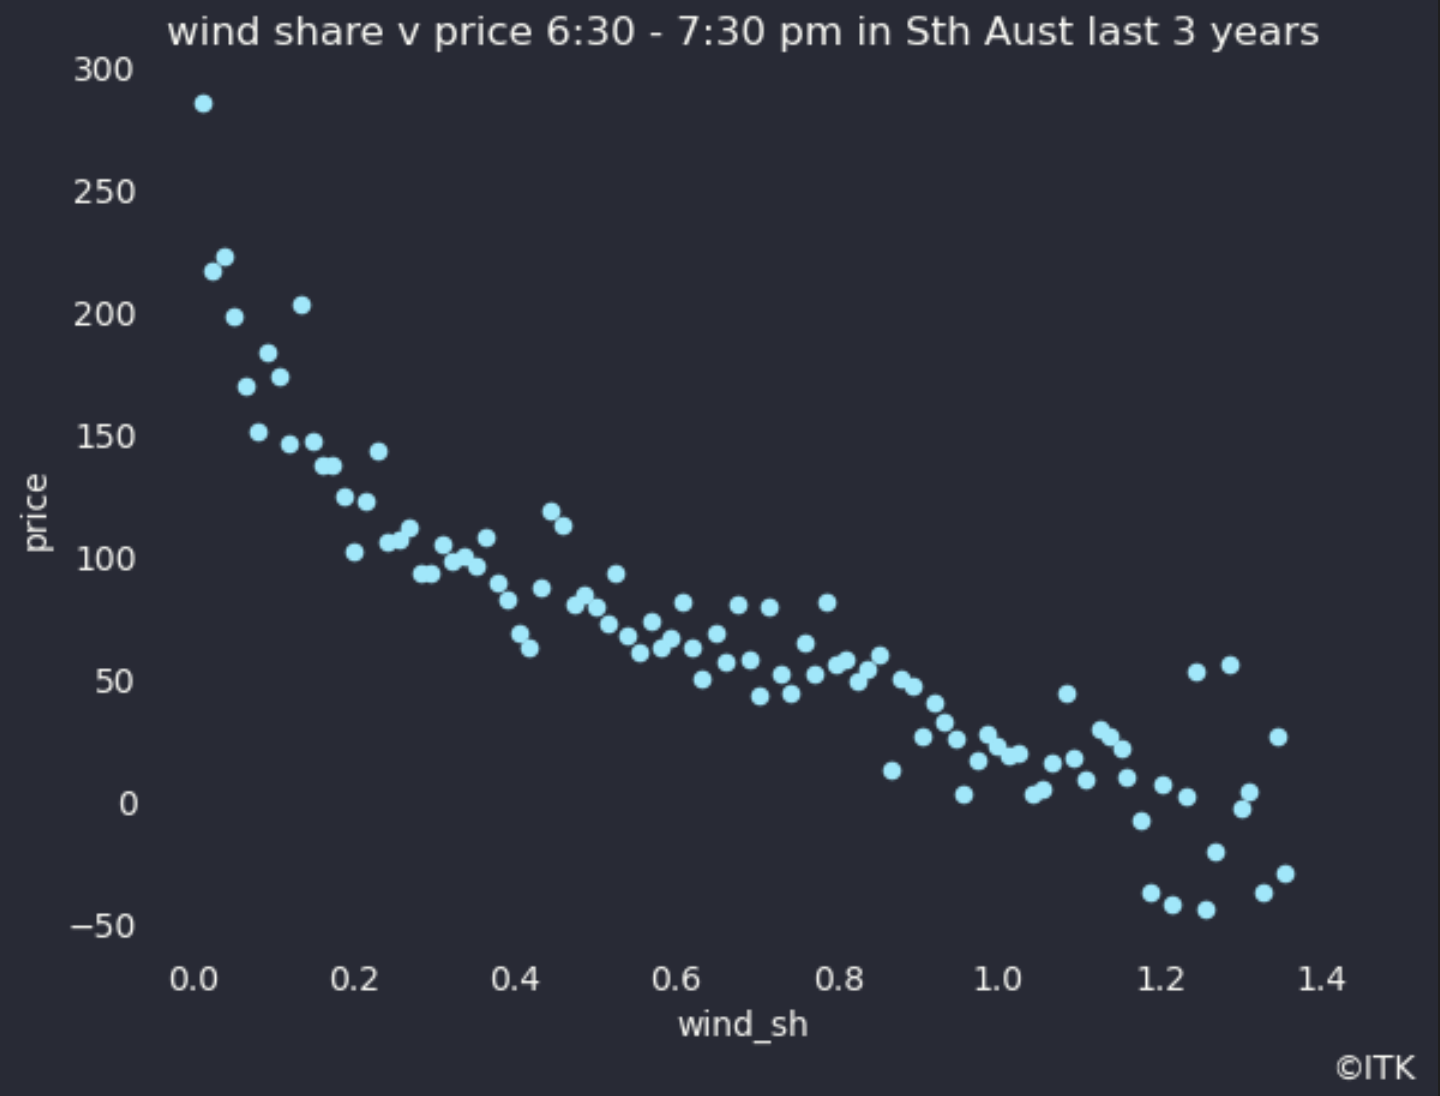
Figure 4 was derived by taking taking the wind share in the 6:30 - 8:00 PM window for every day in the past 3 years then making 100 bins of the wind share sorted from highest to lowest and looking at the median price for each bin. It provides a clearer picture, to my way of thinking than a standard correlation graph. Just as you might expect the less the wind blows at dinner time the higher the price tends to be. Other factors can also set the price of course so that even when the wind share is 100% price need not be zero or negative.
More wind means lower prices but batteries will have a bigger impact
Unfortunately other than in South Australia wind share of demand is relatively low, only about 13% across the NEM over the past year, with a low of 4% in QLD and a high of 47% in South Australia. QLD is changing that but NSW with a share of 9% is very slow.
So we cant rely on more wind lowering prices materially in the next few years. Therefore we turn to batteries.
Across the NEM supply between 6:00 PM and 8:00 PM is
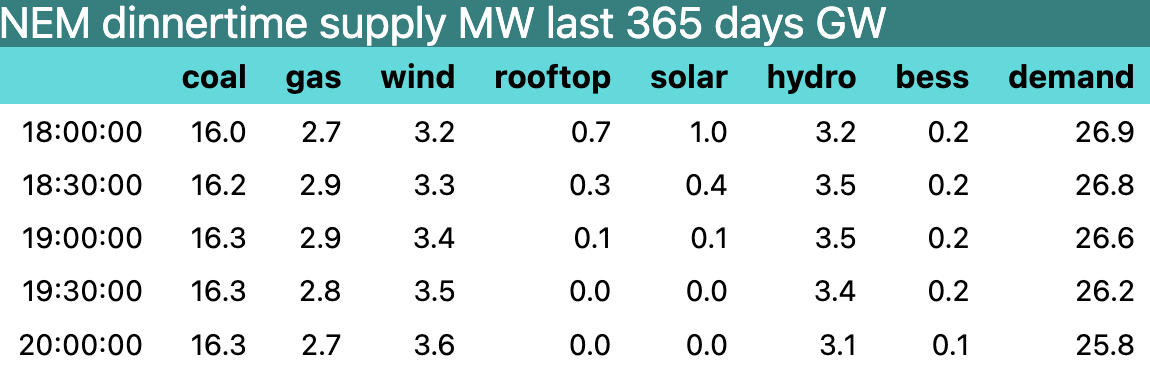
Note that demand is also dropping as the last of the solar drops off. Ove those half hours demand falls by 1 GW.
Into this mix we are adding at least 5 and actually it will be closer to 6 GW of batteries, all of which will be incentivised by peak prices
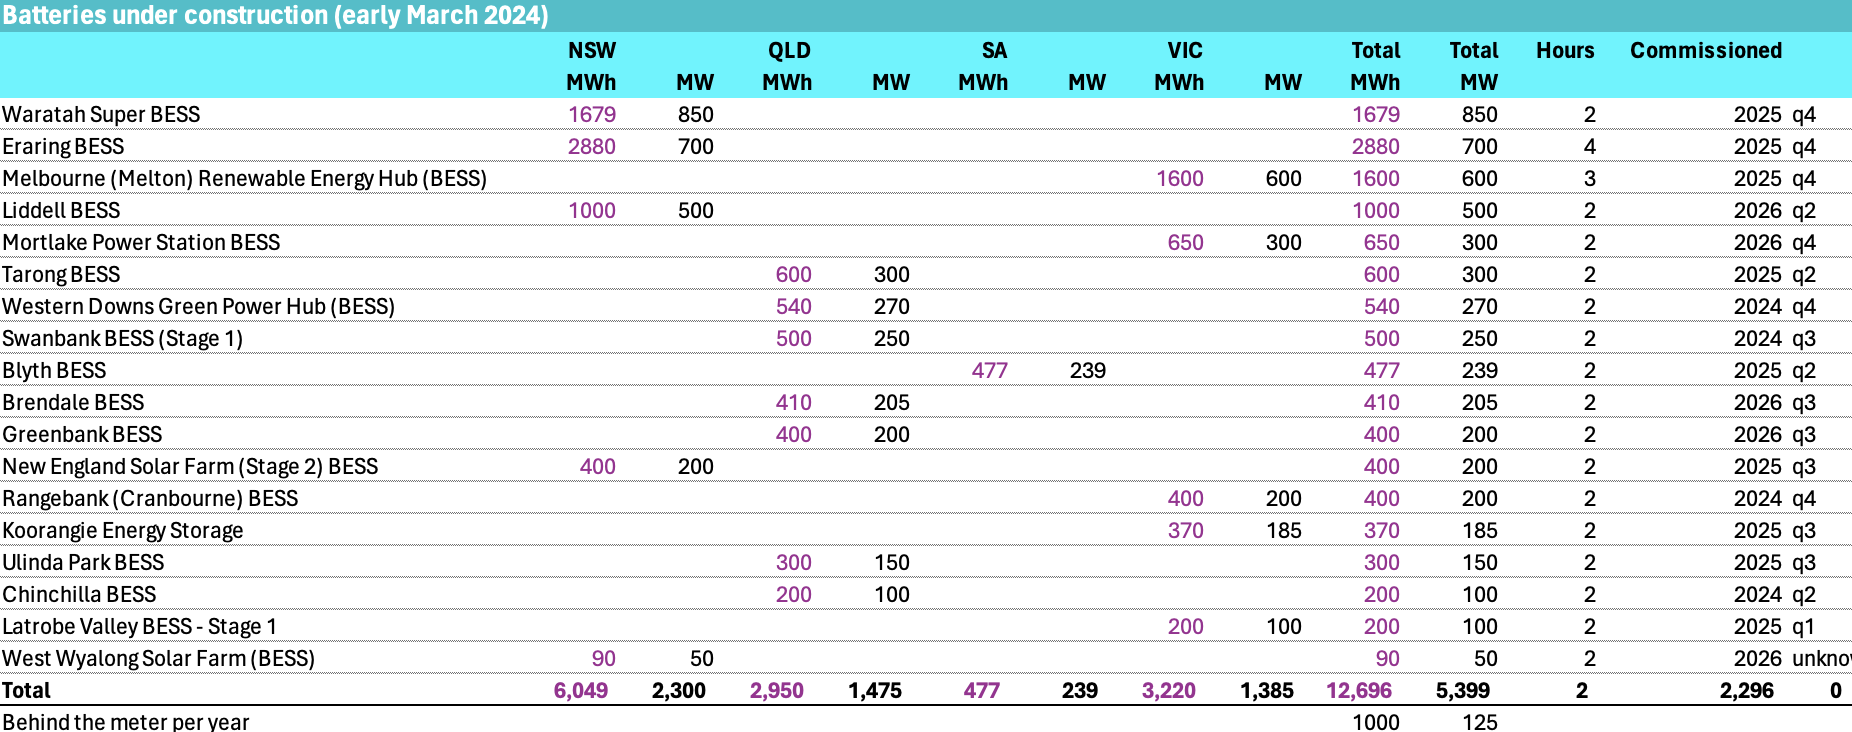
Significant battery capacity is reserved for purposes other than trading. Even that reserved capacity may have an impact on price but I don’t consider that further here. Say trading capacity of 4.5 GW of what I expect in 3 years time will be not 5.4 but 6 GW of new batteries is available for discharge in peak demand.
Because the batteries will charge from solar in the middle of the day, even in Winter, they will have a lower fuel cost that coal, and gas. In the first instance batteries can compete against hydro and gas In NSW and Victoria it may well be Snowy Hydro and AGL’s Southern Hydro that feel the pressure.
After all, and particularly in Winter its Snowy Hydro and Southern Hydro that cherry pick prices.
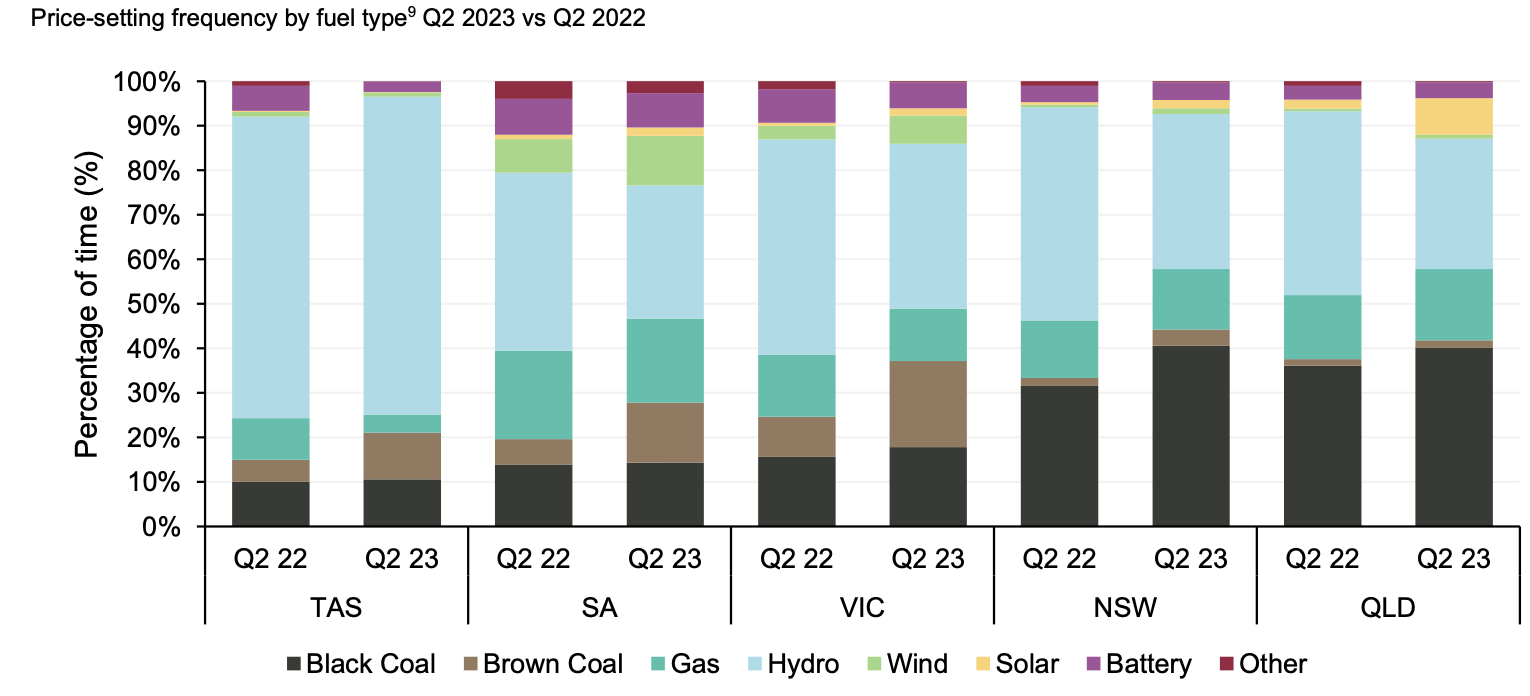
In Figure 7 its already clear that batteries have a role to play in setting price, most visibly in QLD, but hydro dominates. Hydro and gas both tend to bid above $150/MWh.
In theory 4.5 GW of batteries could displace 100% of 2.9 GW of gas demand but I somehow doubt they will as some gas will be required to keep running in eg South Australia.
And actually the batteries could even eat into say 1 GW of coal supply on top of not requiring any gas. At least that is what the supply and demand numbers suggest could happen.
As shown in Figure 2 batteries have not so far competed with gas, at least not in States which are short on energy, and that means NSW and QLD. Equally though it could be that batteries are undercutting gas in South Australia and Victoria because that is where there are already more MW of battery installation.
And of course the existing batteries will themselves need to be dispatched.
Operators of batteries have other revenue opportunities in the frequency control market. This may mean they are less incentisied to use up capacity in the trading market. Even so I expect they will.
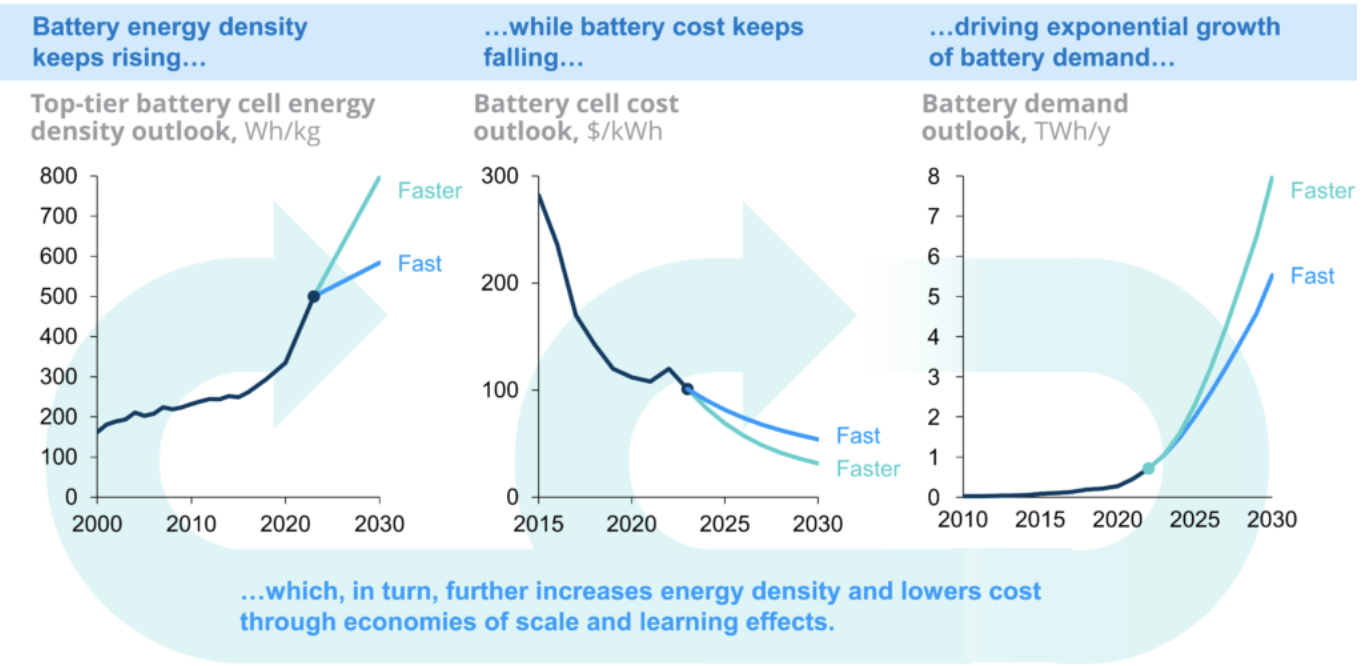
Battery operators need to pay attention to the fact that battery costs are falling all the time. This means that battery owners are incentivised to get a payback on their battery as quickly as possible before they are undercut by some b**tard with a lower cost piece of kit.