Summary
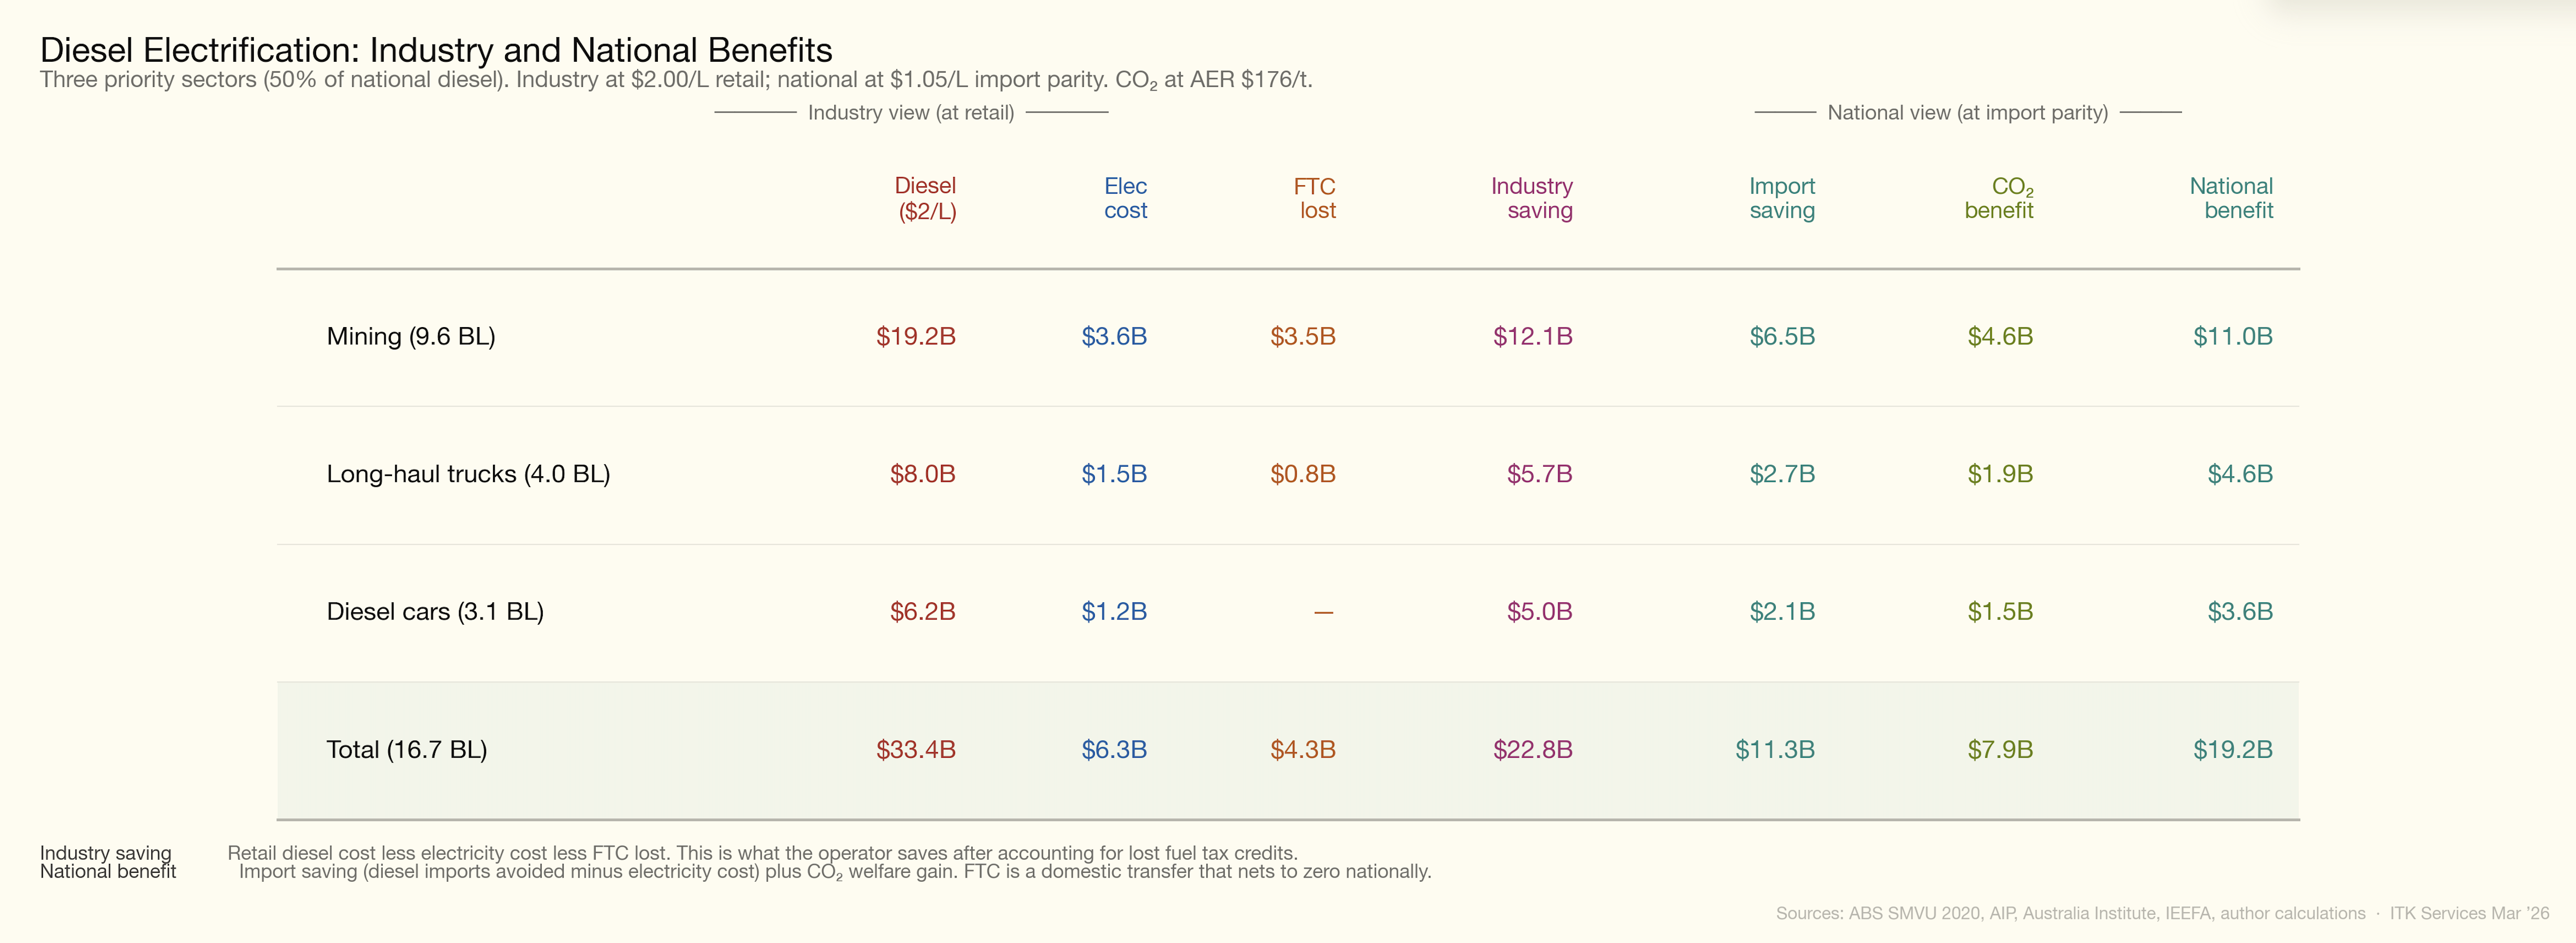
Full electrification of Australia’s diesel fleet would redirect approximately $22 billion per year from petroleum imports to domestically produced electricity — equivalent to roughly 1% of GDP in import substitution. The associated CO2 reduction of 90 Mt (~15% of national emissions) represents a further welfare gain not captured in national accounts. At $176/t CO2, the AER shadow price represents around $15 bn in welfare gains. For scale, the NDIS costs roughly $45 bn per year.
The priority areas should be:
- Long distance trucking, where there are strong economics and lots of diesel consumed and where security risk is highest;
- Mining, where phasing out the diesel rebate (and coal mining gets the largest share) is actually an easy win and mining is a large consumer of diesel;
- and diesel passenger cars, where the capital cost penalty is minimal to user and only modest policy push is required;
I used three basic criteria to arrive at these recommendations:
- The size of the market, that is how much diesel does the segment consume;
- The economics. Specifically, the saving per kilometre of using electricity compared to diesel, the importance of fuel in the total cost stack for the category and the capital cost premium of electric.
- The availability of electric vehicles in the category.
Priority areas
Arguably just reducing or eliminating the diesel fuel rebate, perhaps phasing it out over ten years and just in the mining sector, would give electrification a huge boost. It’s noticeable that coal mining is the biggest user of the diesel rebate within mining.
This analysis supports my earlier note that a focus on Sydney–Melbourne, Sydney–Newcastle, Brisbane–Sydney, or Melbourne–Adelaide is a sensible area. In long-distance transport, fuel cost is a major component of total cost. For intra-city transport, fuel cost is less important than wages and other elements.
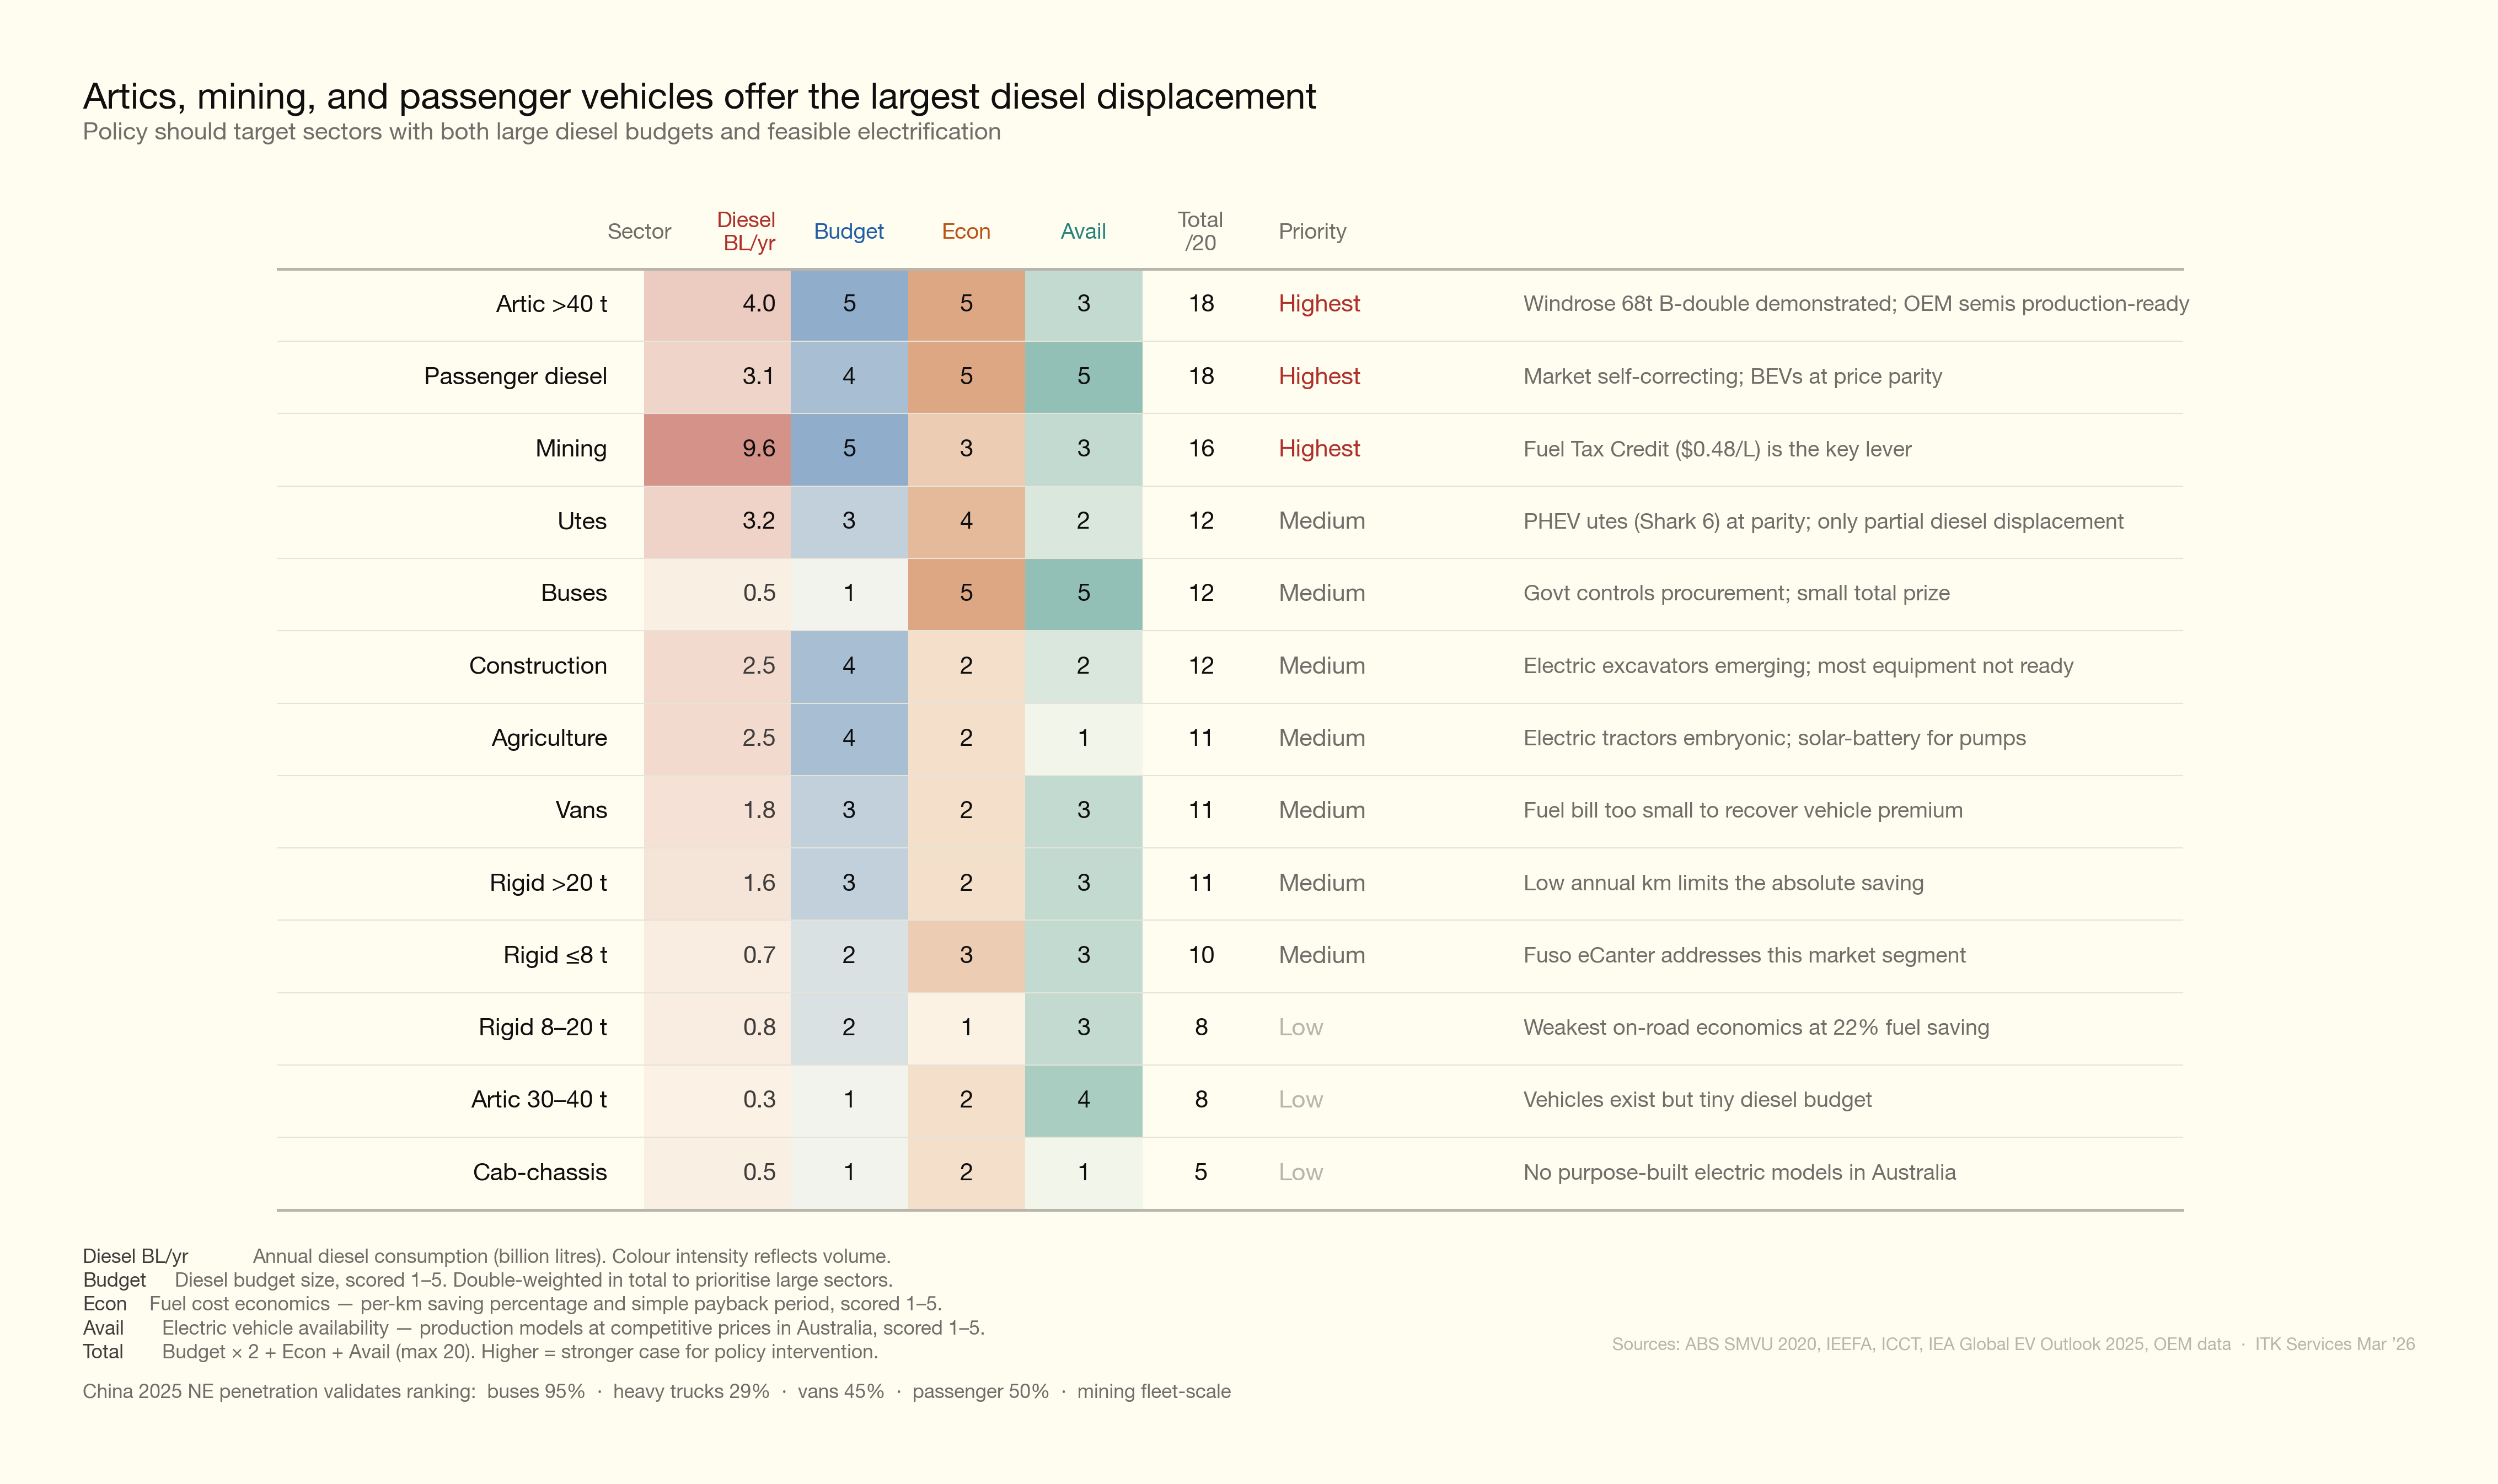
The scorecard ranks segments by diesel volume, electrification economics, and vehicle availability. Heavy articulated trucks, mining, and diesel passenger cars score highest — combining large diesel consumption with either strong economics or minimal capital barriers.
Note: Artic in the scorecard above refers to articulated vehicles.
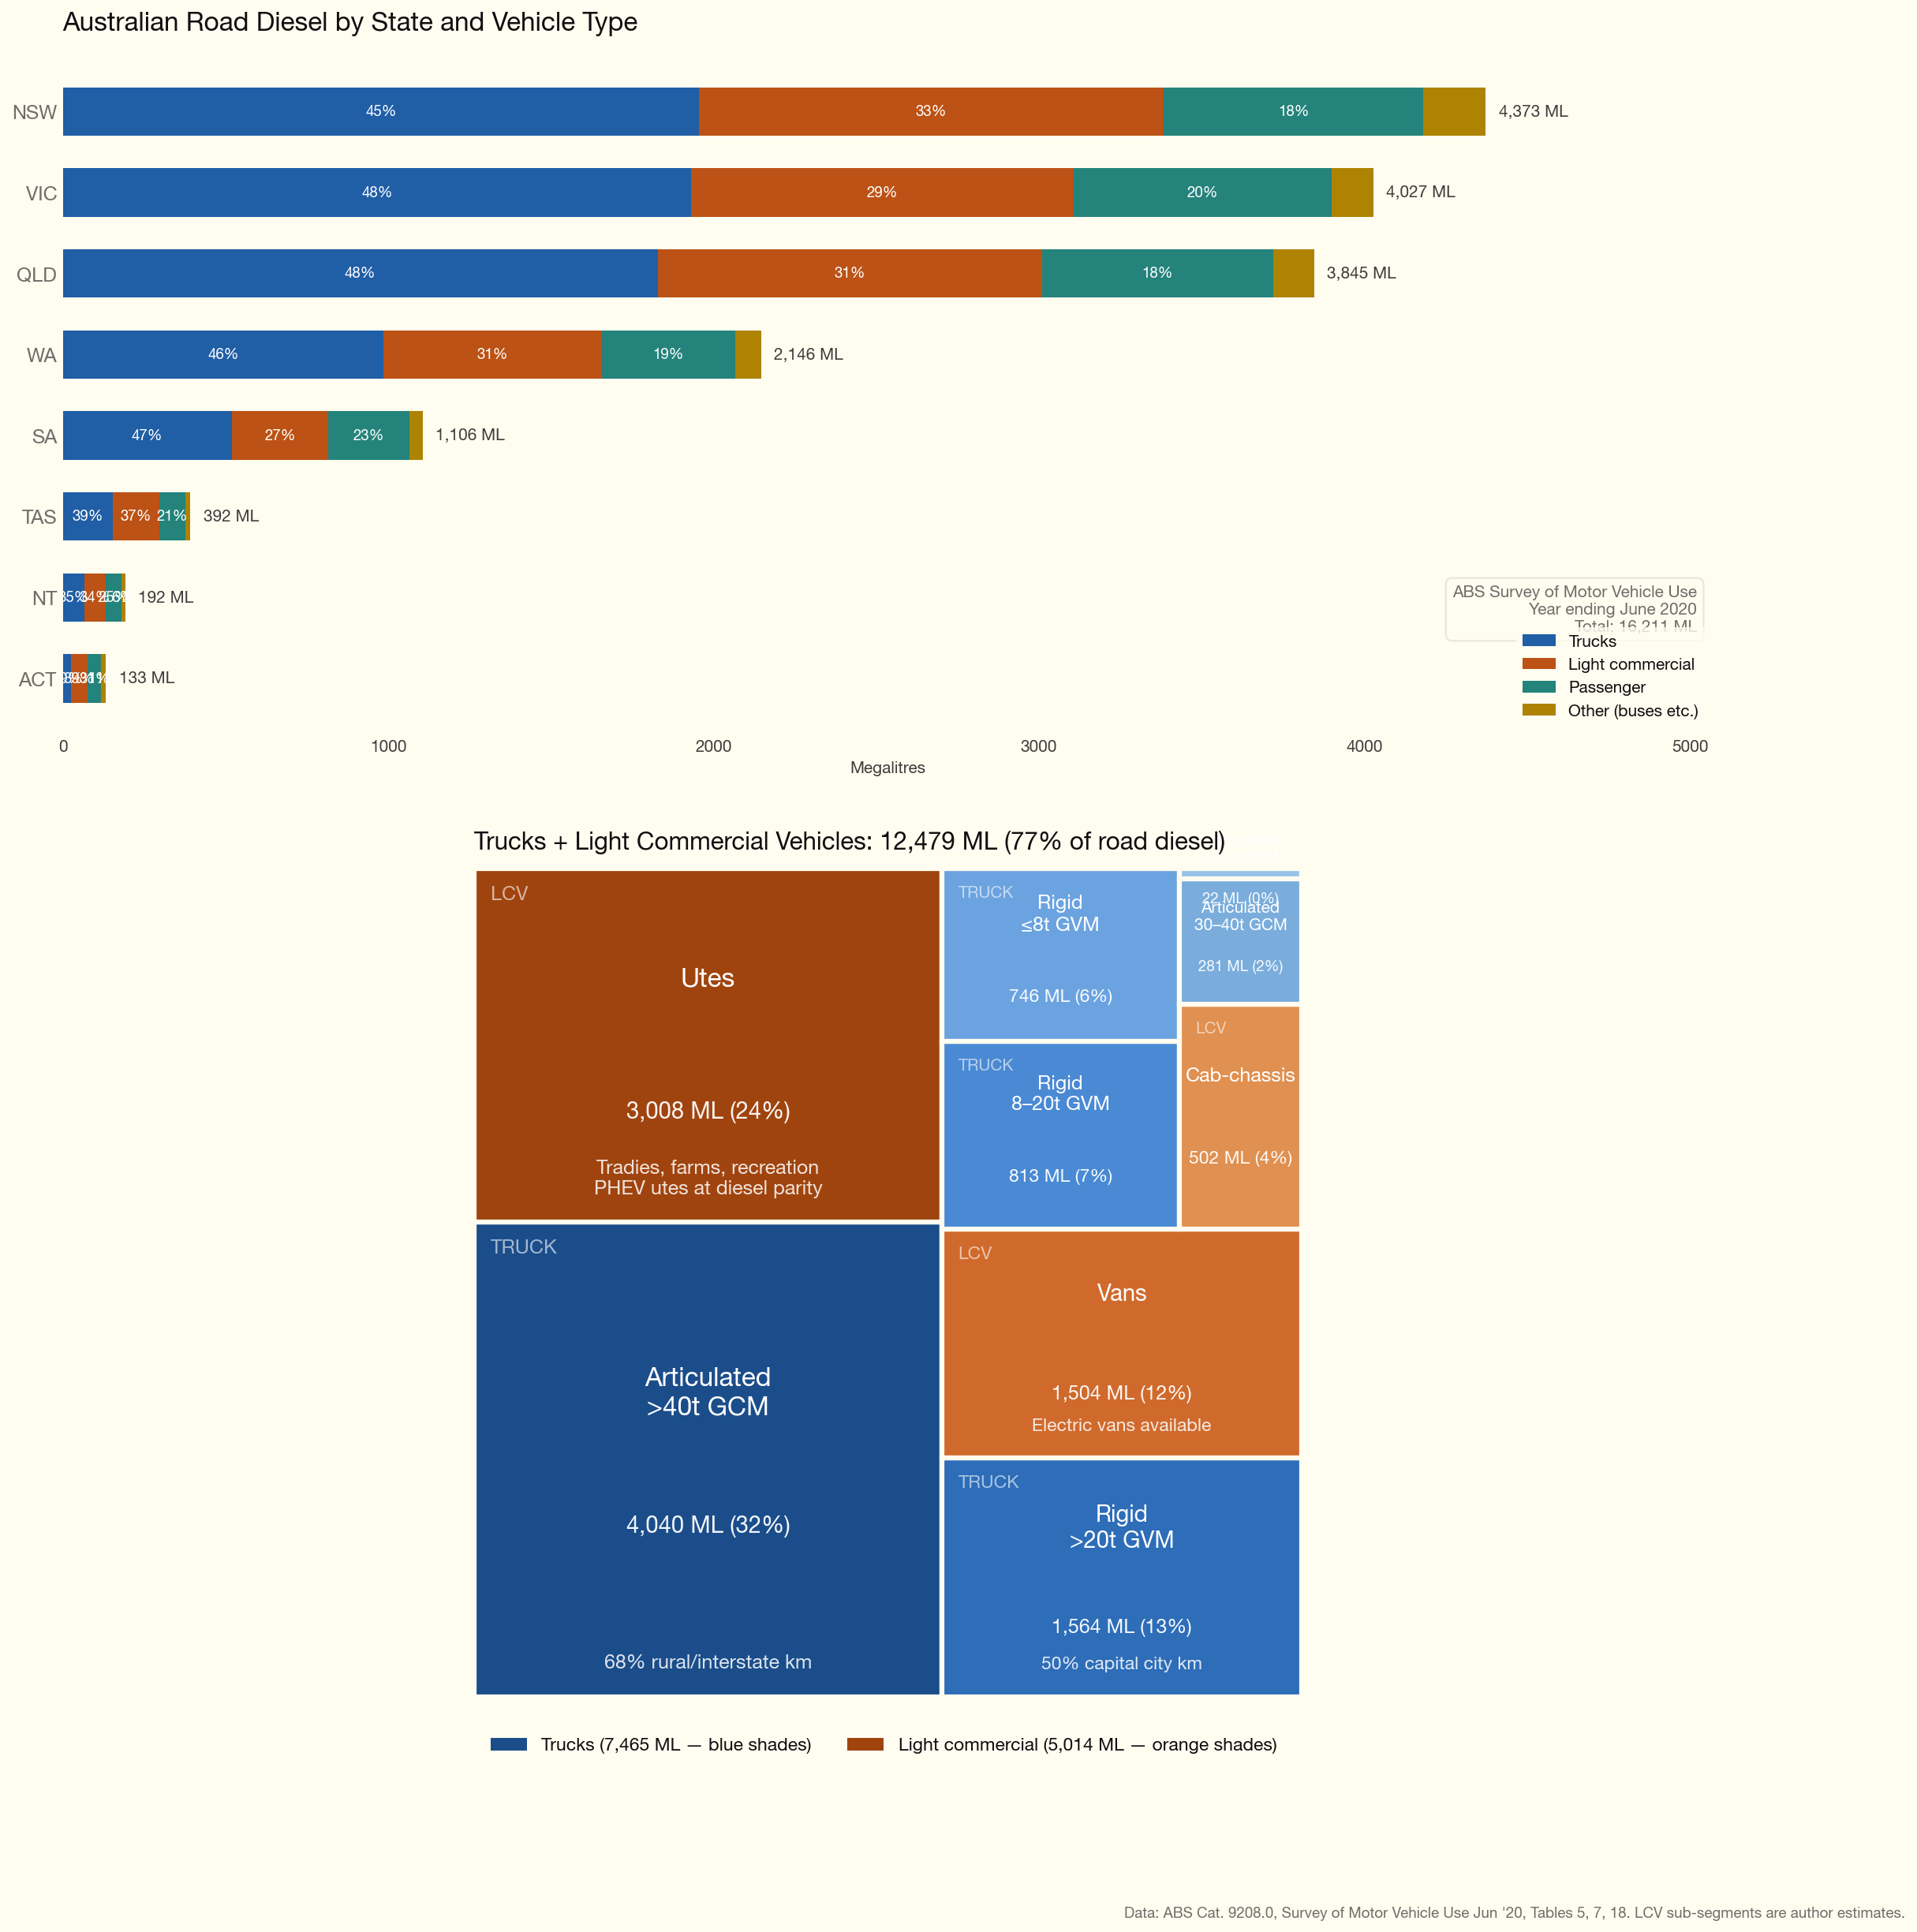
A breakdown of road diesel consumption is:
Diesel segment profiles
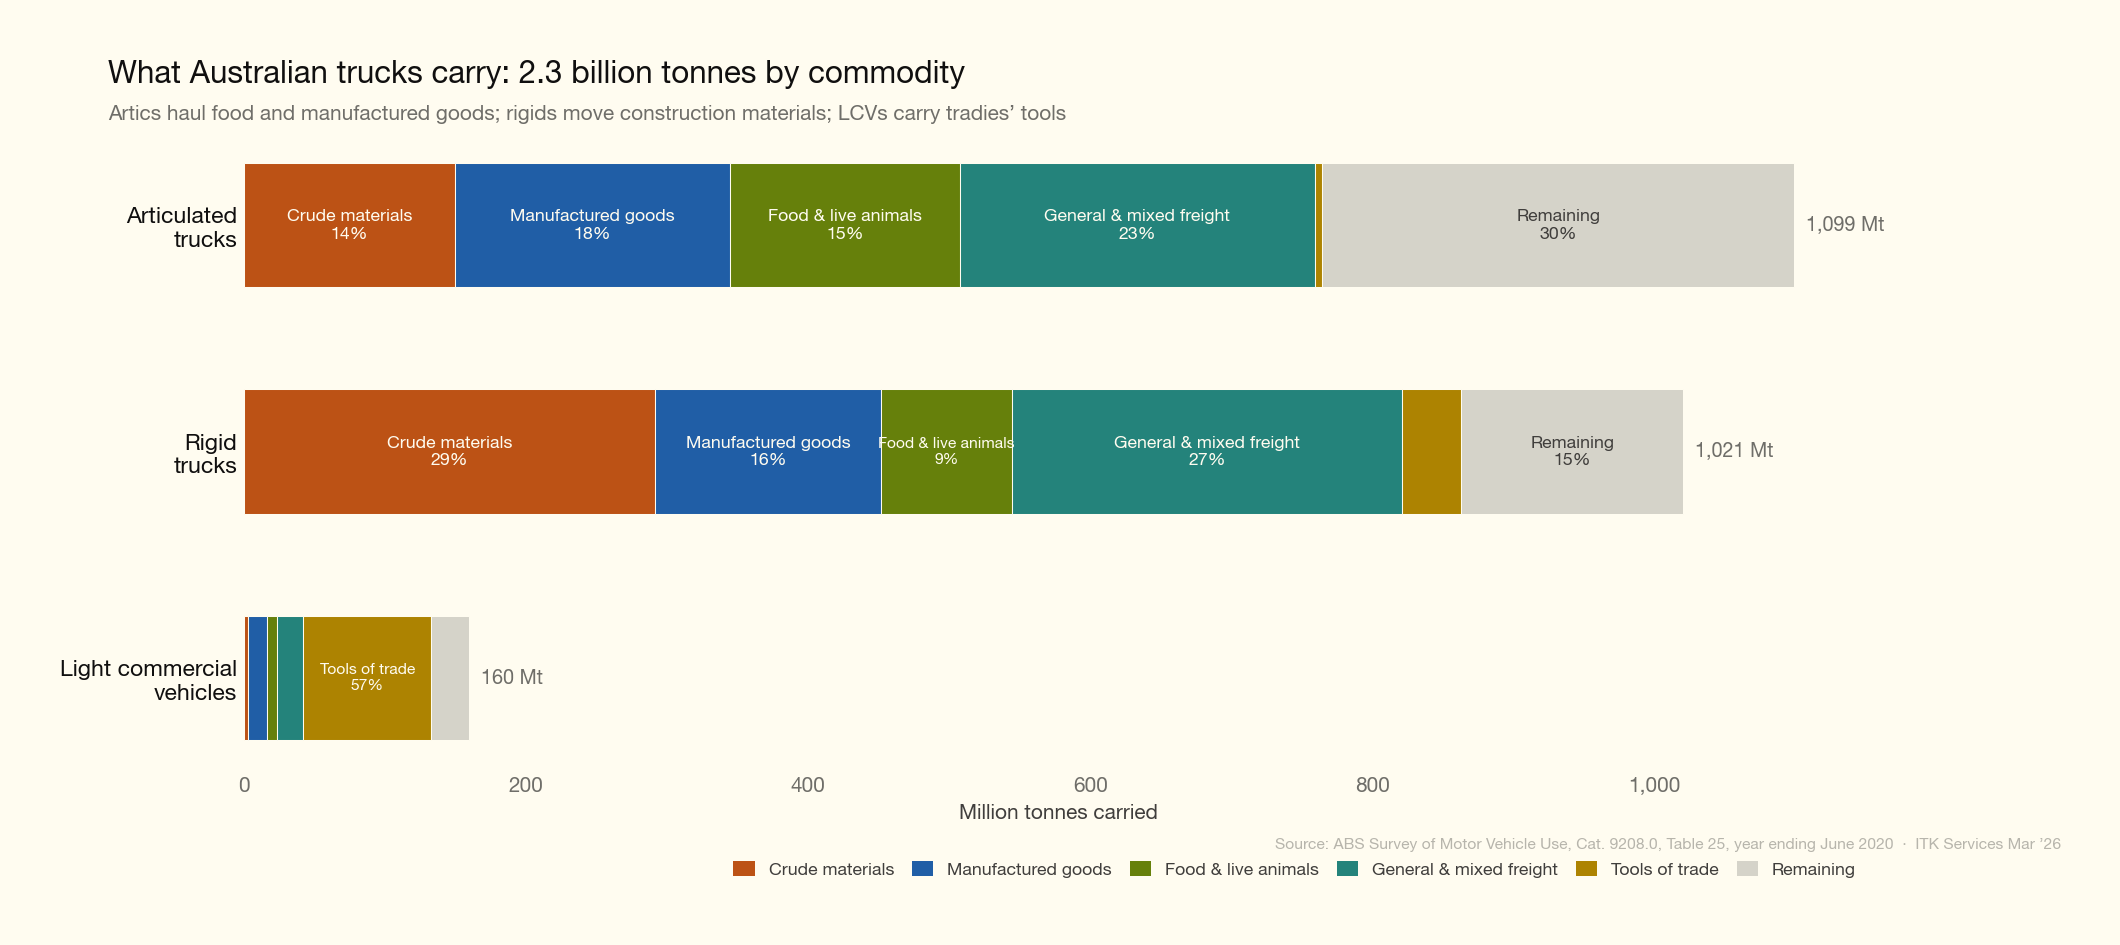
A graphic of the segments is shown below and further detail can be found later in the document.
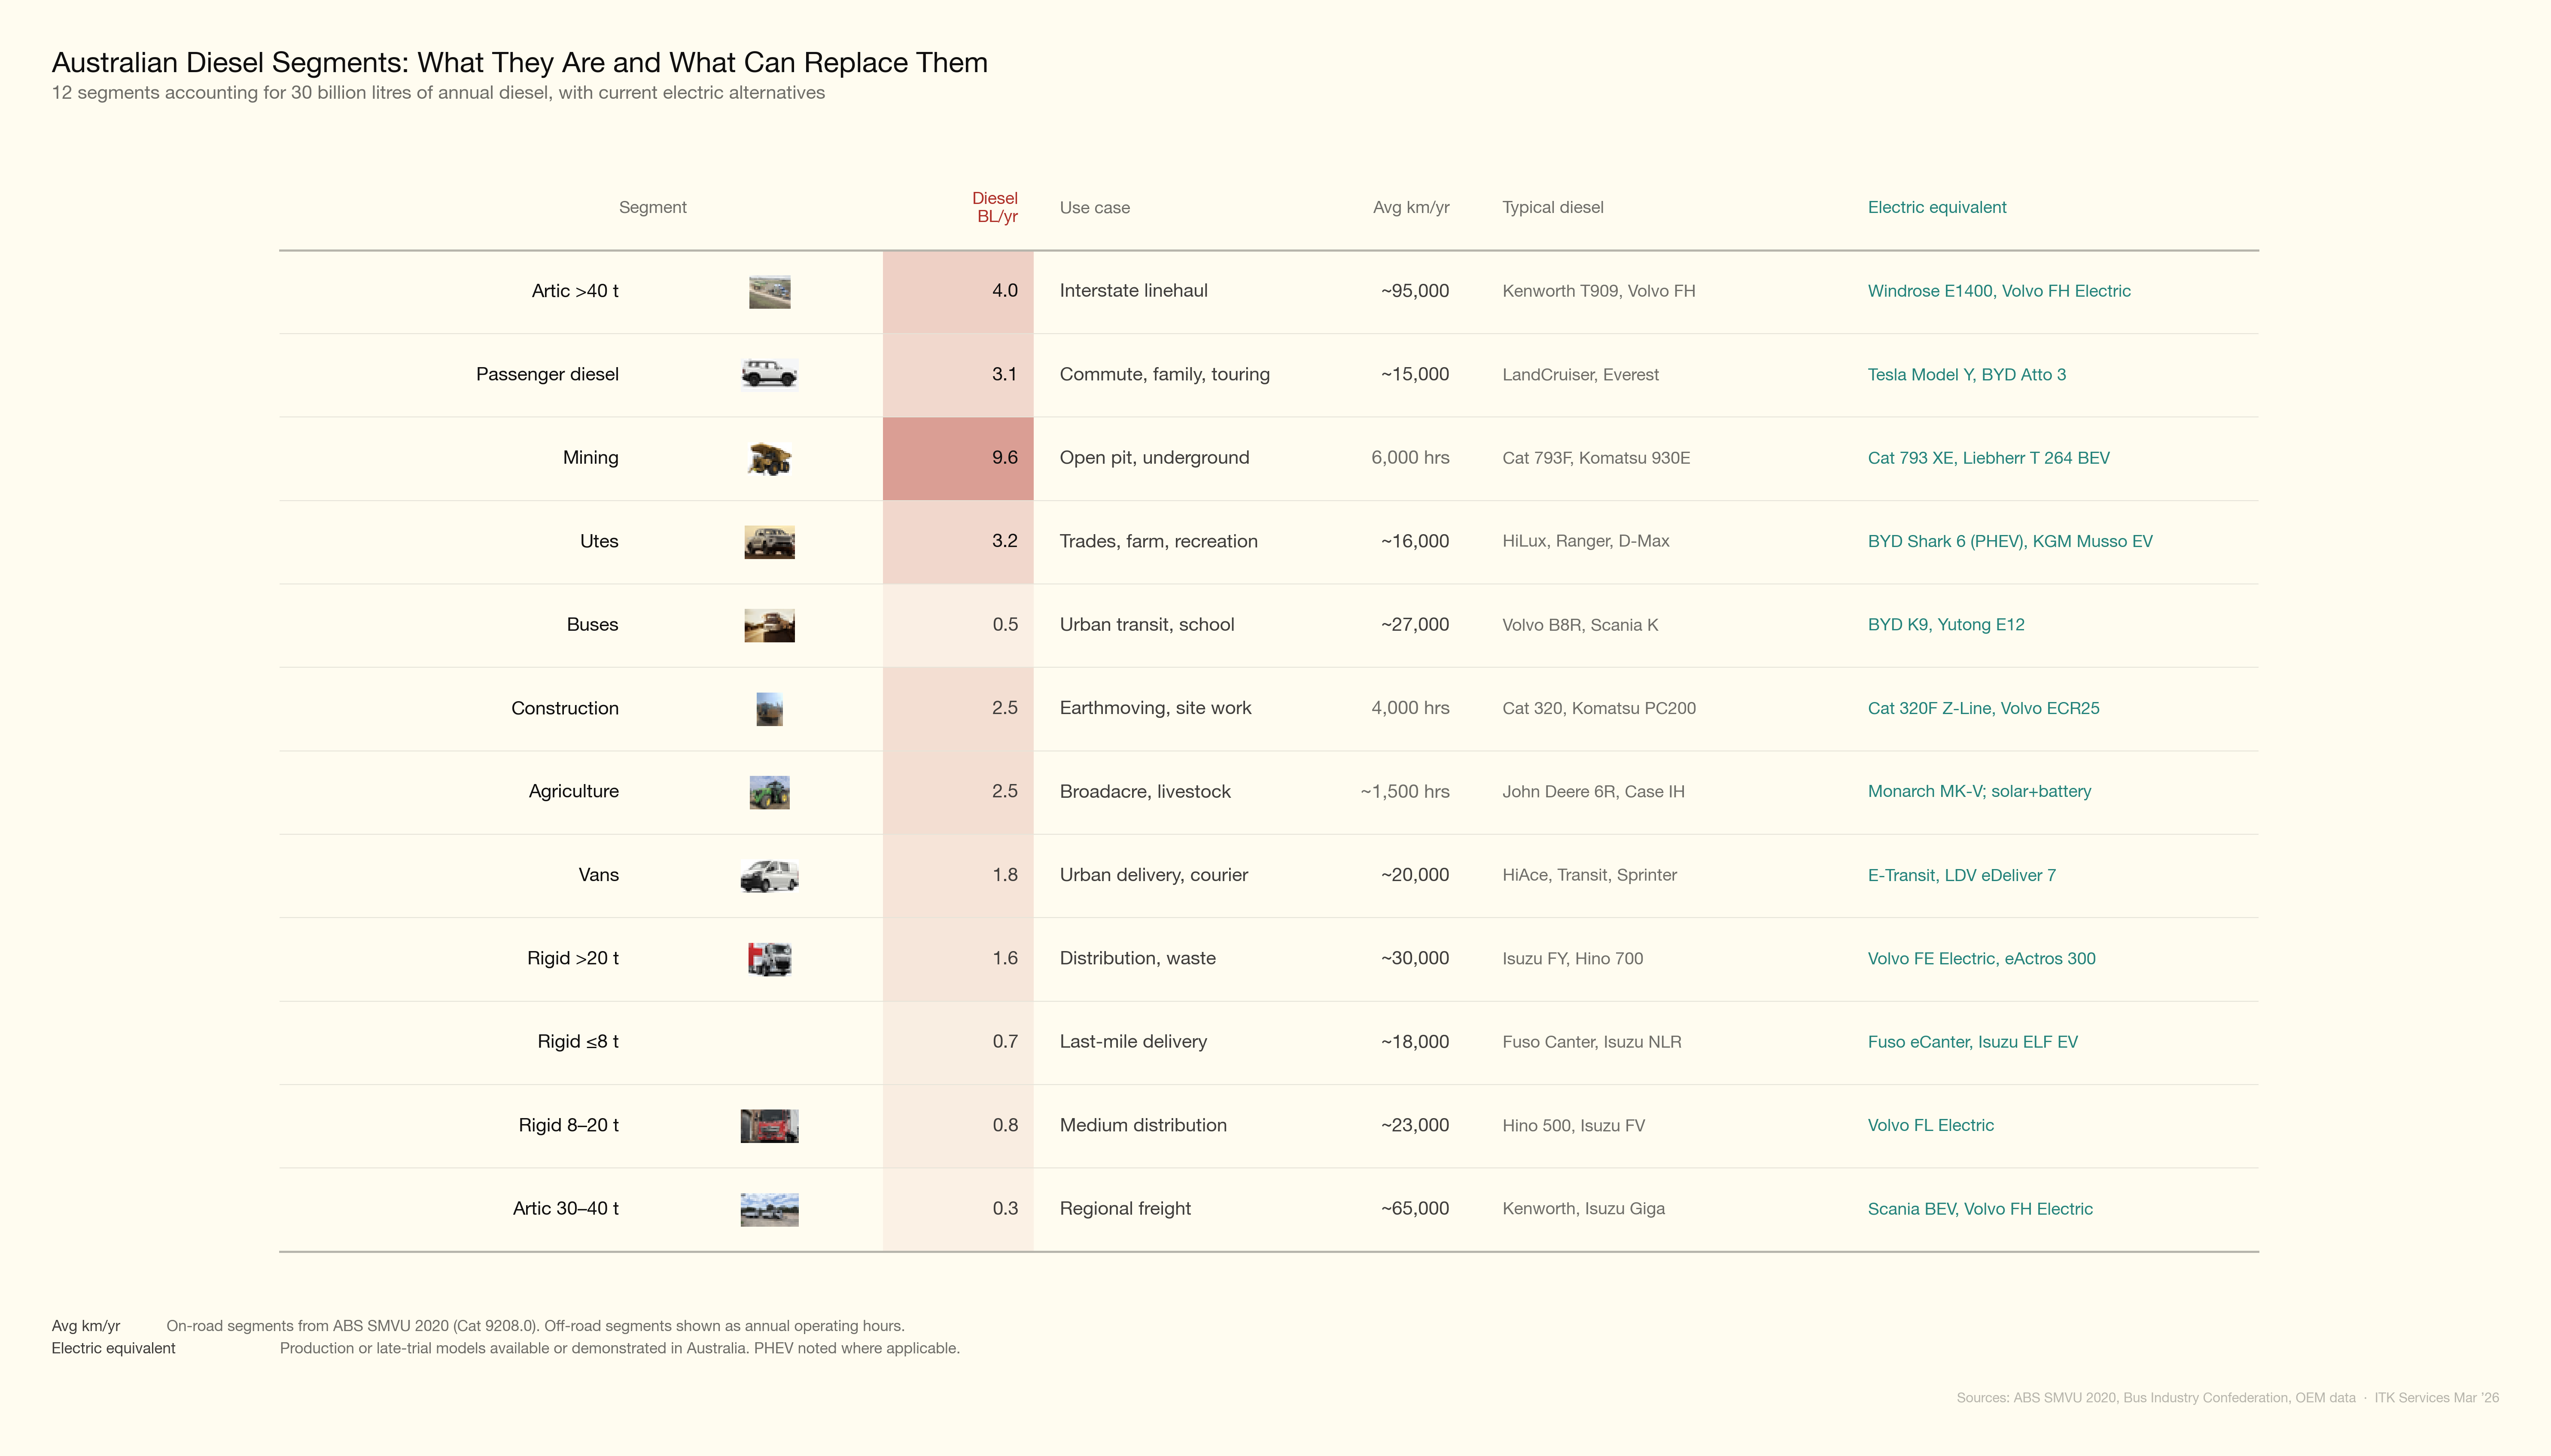
Australia consumed approximately 33.5 billion litres of diesel in 2025, up from 30 billion litres in 2022 (Department of Climate Change, Energy, the Environment and Water, 2026). About 60% is used on-road and 40% off-road. The on-road breakdown by vehicle type comes from the ABS Survey of Motor Vehicle Use (year ending June 2020), the last edition of this survey (Australian Bureau of Statistics, 2020). Off-road estimates are derived from Fuel Tax Credit claims and the IEEFA mining diesel report (Campbell, 2024; IEEFA, 2026). Each segment below includes a Chinese market comparison, since China leads global commercial vehicle electrification and provides the clearest signal of where technology and economics are heading.
As far as freight goes, the main commodities are:
1. Mining — 9.6 BL/yr
Mining is Australia’s single largest diesel-consuming sector, burning 9.6 billion litres in 2023–24 and producing 22 Mt CO2-e (IEEFA, 2026). This represents roughly 29% of national diesel consumption. Coal mining accounts for 48% and iron ore for 26% of mining diesel emissions — three-quarters of the total.
The diesel goes primarily into haul trucks (30–40% of mine-site consumption), excavators and loaders (15–20%), and ancillary equipment including dozers, water trucks, graders, and drill rigs (~40%). A single Cat 793F (240-tonne class) burns 200–450 litres per hour depending on grade and load, consuming approximately 1.8 million litres per year at 6,000 operating hours.
Mining diesel intensity has been rising, not falling. Coal mining diesel intensity increased 50% between FY2010-11 and FY2023-24, driven by deeper pits, rising strip ratios, and longer haul distances (IEEFA, 2026).
Electrification economics. Fuel dominates the cost stack of a mine site. A single 240-tonne haul truck consuming 300 L/hr for 6,000 hours burns ~1.8 million litres per year — a fuel bill of ~$3 million at bulk diesel prices. The BEV premium is not yet publicly disclosed, but Fortescue’s order for 360 Liebherr T 264 BEV trucks (at ~US$7.8M per unit implied by the US$2.8B deal value) suggests it may be modest relative to the fuel saving. The Fuel Tax Credits Scheme ($0.48/L rebate on off-road diesel) is the key policy lever: it subsidises mining diesel by roughly $4.6 billion per year, blunting the economic incentive to electrify. In China, over 100 XCMG battery-electric haul trucks operate at the Huaneng Yimin coal mine, with the China National Coal Association targeting 10,000 autonomous electric mining trucks by 2026. Underground electrification is further advanced: Sandvik, Epiroc, and Caterpillar all have production BEV loaders and trucks, driven by ventilation cost savings (30–40% of underground energy budgets).
| Parameter | Value | Source |
|---|---|---|
| Diesel consumption | 9.6 BL/yr | IEEFA 2026 |
| Typical vehicle (haul truck) | Cat 793F, Komatsu 930E | OEM data |
| New vehicle cost (240t haul truck) | $7–10 million | Industry estimate |
| Annual utilisation | ~6,000 operating hours | Industry standard |
2. Articulated trucks >40 t — 4.0 BL/yr
These are the B-doubles and road trains that carry the bulk of Australia’s interstate freight on the Hume, Pacific, and Newell highways. At 4,040 ML of diesel per year, this segment alone consumes more than all rigid trucks combined and accounts for 54% of all truck diesel (Australian Bureau of Statistics, 2020).
A typical vehicle is a Kenworth T909, Volvo FH16, or Mack Super-Liner prime mover hauling a single semi-trailer or B-double trailer set at up to 68 tonnes gross combination mass (GCM). Fleet-average fuel consumption is 53 L/100 km (ABS SMVU), though individual B-doubles on free-flow rural roads average 41–42 L/100 km.
Electrification economics. Fuel is the largest single operating cost for a long-haul prime mover, at $0.58/km for a semi-trailer and over $1.00/km for a B-double at 42 L/100 km. Electric trucks cut this by 47–71%, yielding annual savings of $21,000 (semi) to $73,000 (B-double at 100,000 km/yr). At an estimated BEV premium of ~$250,000, B-double payback is 3–4 years — compelling economics. The Windrose E1400 has demonstrated 68-tonne B-double operation in Australia, and Volvo FH Electric, Scania R 450e, and Mercedes eActros 600 are all in production for semi-trailers up to 44t GCW. Linfox has ordered 30 Volvo FH Electric trucks backed by $70 million in CEFC finance. In China, electric heavy truck penetration reached 28.9% of new sales in 2025, with electric trucks outselling diesel for the first time in a single month (December 2025). The main barrier in Australia is not the vehicle but the absence of megawatt-class charging infrastructure on key freight corridors.
| Parameter | Value | Source |
|---|---|---|
| Diesel consumption | 4.0 BL/yr (4,040 ML) | ABS SMVU 2020 |
| Typical vehicles | Kenworth T909, Volvo FH16 | Industry |
| New prime mover cost | $280,000–350,000 | TruckSales, dealer data |
| Average km/year | ~95,000 | ABS SMVU 20201 |
| Fleet-average fuel consumption | 53 L/100 km | ABS SMVU 2020 |
3. Utes — 3.2 BL/yr
Utes (dual-cab and single-cab pickups under 3.5 tonnes GVM) are Australia’s dominant light commercial vehicle. The Toyota HiLux has been Australia’s best-selling vehicle for most of the past decade; Ford Ranger, Isuzu D-Max, and Mitsubishi Triton round out the top sellers. Roughly 60% of light commercial vehicle diesel is consumed by utes, with the remainder split between vans and light cab-chassis.
Utes serve an extraordinarily diverse market: tradies, farmers, mining site vehicles, and increasingly everyday family transport. Three-quarters of ute fuel is diesel. Real-world fuel consumption is typically 8.5–10 L/100 km.
Electrification economics. Fuel is a modest share of ute running costs: at 9 L/100 km and 16,000 km/yr, annual diesel spend is ~$2,600. The realistic electrification pathway is PHEV, not BEV. The BYD Shark 6 ($57,900, 80 km electric range, 2,500 kg towing) is already the 4th best-selling 4x4 ute in Australia at near-diesel price parity. Full BEV utes remain compromised: the KGM Musso EV ($60,000, 420 km range) offers only ~$5,000 premium and 3-year payback, but the Toyota HiLux BEV (due H1 2026) has weak specifications — 240 km range, ~1,600 kg towing, and an estimated price of $90–100k. Because PHEVs displace only 50–70% of diesel (drivers revert to the combustion engine for long trips and heavy towing), the effective diesel displacement is closer to ~2 BL than 3.2 BL. Pickups are a niche category in China (~10% NEV penetration), so there is limited international signal to draw on.
| Parameter | Value | Source |
|---|---|---|
| Diesel consumption | ~3.2 BL/yr | Author estimate from ABS SMVU 20202 |
| Typical vehicles | Toyota HiLux, Ford Ranger, Isuzu D-Max | FCAI VFACTS |
| New vehicle cost (4x4 dual-cab) | $50,000–72,000 | Toyota, Ford, Isuzu (2026) |
| Average km/year | ~16,000 | ABS SMVU 2020 |
| Typical fuel consumption | 8.5–10 L/100 km | Owner reports, CarsGuide |
4. Passenger diesel — 3.1 BL/yr
Diesel passenger vehicles — primarily large SUVs and 4WDs — consumed 3,128 ML of diesel in 2020, making this the third-largest on-road segment (Australian Bureau of Statistics, 2020). The Toyota LandCruiser, Prado, Ford Everest, Isuzu MU-X, and Mazda CX-5 diesel are the dominant models.
This segment is unusual in that electrification is largely self-correcting. BEV prices are at or below diesel equivalents (a BYD Atto 3 at $40,000 competes with a diesel Mazda CX-5 at $42,000), and electric passenger vehicle sales are growing without significant policy support. The remaining barrier is the large 4WD/towing segment (LandCruiser, Patrol) where no electric alternative with comparable towing and off-road capability exists.
Electrification economics. Fuel costs are low relative to vehicle depreciation: at 8.5 L/100 km and 15,000 km/yr, annual diesel spend is ~$2,300. However, the capital premium for a BEV has collapsed to zero or negative — a BYD Atto 3 at $40,000 undercuts many diesel SUVs — delivering a 70% operating cost saving ($0.05/km electric vs $0.15/km diesel) with payback in 0–3 years. In China, electric vehicles reached ~50% of new passenger car sales in 2025, confirming this as a self-correcting market. The Australian NVES (New Vehicle Efficiency Standard) will accelerate the shift by penalising manufacturers whose fleet average exceeds CO2 targets. No policy intervention is needed beyond maintaining the existing settings.
| Parameter | Value | Source |
|---|---|---|
| Diesel consumption | 3.1 BL/yr (3,128 ML) | ABS SMVU 2020 |
| Typical vehicles | LandCruiser 300, Ford Everest, MU-X | FCAI VFACTS |
| New vehicle cost | $55,000–147,000 | Manufacturer websites (2026) |
| Average km/year | ~15,000 | ABS SMVU 20203 |
| Typical fuel consumption | 7–10 L/100 km | CarsGuide, Green Vehicle Guide |
5. Construction — 2.5 BL/yr
Construction diesel powers earthmoving equipment: excavators, loaders, bulldozers, cranes, compactors, and generators on building and civil engineering sites. This segment is estimated at approximately 2.5 billion litres per year, derived from Fuel Tax Credit claims and the ATSE diesel decarbonisation report (Australian Academy of Technological Sciences and Engineering, 2024; Campbell, 2024).
The equipment is highly diverse in size and application. A medium excavator (Cat 320 or Komatsu PC200, ~20 tonnes operating weight) consumes 15–25 litres per hour; large excavators (Cat 390, 90 tonnes) consume 40–60 L/hr. Most construction equipment operates 1,500–4,000 hours per year depending on project pipeline and weather.
Electrification economics. Fuel is a substantial operating cost: a 20-tonne excavator at 20 L/hr and 4,000 hours/yr consumes 80,000 litres of diesel ($132,000/yr at bulk rates). Electric excavators are emerging — Caterpillar’s 320F Z-Line and Volvo’s ECR25 Electric are in production or late trials — but most construction equipment categories (dozers, cranes, compactors) have no electric alternative at Australian-relevant sizes. The equipment typically moves between project sites, complicating charging infrastructure. On-site diesel generators, which could be replaced by battery-solar systems, account for a further share of construction diesel. Chinese manufacturers are ahead on smaller electric excavators but data on fleet-scale deployment is sparse.
| Parameter | Value | Source |
|---|---|---|
| Diesel consumption | ~2.5 BL/yr | Author estimate from FTC data |
| Typical vehicles | Cat 320, Komatsu PC200, Cat D6 dozer | OEM data |
| New equipment cost (20t excavator) | $190,000–300,000 | ConstructionSales, dealer data |
| Annual utilisation | ~4,000 operating hours | Industry estimate |
| Typical fuel consumption | 15–25 L/hr (20t excavator) | OEM specifications |
6. Agriculture — 2.5 BL/yr
Agriculture, forestry, and fishing together consume approximately 2.5 billion litres of diesel annually, primarily in tractors, harvesters, irrigation pumps, and generators. These sectors claim approximately $1.3 billion in Fuel Tax Credits — roughly one-third of mining’s share (Campbell, 2024). Diesel accounts for 84% of on-farm energy consumption.
The agricultural fleet is dominated by tractors (John Deere 6R series, Case IH Maxxum/Puma, New Holland) operating on broadacre grain, cotton, and livestock properties. Unlike road vehicles, agricultural equipment is measured in operating hours rather than kilometres. A mid-range tractor (150–250 hp) consumes 20–40 litres per hour and typically operates 1,000–2,000 hours per year, with seasonal peaks during planting and harvest.
Electrification economics. Fuel is a significant cost: a 200 hp tractor at 30 L/hr and 1,500 hours/yr burns 45,000 litres ($74,000/yr at bulk rates). But electric alternatives are embryonic. The Monarch MK-V autonomous electric tractor is in limited production in the US; John Deere has demonstrated a battery-electric prototype but has no production timeline. Solar-plus-battery systems for irrigation pumps and sheds are commercially proven and already deployed on Australian farms, but they address stationary loads, not mobile equipment. The agricultural fleet turns over very slowly (average age ~15 years) and operates in remote areas far from grid infrastructure, making depot charging impractical for most properties. China has limited electric tractor deployment and offers no useful signal for this segment. Agriculture scored 11/20 on the policy scorecard — a large diesel budget (4/5) undermined by near-zero vehicle availability (1/5).
| Parameter | Value | Source |
|---|---|---|
| Diesel consumption | ~2.5 BL/yr | Author estimate from FTC data |
| Typical vehicles | John Deere 6R, Case IH Maxxum | OEM data |
| New equipment cost (150–250 hp tractor) | $150,000–250,000 | Farm Machinery Sales |
| Annual utilisation | ~1,500 operating hours | Industry estimate |
| Typical fuel consumption | 20–40 L/hr | OEM specifications |
7. Vans — 1.8 BL/yr
Vans are the delivery and trade workhorses of urban Australia: Toyota HiAce, Ford Transit and Transit Custom, Mercedes Sprinter, Renault Master, and LDV Deliver. They serve couriers, parcel delivery fleets, tradies, and service operators. An estimated 35% of light commercial vehicle diesel goes to vans, giving approximately 1.8 billion litres per year.
Van operations suit electrification better than most segments: routes are predictable, daily distances are typically 100–200 km, and vehicles return to a depot for overnight charging. However, the absolute fuel bill is modest — at 9–12 L/100 km and 20,000 km/year, annual diesel cost is only ~$4,000 — making it difficult to recover the $20,000–35,000 electric premium purely from fuel savings.
Electrification economics. Fuel is a small share of van operating costs: at 11 L/100 km and 25,000 km/yr, annual diesel spend is ~$4,500. A 54% fuel saving yields only $2,500/yr, and the BEV premium is substantial — the Ford E-Transit starts at $69,990 (vs ~$55,000 diesel), while the Mercedes eSprinter commands a $39,000 premium over its diesel equivalent. Payback ranges from 6 years (E-Transit) to 16 years (eSprinter). The structural problem is that vans travel modest distances with light fuel consumption, so the annual saving is too small to justify the capital gap. In China, electric van and light truck penetration reached 45–59% in urban logistics in 2025, far ahead of what Australian economics would predict. The divergence is explained by Chinese EV prices 40–60% lower than in Australia and urban diesel access restrictions absent here. If Chinese-priced vans (from ~$15,000) entered Australia, the economics would shift rapidly. Vans scored 11/20 on the policy scorecard.
| Parameter | Value | Source |
|---|---|---|
| Diesel consumption | ~1.8 BL/yr | Author estimate from ABS SMVU 20204 |
| Typical vehicles | Toyota HiAce, Ford Transit, Mercedes Sprinter | Industry |
| New vehicle cost | $52,000–124,000 | Manufacturer websites (2026) |
| Average km/year | ~20,000 | ABS SMVU 2020 (LCV average) |
| Typical fuel consumption | 9–12 L/100 km | Fleet operator data |
8. Rigid trucks >20 t — 1.6 BL/yr
Heavy rigid trucks (three or more axles, over 20 tonnes GVM) are used for construction haulage, waste collection, fuel tankers, and short-haul distribution. They consumed 1,564 ML of diesel in 2020 (Australian Bureau of Statistics, 2020). These trucks are almost exclusively urban and suburban: 70% of rigid truck kilometres are in capital cities or other urban areas.
Waste collection is a particularly strong electrification candidate within this segment — stop-start urban routes with heavy braking (ideal for regenerative braking), predictable depot-based operations, and growing council commitments to zero-emission fleets. Volvo FE Electric and Mercedes eActros 300 address this market.
Electrification economics. Fuel is a moderate operating cost: at 32 L/100 km and 25,000 km/yr, annual diesel spend is ~$13,000. A 36% fuel saving yields ~$4,800/yr, but with BEV premiums estimated at $70,000–100,000 for heavy rigids, payback exceeds 15 years. Waste collection is the exception — stop-start urban routes maximise regenerative braking, and depot-based overnight charging is straightforward. Several Australian councils have trialled Volvo FE Electric and Mercedes eActros 300 refuse trucks, finding total cost of ownership competitive when maintenance savings (30–50% lower) are included. In China, heavy truck electrification reached 28.9% in 2025, though much of this is in long-haul and port drayage rather than rigid truck applications. The segment scored 11/20 on the policy scorecard; policy should target waste collection and port drayage as beachhead applications.
| Parameter | Value | Source |
|---|---|---|
| Diesel consumption | 1.6 BL/yr (1,564 ML) | ABS SMVU 2020 |
| Typical vehicles | Isuzu FY, Hino 700, Volvo FM | Industry |
| New vehicle cost | $200,000–465,000 | Hino, Isuzu (2025 pricing) |
| Average km/year | ~30,000 | ABS SMVU 2020 (heavy rigid estimate) |
| Typical fuel consumption | 30–35 L/100 km | ATAP, fleet data |
9. Rigid trucks 8–20 t — 0.8 BL/yr
Medium rigids are the workhorse of urban delivery — furniture, beverages, parcels, and building materials. At 813 ML of diesel per year, this is a modest segment in diesel terms (Australian Bureau of Statistics, 2020). Typical vehicles are the Hino 500 series and Isuzu FV/FVR, two-axle trucks with 8–20 tonnes GVM.
The electrification economics are the weakest of any on-road segment, as detailed below.
Electrification economics. This is the weakest on-road segment for electrification. At 22 L/100 km and 23,000 km/yr, annual diesel spend is ~$8,000, but the fuel saving is only 22% ($1,800/yr) — the lowest of any truck class. With a BEV premium of $50,000–80,000, payback exceeds 15 years on fuel savings alone. The Volvo FL Electric addresses this segment and DHL has reported positive total cost of ownership at high utilisation rates, but only when maintenance savings are included. Medium rigids scored just 8/20 on the policy scorecard — the lowest of any truck class. In China, light and medium truck electrification reached ~27% in 2025 (~300,000 units), driven by prices 40–60% below Australian levels and urban diesel access restrictions. No near-term policy action is warranted; economics will improve as battery prices fall.
| Parameter | Value | Source |
|---|---|---|
| Diesel consumption | 0.8 BL/yr (813 ML) | ABS SMVU 2020 |
| Typical vehicles | Hino 500, Isuzu FVR | Industry |
| New vehicle cost | $175,000–230,000 | Hino, Isuzu (2025 pricing) |
| Average km/year | ~23,000 | ABS SMVU 2020 (rigid average) |
| Typical fuel consumption | 20–25 L/100 km | ATAP, fleet data |
10. Rigid trucks 2648 t — 0.7 BL/yr
Light rigids (under 8 tonnes GVM) are the smallest trucks on the road — Fuso Canter, Isuzu NLR/NPR, and Hino 300 series. They consumed 746 ML of diesel in 2020 (Australian Bureau of Statistics, 2020). Many can be driven on a standard car licence (up to 4.5 tonnes GVM in most states), making them accessible to small businesses and sole traders.
This is the segment where electric trucks first became commercially viable. The Fuso eCanter (second generation, from 4.5t GVM) offers 14 variants with up to 300 km range at $68,900–125,000. The small battery and light weight mean charging from a standard depot outlet is practical overnight.
Electrification economics. Fuel is a modest cost: at 16 L/100 km and 18,000 km/yr, annual diesel spend is ~$4,700. A 42% fuel saving yields ~$2,000/yr. The Fuso eCanter (from $68,900) commands a premium of ~$14,000–30,000 over diesel equivalents, giving a payback of ~10 years on fuel savings alone. When maintenance savings are included (electric drivetrains have 30–50% lower servicing costs), payback drops to 6–8 years. This is the most accessible electric truck segment: small batteries can charge overnight from a standard 15A depot outlet, and the weight class means no special licence is needed. The eCanter is in production and several Australian fleets (including Australia Post) are trialling it. In China, light truck electrification is well advanced (~27% penetration), confirming the technology is mature. The segment scored 10/20 on the policy scorecard — limited by the small diesel budget (0.7 BL).
| Parameter | Value | Source |
|---|---|---|
| Diesel consumption | 0.7 BL/yr (746 ML) | ABS SMVU 2020 |
| Typical vehicles | Fuso Canter, Isuzu NLR, Hino 300 | Industry |
| New vehicle cost | $55,000–125,000 | Fuso, Isuzu (2025–26 pricing) |
| Average km/year | ~18,000 | ABS SMVU 2020 (rigid, light estimate) |
| Typical fuel consumption | 15–18 L/100 km | Fleet data |
11. Buses — 0.5 BL/yr
Buses consumed 530 ML of diesel in 2020 — just 3.3% of road diesel and 1.6% of total national diesel (Australian Bureau of Statistics, 2020). The fleet comprises approximately 100,000 registered buses, of which roughly 20,000 are transit route buses operated by state transport authorities, ~35,000 are school buses, and ~45,000 are coaches and charter vehicles.
Despite the small volume of diesel consumed, buses have the strongest electrification economics of any segment. Fixed routes, depot-based overnight charging, high utilisation (metro buses do 60,000–80,000 km/year), and government procurement control make this the most tractable segment. Every state has announced or begun zero-emission bus procurement. NSW has the largest bus diesel consumption at 177 ML, followed by QLD (107 ML) and VIC (102 ML) (Australian Bureau of Statistics, 2020).
Electrification economics. Fuel is a large share of bus operating costs: a metro transit bus at 42 L/100 km and 60,000 km/yr burns 25,200 litres ($42,000/yr). A 64% fuel saving yields ~$26,600/yr — the best of any on-road segment except B-double trucks. The BEV premium is $300,000–400,000, giving a payback of 4–6 years (faster when maintenance savings are included). The BYD K9 and Yutong E12 are in production and deployed across Australian cities; Transport for NSW has ordered 120 electric buses and every state has zero-emission bus procurement targets. In China, electric bus penetration reached ~95% of new sales (Shenzhen has been 100% electric since 2018), confirming this as the most mature commercial vehicle electrification segment globally. Buses scored 12/20 on the policy scorecard — excellent economics (5/5) and vehicle availability (5/5) are limited only by the small diesel budget (1/5). Government controls procurement directly, so this is the fastest-moving segment: the policy challenge is simply to accelerate existing procurement timelines.
| Parameter | Value | Source |
|---|---|---|
| Diesel consumption | 0.5 BL/yr (530 ML) | ABS SMVU 2020 |
| Typical vehicles | Volvo B8R, Scania K, BCI | Transit authorities |
| New vehicle cost (12.7m transit bus) | $400,000–700,000 | Industry estimate |
| Average km/year (metro transit) | ~27,000 (all buses); ~65,000 (metro route) | ABS SMVU 2020; operator data |
| Typical fuel consumption | 40–45 L/100 km | Transit fleet data |
12. Articulated trucks 30–40 t — 0.3 BL/yr
Lighter articulated trucks (30–40 tonnes GCM) are standard semitrailers used for regional distribution. At just 281 ML of diesel per year, this is the smallest identified segment (Australian Bureau of Statistics, 2020). The category includes lighter 4–5 axle prime-mover-and-trailer combinations that operate shorter routes than the heavy (>40t) interstate fleet.
Electric alternatives are well suited to this weight class. The Mercedes eActros 600 (44t GCW), Volvo FH Electric (44t), and Scania R 450e (up to 64t) all serve this segment. The constraint is not vehicle availability but the small volume at stake — electrifying this entire segment would displace less diesel than a single large mine site consumes.
Electrification economics. Fuel is a moderate operating cost: at 28 L/100 km and 60,000 km/yr, annual diesel spend is ~$27,000. A 46% fuel saving yields ~$12,600/yr, but with a BEV premium of ~$200,000, payback is ~15 years. Multiple production vehicles exist (Scania BEV, Volvo FH Electric, Mercedes eActros 600), so vehicle availability is not the constraint. The segment scored just 8/20 on the policy scorecard — the tiny diesel budget (1/5) means that even complete electrification would displace only 281 ML, less than a single large mine site. In China, these vehicles fall within the broader heavy truck category (28.9% NE penetration). No dedicated policy intervention is warranted; these trucks will electrify as a spillover from the heavy artic segment as vehicle prices and charging infrastructure mature.
| Parameter | Value | Source |
|---|---|---|
| Diesel consumption | 0.3 BL/yr (281 ML) | ABS SMVU 2020 |
| Typical vehicles | Isuzu Giga, Kenworth T400 series | Industry |
| New vehicle cost | $180,000–250,000 | TruckSales, dealer data |
| Average km/year | ~65,000 | Author estimate5 |
| Typical fuel consumption | 27–30 L/100 km | ATAP |
Battery swap vs conductive charging
The segment profiles above show that long-haul trucking and mining offer the largest diesel displacement opportunities with the strongest economics. For heavy trucking, the critical enabler is not the vehicle — multiple production models exist — but the charging infrastructure. Two competing models have emerged: battery swapping (dominant in China) and megawatt conductive charging (the emerging global standard). Both solve the same problem — getting enough energy into a 40+ tonne truck within a 30-minute driver break — but they differ fundamentally in cost structure, infrastructure requirements, and OEM alignment.
The most likely long-term outcome is regional bifurcation: battery swap in China (where it has critical mass and government support), and MCS conductive charging everywhere else. For new vehicles in Australia, this means the relevant technology pathway is MCS — and the critical gap is not vehicle availability but charging infrastructure on key freight corridors.
Battery swap: China’s approach
CATL, the world’s largest battery manufacturer, operates a heavy-truck battery-swap network through its subsidiary Qiji Energy. The system uses a standardised “75#” swap block with a capacity of 171 kWh per module — trucks carry one to three modules depending on range requirements. Each swap station holds 24 battery packs and is compatible with over 95% of mainstream Chinese heavy-truck models (CATL, 2025).
Key metrics:
- Swap time: approximately 5 minutes
- Stations operational: ~305 heavy-truck stations at end 2025, targeting 900 by end 2026
- OEM partners: 30+ truck models from Sinotruk, FAW Jiefang, Foton, DeepWay, and SAIC
- Longest route: 1,250 km Shanghai–Chengdu Expressway corridor with 12 stations (CarNewsChina, 2025b)
- 2030 target: coverage of ~180,000 km of routes and 80% of China’s truck transport corridors
The vehicle-battery separation model
Under the “separation of vehicle and battery” model, truck buyers pay only for the glider (cab and chassis), reducing upfront capital by 30–40%. CATL retains ownership of the batteries and charges a per-swap or per-kWh service fee. This is the critical economic innovation: it transforms the battery from a capital cost into an operating cost, making electric trucks cost-competitive with diesel on day one for fixed urban and regional routes. CATL claims each truck saves 30,000–60,000 yuan (A$6,500–13,000) per year in operating costs.
The model also enables battery lifecycle management — CATL can rotate packs across the fleet, replacing degraded cells before they affect truck range, and repurpose retired packs for stationary storage. This addresses the fleet operator’s largest anxiety: battery degradation risk over a 10–15 year vehicle life.
Outside China
Battery swap for heavy trucks barely exists outside China. The only significant initiative is Germany’s eHaul research project, which built Europe’s first automated truck battery-swap station at Lubbenau — swapping 440 kWh batteries in approximately 10 minutes for trucks up to 40 tonnes (electrive, 2026a). A DIN standard (DIN SPEC 91533) for truck battery swapping is expected in Q1 2026, with NIO contributing. But this remains at research stage, not commercial deployment.
The fundamental barrier is standardisation. Within China, CATL can enforce a single swap-block standard across domestic OEMs, backed by government policy. Globally, no equivalent coordination exists. Daimler, Volvo, and Scania each have different battery architectures; standardising a physical swap interface across competing OEMs would require the kind of industry alignment that took a decade for CCS passenger vehicle charging.
Megawatt Charging System (MCS): the global standard
The MCS connector, developed by CharIN e.V. (the same industry body behind the CCS charging standard), defines the emerging global standard for heavy-duty vehicle charging (CharIN e.V., 2025).
MCS Specifications:
| Parameter | Specification |
|---|---|
| Maximum voltage | 1,250 V DC |
| Maximum current | 3,000 A |
| Maximum power | 3.75 MW |
| Cooling | Liquid-cooled cable and connector |
| Charge time (20–80%) | <30 minutes at full rate |
The 3.75 MW ceiling is a theoretical maximum. Commercial deployments in 2025–26 operate at lower power levels, reflecting both charger supply and truck battery acceptance rates.
Current commercial charge rates
| OEM / Operator | Power (kW) | Status | Region |
|---|---|---|---|
| Huawei (truck supercharger) | 1,440 | Deployed Aug 2025 | China |
| Tesla Megacharger (Semi) | 1,200 | Operational at 2 sites | USA |
| ABB (MCS charger) | 1,200 | Shipping 2025 | Global |
| BYD Flash Charging | 1,000–1,500 | Rolling out Apr 2025 | China |
| Kempower MCS | 1,000+ | Available 2025 | Europe |
| Mercedes eActros 600 + ABB | 1,000 | Demonstrated | Europe |
| Scania MCS (first generation) | 750 | Trucks from mid-2026 | Europe |
At 1 MW, a truck can charge from 20% to 80% state of charge in under 30 minutes, which aligns with mandatory driver rest periods under EU and US hours-of-service regulations (Volvo Trucks, 2025b). This is the critical design constraint: the charge rate must fit within a 30–45 minute driver break.
OEM alignment
Every major Western truck OEM has committed to MCS:
- Scania (Traton): MCS commercially available from early 2026 (Charged EVs, 2026)
- Volvo Trucks: FH Aero Electric with 780 kWh battery, 600 km range, orders open Q2 2026 (Volvo Trucks, 2025a)
- Mercedes-Benz: eActros 600 in production since November 2024, MCS customer trials in H2 2026 (electrive, 2026b)
- MAN (Traton): successful MCS interoperability tests with Kempower chargers
Charging network deployments
| Operator | Geography | MCS hubs operational | MCS points planned | Target date |
|---|---|---|---|---|
| Milence (Daimler/Traton/Volvo JV) | 8 EU countries | 3 | 284 across 71 locations | 2027 |
| E.ON / Voltix / GreenWay (HDV-E) | 9 EU countries | 0 | 330 across 55 locations | 2028 |
| Tesla (Megacharger) | US | 0 | 66 sites identified | 2026–27 |
Sources: Milence (Milence, 2025a); E.ON (E.ON, 2025); Tesla (electrive, 2026c).
Milence’s three operational MCS hubs — at Zwolle (Netherlands), Port of Antwerp-Bruges (Belgium), and Landvetter (Sweden) — are building towards Europe’s first MCS corridor from Antwerp to Stockholm, over 1,500 km along TEN-T freight routes.
Tesla Semi and Megacharger
Tesla has chosen a proprietary Megacharger system rather than the CharIN MCS standard, though power levels are comparable. In December 2025, Tesla released footage showing a Semi drawing 1,206 kW (1.2 MW) during a live charging session — sufficient to replenish approximately 640 km of range in 30 minutes (Clean Trucking, 2025).
Tesla has identified 66 Megacharger sites across the US, with 37 expected to open in 2026 and a target of 46 operational by early 2027. Sites are planned at Pilot Travel Centers along major freight corridors in California, Georgia, Nevada, New Mexico, and Texas (Electrek, 2026; electrive, 2026c).
Tesla’s proprietary connector — separate from both CCS and MCS — raises interoperability questions. Tesla has historically opened its passenger vehicle Supercharger network to non-Tesla vehicles, but whether this extends to the Megacharger remains to be seen.
Windrose: fast charging comes to Australia
Windrose Technology (founded in Hefei, headquartered in Antwerp) is the electric truck manufacturer most relevant to Australia through its partnership with New Energy Transport (NET). Windrose has firmly chosen conductive fast charging over battery swap.
The Windrose E1400:
| Parameter | Value |
|---|---|
| Peak power | 1,400 hp (1,044 kW), four motors |
| Battery | 729 kWh LFP (860 kWh option for B-double) |
| Range | 670 km at 49t GCW |
| B-double capability | 68 tonnes |
| Platform voltage | 800V |
Charging demonstrations:
- Dual CCS2: two 350 kW chargers delivering >650 kW simultaneously (demonstrated with Terawatt Infrastructure, June 2025) (Charged EVs, 2025)
- MCS standard: demo with Autel MaxiCharger in Roosendaal, Netherlands (March 2026) delivering 1.2 MW via MCS connector (electrive, 2026d)
Australian deployments: NET completed Australia’s longest single-charge electric truck delivery — a 480 km round trip from Picton (south of Sydney) to Beresfield (Hunter region) carrying 36 tonnes, arriving 40 minutes faster than diesel due to superior uphill performance (The Driven, 2025). NET has secured a site at Wilton (80 km southwest of Sydney) for Australia’s largest heavy electric trucking depot, supporting up to 50 trucks, with plans to expand to Adelaide–Melbourne–Sydney–Canberra–Brisbane routes and a fleet of 200+ trucks by 2031.
China’s charging infrastructure scale
China is the clear global leader in deployed heavy truck charging infrastructure. As of late 2025, China has more than 9,000 public charging stations dedicated to heavy-duty electric trucks, covering major logistics corridors, industrial clusters, ports, and mining zones (Anengjie Energy, 2025). This is an order of magnitude ahead of either the US or Europe.
The most impressive single facility is the Huawei “Sichuan Yuanqi Xingguang” megawatt supercharging station in Beichuan, Sichuan Province, which commenced operations in August 2025 (Interesting Engineering, 2025).
| Parameter | Value |
|---|---|
| Total designed capacity | 100 MW |
| Supercharging bays | 18 at 1.44 MW each |
| Fast charging bays | 108 at 600 kW each |
| Site area | 11.5 acres (4.7 hectares) |
| Construction cost | US$20.9 million |
| Daily throughput | 700 trucks / 300,000+ kWh |
| Charge speed (3.5C trucks) | ~100 km range in 5 minutes |
At US$20.9 million for a 126-bay, 100 MW facility, the cost per charging point is approximately US$166,000 — substantially below Western equivalents. Milence’s European network implies ~EUR 294,000 per point; the Kettleman City project in California budgeted US$58 million for 56 chargers (~US$1 million per point including solar and battery) (Milence, 2025b; The Business Journal, 2024).
Head-to-head comparison
Battery swap vs megawatt charging: key dimensions
| Dimension | Battery swap (CATL/China) | MCS / fast charging (global) |
|---|---|---|
| Turnaround time | ~5 minutes | 20–45 minutes (improving) |
| Upfront truck cost | Lower (battery leased) | Higher (battery included) |
| Infrastructure cost per site | Very high (24 packs at 171 kWh each) | Lower, but grid upgrades needed |
| Grid impact | Lower (batteries charged off-peak) | Higher (MW-scale demand spikes) |
| OEM buy-in | Chinese domestic OEMs only | All major global OEMs |
| Standardisation | Single standard within China | CharIN MCS (open); Tesla proprietary |
| Geographic reach | China only (as of 2026) | Europe, North America, Australia |
| Battery lifecycle management | Centralised (CATL manages) | Decentralised (fleet operator’s risk) |
| Technology lock-in | High (tied to CATL ecosystem) | Low (open standard, multiple vendors) |
The charging speed gap is narrowing
The swap model’s strongest advantage is speed: 5 minutes versus 20–45 minutes for conductive charging. But this gap is closing rapidly. BYD’s 1.5 MW “Flash Charging” technology — demonstrated for passenger vehicles but applicable to trucks — achieves 10–97% charge in 9 minutes (CarNewsChina, 2025a). Huawei’s 1.44 MW chargers with 3.5C-rate truck batteries deliver ~100 km of range in 5 minutes.
At these power levels, the time penalty of conductive charging versus swap becomes marginal when including time to enter and exit a swap station, and to verify pack integrity. By the late 2020s, a 5–10 minute megawatt charge may deliver sufficient range to match the convenience of a swap stop.
The swap model’s structural advantages
Speed aside, battery swap has two structural advantages that conductive charging cannot replicate:
Upfront cost reduction. Separating the battery from the vehicle cuts the truck’s purchase price by 30–40%. For a fleet operator buying 50 trucks, this is a $5–10 million capital saving at point of purchase. Conductive charging requires the full battery cost to be embedded in the vehicle price.
Grid flexibility. A swap station’s 24 battery packs (~4 MWh of storage) can charge slowly during off-peak hours and swap quickly during peak truck traffic. This decouples the timing of grid demand from the timing of truck refuelling. A conductive charger, by contrast, creates a MW-scale demand spike exactly when trucks arrive — typically during morning and evening freight peaks.
Both advantages may erode over time: battery prices are falling (reducing the capital premium argument), and smart depot charging with on-site storage can mitigate grid peak impacts.
Outlook: MCS has broader global support
In the end, self-interest probably means truck manufacturers don’t want to become dependent on battery swap operators. Too much value passes to the battery and station owner, and adoption rates depend entirely on the swap operator’s rollout success.
Megawatt conductive charging is the emerging global standard. Every major Western truck OEM (Daimler, Volvo, Traton/Scania/MAN) has aligned behind MCS. Tesla is at comparable power levels with a proprietary connector. Windrose supports both CCS2 and MCS.
Battery swap is a viable and rapidly scaling solution within China — where CATL can enforce standardisation across domestic OEMs, government policy supports the model, and 305+ stations already operate. But outside China, no commercial battery-swap network for heavy trucks exists, and no major non-Chinese OEM has committed to the model.
The critical question is whether Chinese truck manufacturers bring battery swap with them as they expand internationally. If XCMG, SANY, and Sinotruk enter the Australian market (as they are entering Southeast Asia and the Middle East), they may bring the swap ecosystem as a bundled offering. But the Western OEMs that dominate Australian trucking — Volvo, Scania, Daimler, PACCAR — are all committed to MCS.
Implications for Australia
For Australia, the relevant technology pathway is MCS conductive charging. The critical gap is not vehicle availability but charging infrastructure on key freight corridors. As of March 2026, Australia has no publicly accessible heavy-vehicle megawatt charging station.
The priority actions are:
- Corridor charging on the Hume, Pacific, and Newell highways — Australia’s three highest-volume freight routes, analogous to Europe’s TEN-T corridors
- Grid connection pre-investment at major logistics hubs (Moorebank, Somerton, Acacia Ridge) where 10–20 MW connections will be needed
- Standards alignment — ensuring Australian regulations recognise and accommodate MCS connectors and 1,250V DC systems
Janus
Janus is, incredibly, publicly listed with a market cap of $12 m. Its model is battery swap and I think focussed on retrofit. The key positive for Janus was Ben Hutt agreeing to become CEO. The company’s focus has since switched somewhat from Australia to Californian ports.
The original Janus model converts existing Kenworth/Volvos for around $150,000–$250,000 per truck with a 540 kW motor and a 620 kWh pack. Pack swaps take about 4 minutes via forklift. There are 2–3 swap stations in Australia.
If the new vehicle electric economics become more popular and start to gain market share then I think the retrofit market can be dragged along with it and Janus, if it can survive long enough may eventually have a viable business.
Electrification and CO2 implications
The macroeconomic case for diesel electrification is striking. It rests on three components: fuel cost savings, import substitution, and carbon reduction.
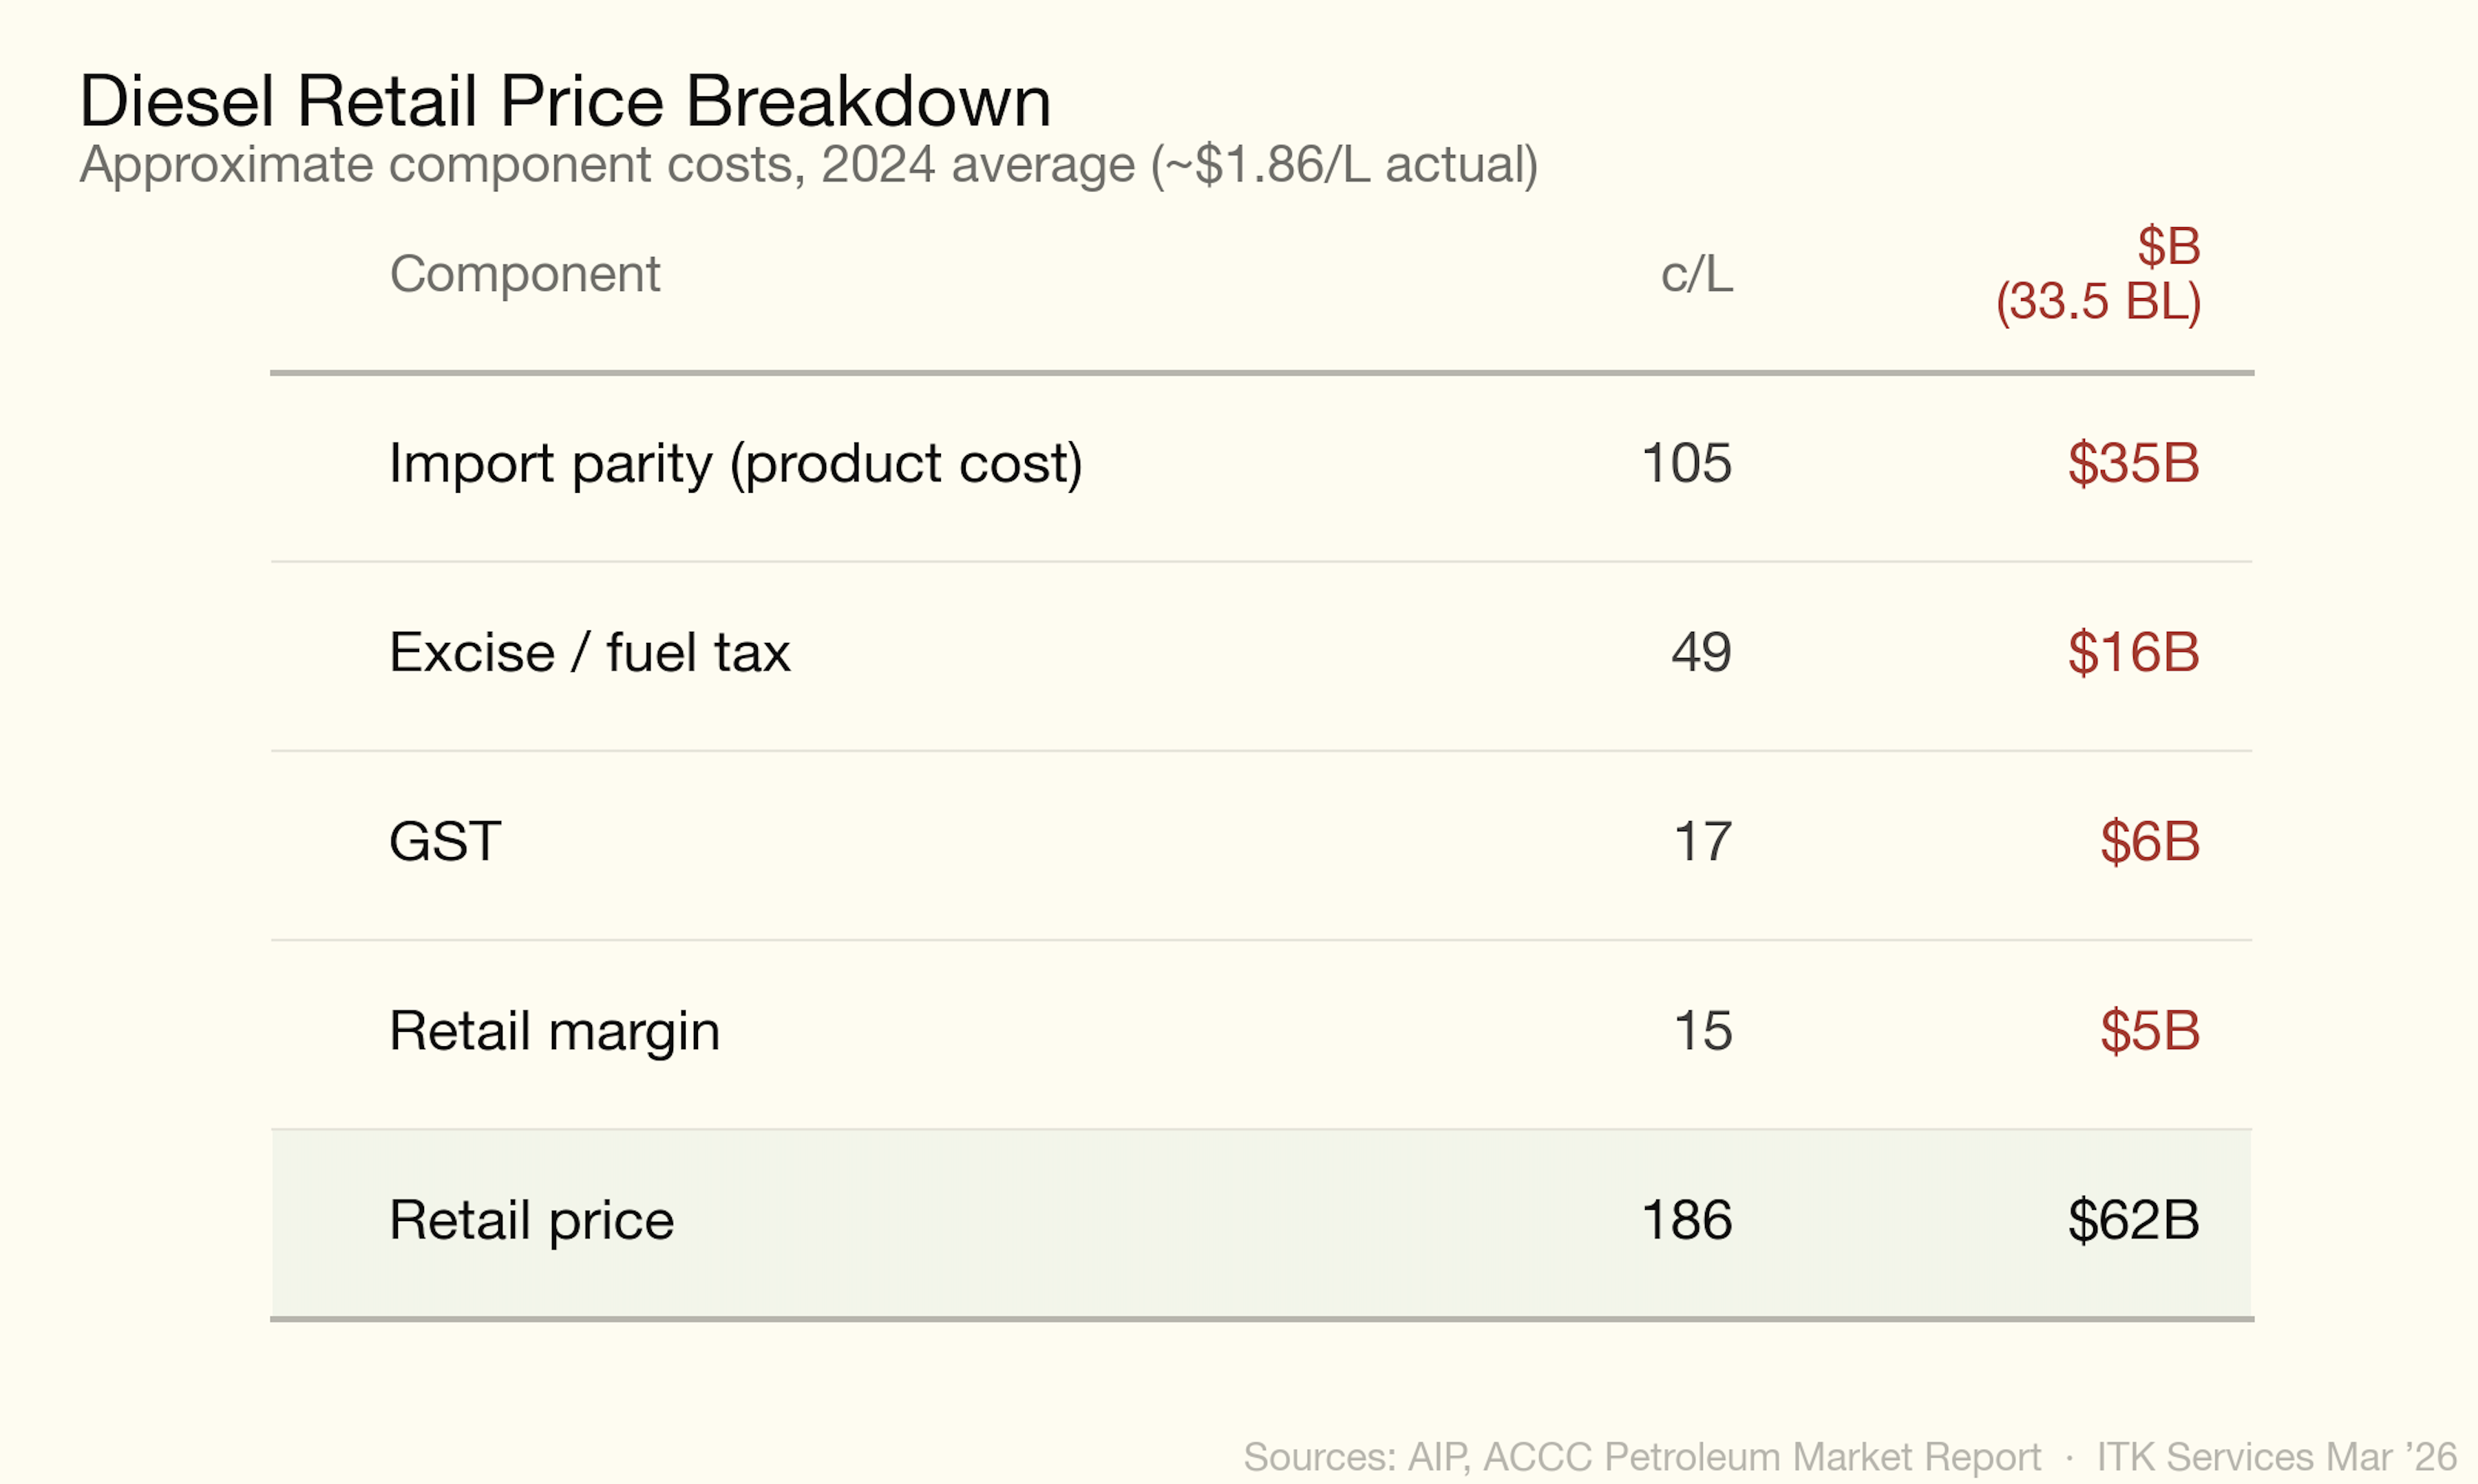
At retail prices, 100% diesel replacement costs about $67 bn at the pump, and using $150/MWh for electricity the savings are a remarkable $54 bn per year. However, the productivity implications are better measured using the import cost of diesel — about $35 bn — which means that at 100% diesel replacement Australia saves about $22 bn a year in import substitution. To that I would add $15 bn representing the value of 90 Mt of avoided CO2 at the AER 2035 price of $176/t. So that’s a total of $37 bn a year, or about 2% of GDP.
And if you use a government bond rate of 5% that’s a net present value of roughly $750 bn.
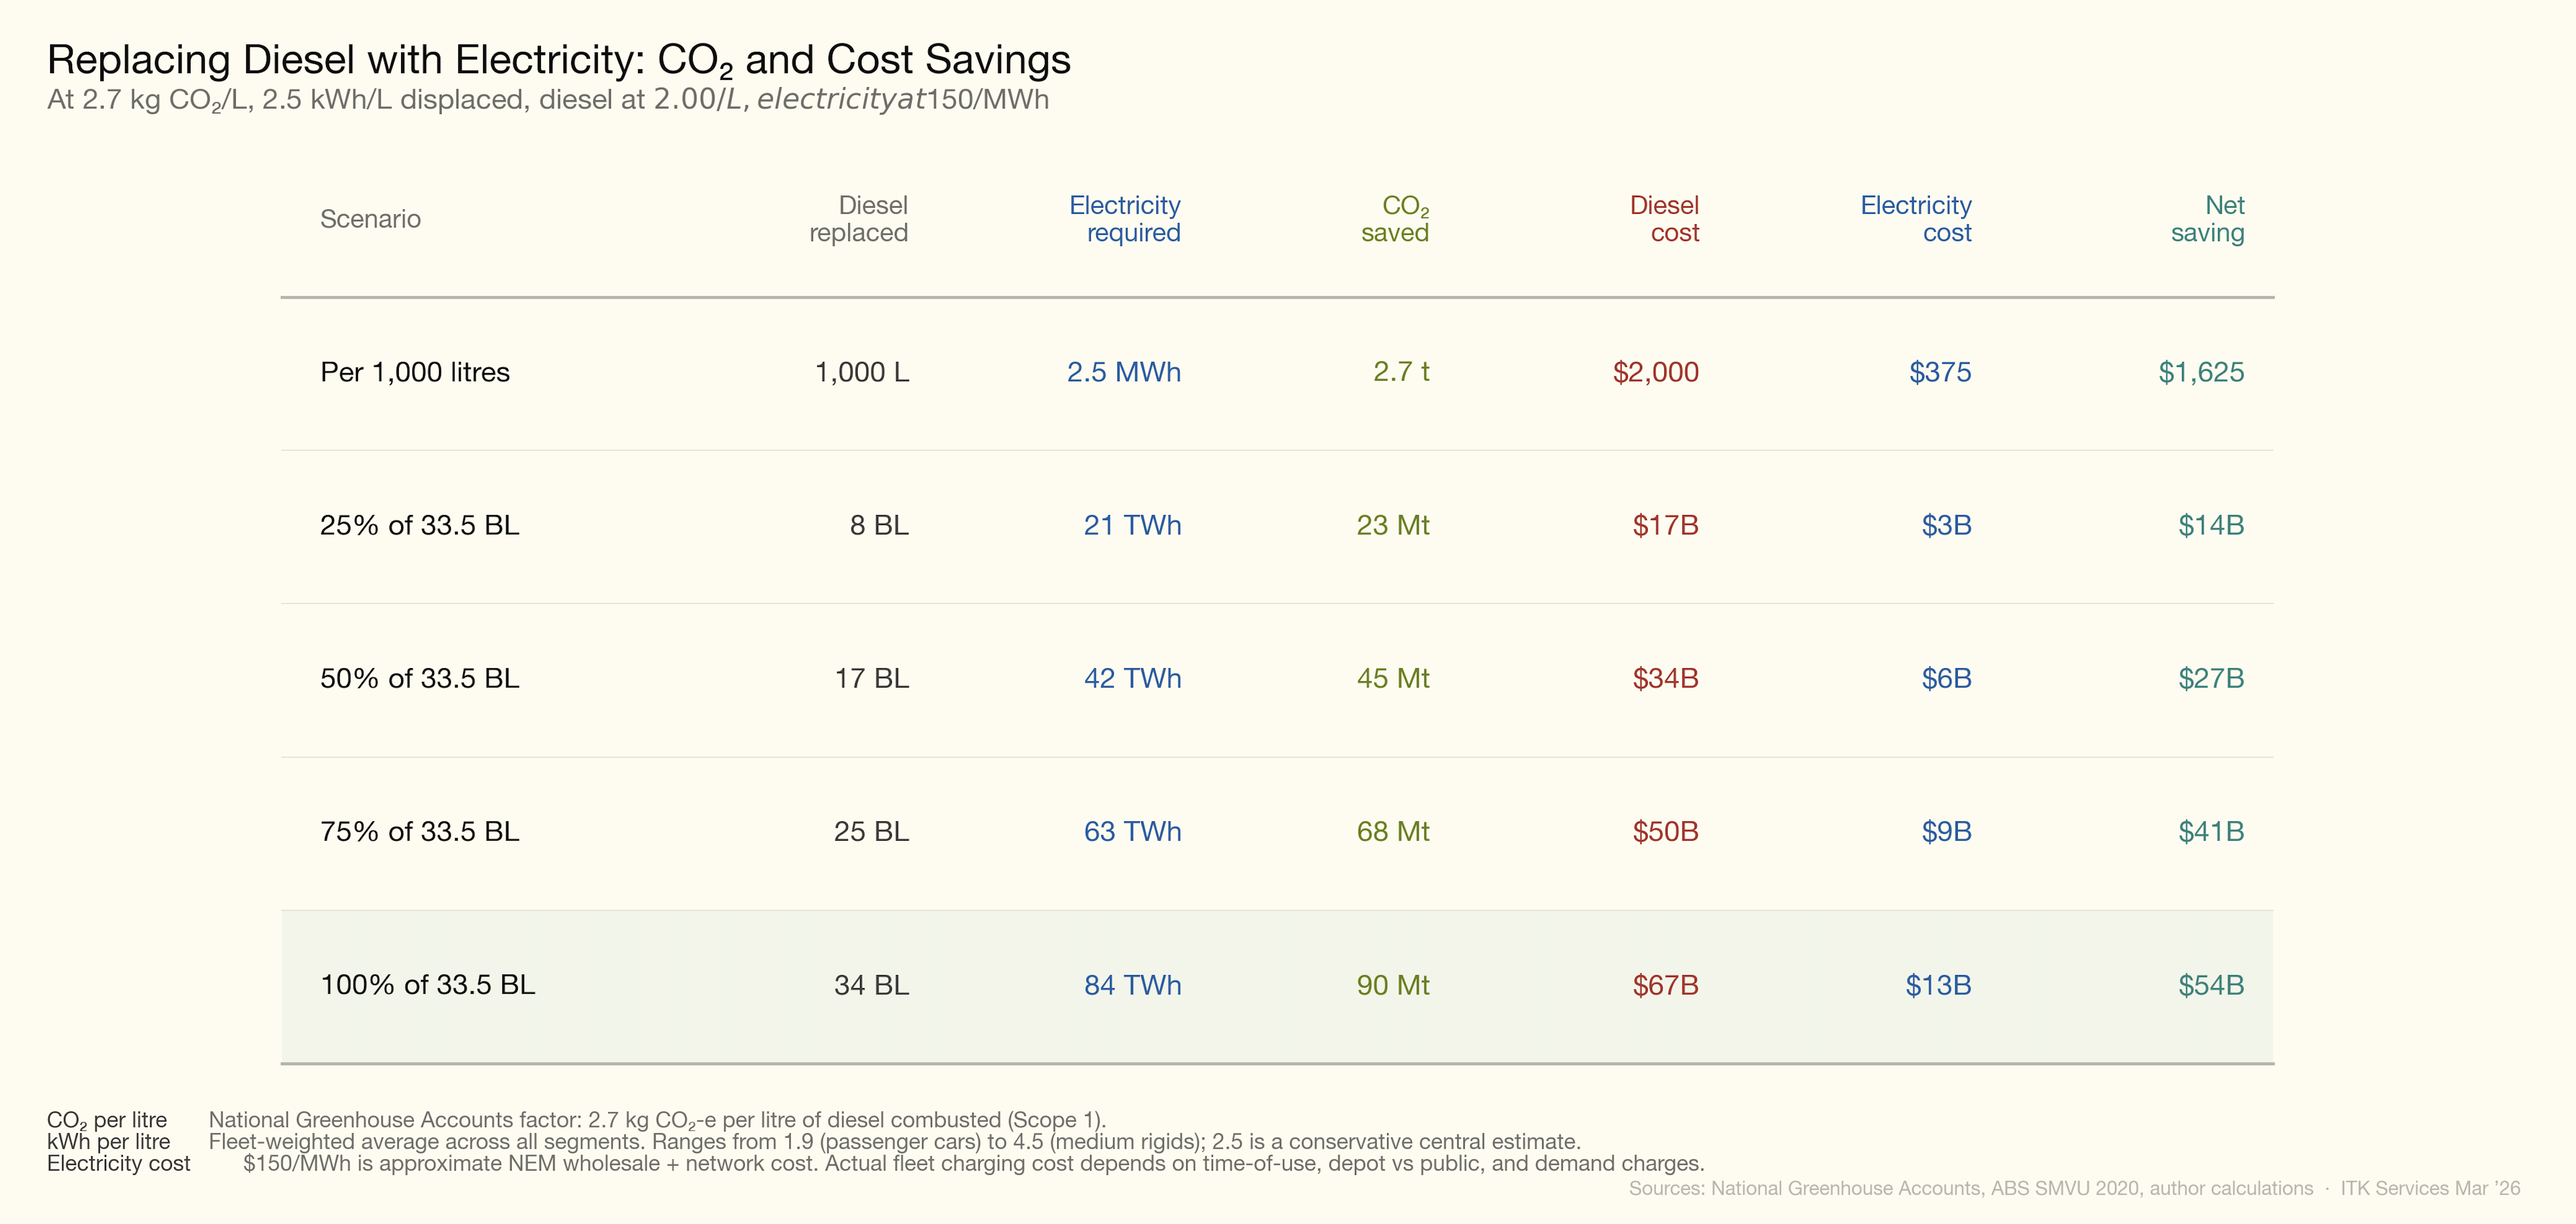
The electricity required to replace all diesel would be roughly 84 TWh — about 30% of last year’s Australian electricity supply, maybe a bit less. It’s substantial but I’d argue easily within Australia’s capabilities. After all, we’ve added more renewable energy than that in the past decade.
Fuel Tax Credits Scheme
What it is
The Fuel Tax Credits Scheme (FTCS) refunds fuel excise to businesses that use diesel (and other fuels) for off-road purposes or in heavy on-road vehicles. The policy rationale is that fuel excise is a road-user charge: if your diesel never touches a public road, you shouldn’t pay it.
The current credit rate for off-road diesel is 48.8 c/L — effectively the full excise. Heavy on-road vehicles (over 4.5 t GVM) receive a partial credit of approximately 19 c/L, reflecting that they pay a road-user charge via a separate mechanism.
Scale
In FY 2022–23 the scheme cost $7.8 billion in revenue forgone (Campbell, 2024).
For context, $7.8 billion is larger than the entire Commonwealth spend on public hospitals.
Who benefits
| Sector | FTC claimed | Share | Implied diesel (BL) |
|---|---|---|---|
| Mining | $3.5B | 45% | ~7.2 |
| Agriculture, forestry, fishing | $1.3B | 17% | ~2.7 |
| Transport, postal, warehousing | ~$1.0B | 13% | ~2.0 |
| Construction | ~$0.8B | 10% | ~1.6 |
| Other (manufacturing, utilities, defence) | ~$1.2B | 15% | ~2.5 |
| Total | $7.8B | 100% | ~16 |
Source: Australia Institute analysis of ATO data, FY 2022–23 (Campbell, 2024). Implied diesel volumes are author estimates at 48.8 c/L.
Mining dominates. Within mining, coal accounts for approximately 48% of sector diesel use (IEEFA, 2026), implying coal miners alone claim roughly $1.7 billion per year in fuel tax credits. Iron ore and gold are the next largest mining sub-sectors.
Policy significance for electrification
The FTCS is the single largest structural barrier to off-road diesel electrification in Australia:
- It reduces the fuel cost advantage. A mine operator paying $2.00/L retail diesel effectively pays $1.51/L after credits. The saving from switching to electricity drops from ~$1.63/L to ~$1.14/L — a 30% reduction in the incentive to electrify.
- It is regressive by sector. The largest beneficiaries (coal and iron ore miners) are among the most profitable and capital-rich companies in the economy. Small farms receive the same rate but claim far less in absolute terms.
- Reform is politically difficult. Any reduction would be characterised as a “tax on farmers” despite agriculture receiving only 17% of the total. The mining lobby is well-resourced.
What reform might look like
The most commonly discussed options are:
- Phase-down for mining — reduce the credit rate by, say, 10 c/L per year over five years, retaining the full rate for agriculture and small business. This would raise ~$3.5 billion over the phase-down period from mining alone.
- Electrification offset — allow businesses to claim a credit against electricity used in equipment that replaces diesel, creating fiscal neutrality for the switch.
- Carbon-linked reduction — link the credit rate to the Safeguard Mechanism baseline, so facilities already subject to emissions obligations face a declining diesel subsidy.
Data sources
The diesel consumption figures for on-road segments are from the ABS Survey of Motor Vehicle Use, Cat. 9208.0, year ending June 2020 — the most recent (and final) edition of this survey (Australian Bureau of Statistics, 2020). Total national diesel sales of 33,508 ML in 2025 are from the Australian Petroleum Statistics Data Extract, January 2026 (Department of Climate Change, Energy, the Environment and Water, 2026). Off-road estimates (mining, construction, agriculture) are derived from Fuel Tax Credit claims analysed by the Australia Institute (Campbell, 2024) and the IEEFA mining diesel report (IEEFA, 2026).
Vehicle prices are indicative new-vehicle prices current as of early 2026, sourced from manufacturer websites, TruckSales.com.au, Farm Machinery Sales, and CarsGuide. Prices vary significantly by specification, dealer, and state.
References
Footnotes
The ABS SMVU reports 78,300 km/yr for all articulated trucks. Heavy artics (>40t) average higher due to their long-haul role; ~95,000 km/yr is estimated from the diesel consumed (4,040 ML) divided by fleet size (~80,000 vehicles at 53 L/100 km).↩︎
The ABS SMVU reports 5,014 ML of diesel for all light commercial vehicles (utes, vans, cab-chassis). Utes account for approximately 60% of LCV sales and a similar share of diesel consumption, giving ~3,000–3,200 ML.↩︎
The ABS SMVU reports 11,100 km/yr for all passenger vehicles (year ending June 2020, depressed by COVID). Pre-COVID (2018) was 13,400 km/yr. Diesel passenger vehicles (predominantly SUVs used for touring and towing) average higher than the overall passenger fleet; ~15,000 km/yr is estimated.↩︎
The ABS SMVU reports 5,014 ML for all LCVs. Vans account for approximately 35% of the LCV fleet, giving ~1,750–1,800 ML.↩︎
The ABS SMVU reports 78,300 km/yr for all articulated trucks. Lighter artics serving distribution routes average less than the heavy long-haul fleet; ~65,000 km/yr is estimated.↩︎