From Delphi to ASX Futures - It’s still murky
In this note I look mostly at ASX futures. As discussed in the background, futures prices are often set by interest rates and storage costs, but electricity futures should reflect the market’s view. However, I have my doubts. I don’t see much liquidity in the futures market, and the further ahead you look (out to June 2029), the less liquidity there is. If you took futures at face value, electricity prices are expected to remain flat for the next 3-4 years. There is no evidence traders think Eraring will close in that time, and only weak evidence that Yallourn will close. Alternatively, an optimist might say that closing the stations won’t impact prices.
In this note I don’t speculate, ha ha, on the many reasons why players in the futures market might want prices to be high or low, but I think it’s important to understand that the gentailers maintain large trading desks and that generators will operate or not operate to benefit the overall position.
Tell me it ain’t so - nothing changes in the future
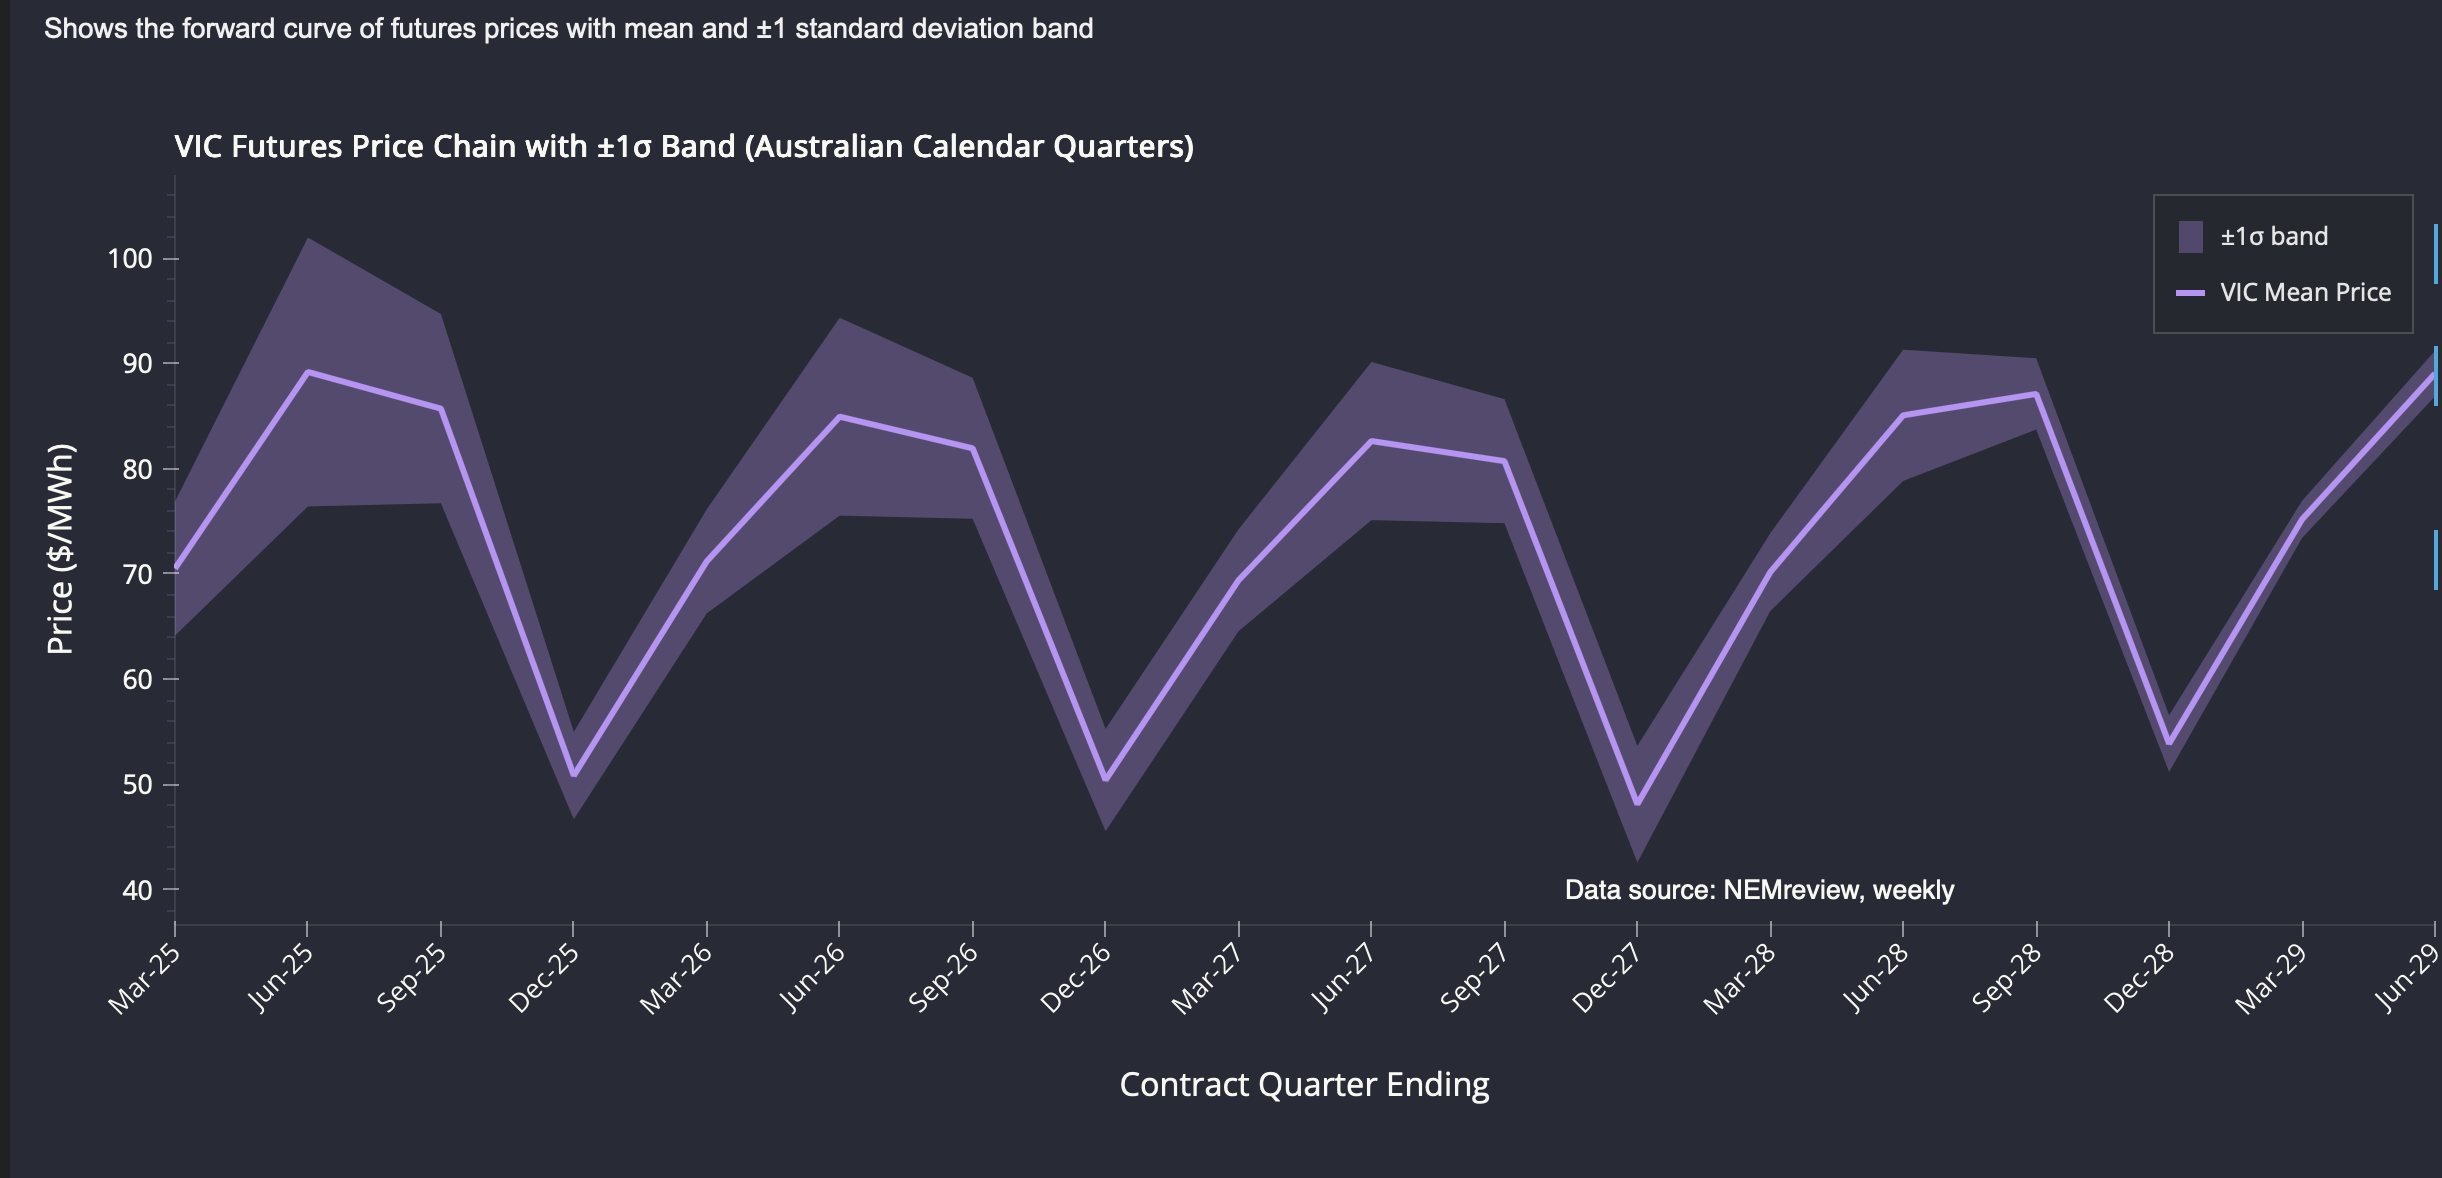
I created several visualizations of futures. The complexity arises because there are many quarters, and each one trades over a couple of years. For this exercise, I’ve chosen a chain view. This takes the mean price at which the future has traded (some have been trading longer than others) and shows the standard deviation of trading around that particular quarter. The best way to think about the standard deviation is that it primarily shows liquidity. The less a future trades, the lower its volatility.
NSW - No sign of Eraring closing, no sign of anything much

NSW futures essentially represent a world where nothing changes. It’s hard for me to think that Eraring could close in 2027 or even 2029 and the electricity price wouldn’t change from what it was historically.
This plot shows trading over the past two years in June quarter futures. June is typically a higher price quarter these days as solar generation is lower. If the market was expecting Eraring to close, you might expect 2028 and 2029 futures to be higher than earlier years, but they aren’t. Not only that, but the price has barely moved for each contract, which seems unlikely. I suppose you could argue that the market did see Eraring closing when prices were being set in May-July 2024, but since then everyone has relaxed. 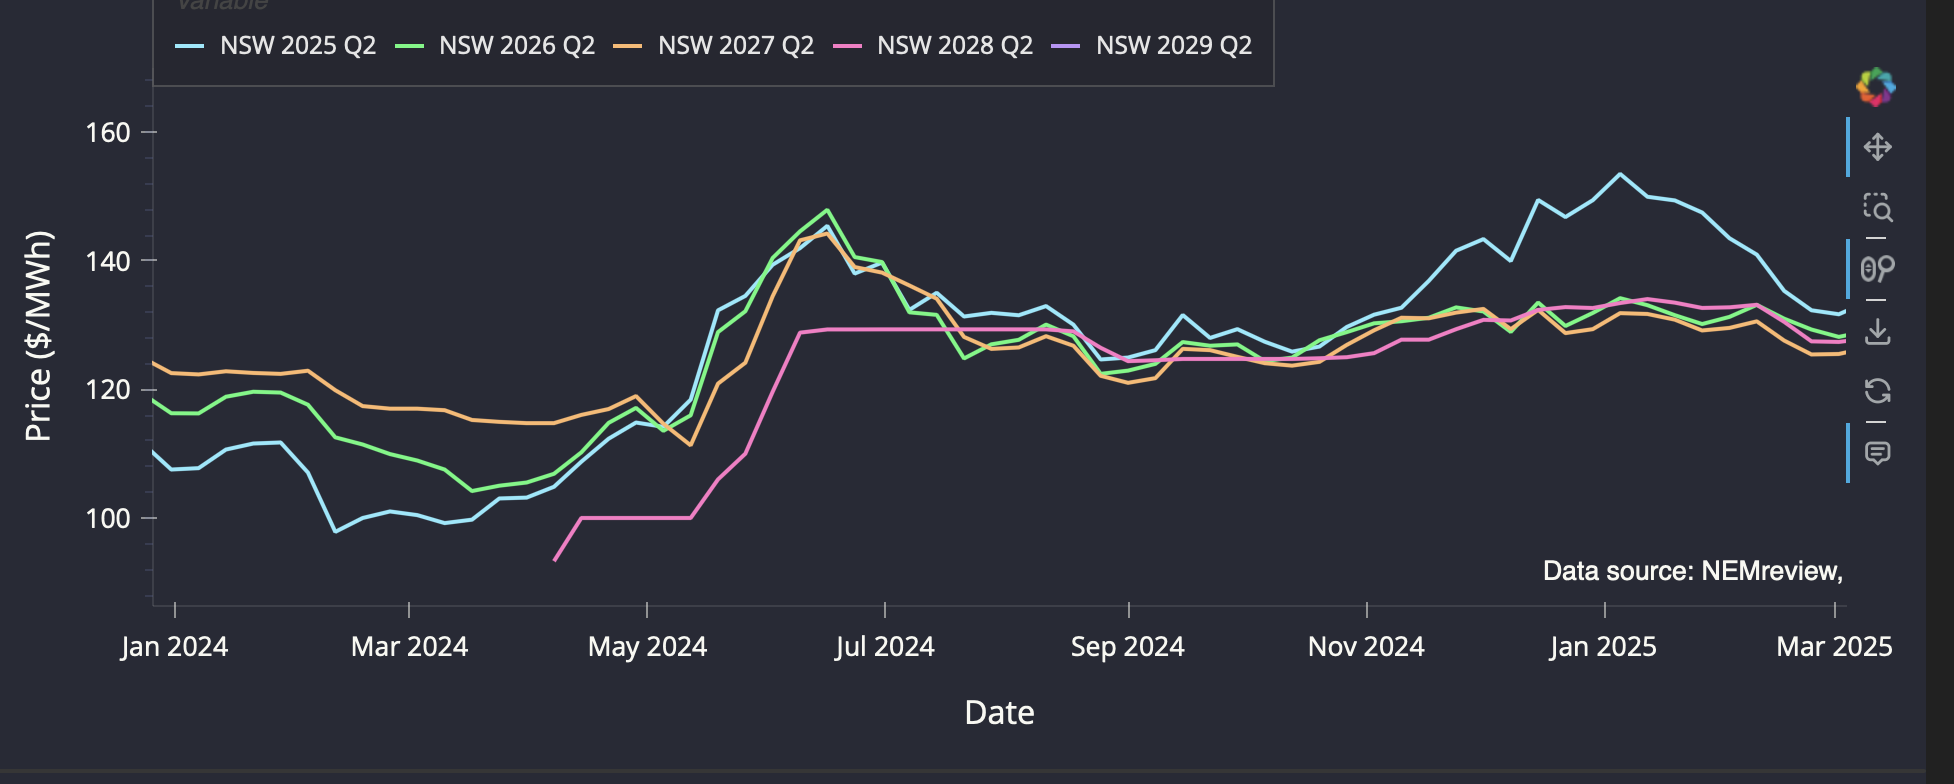
Victoria
Yallourn, which is producing less electricity every year, is due to close in 2028. There are some indications in the Victorian futures that this might happen, although liquidity in 2029 is very low.
Looking at the 2028 June quarter, the price is $90/MWh with some volume traded, and that value has remained relatively constant for a year. 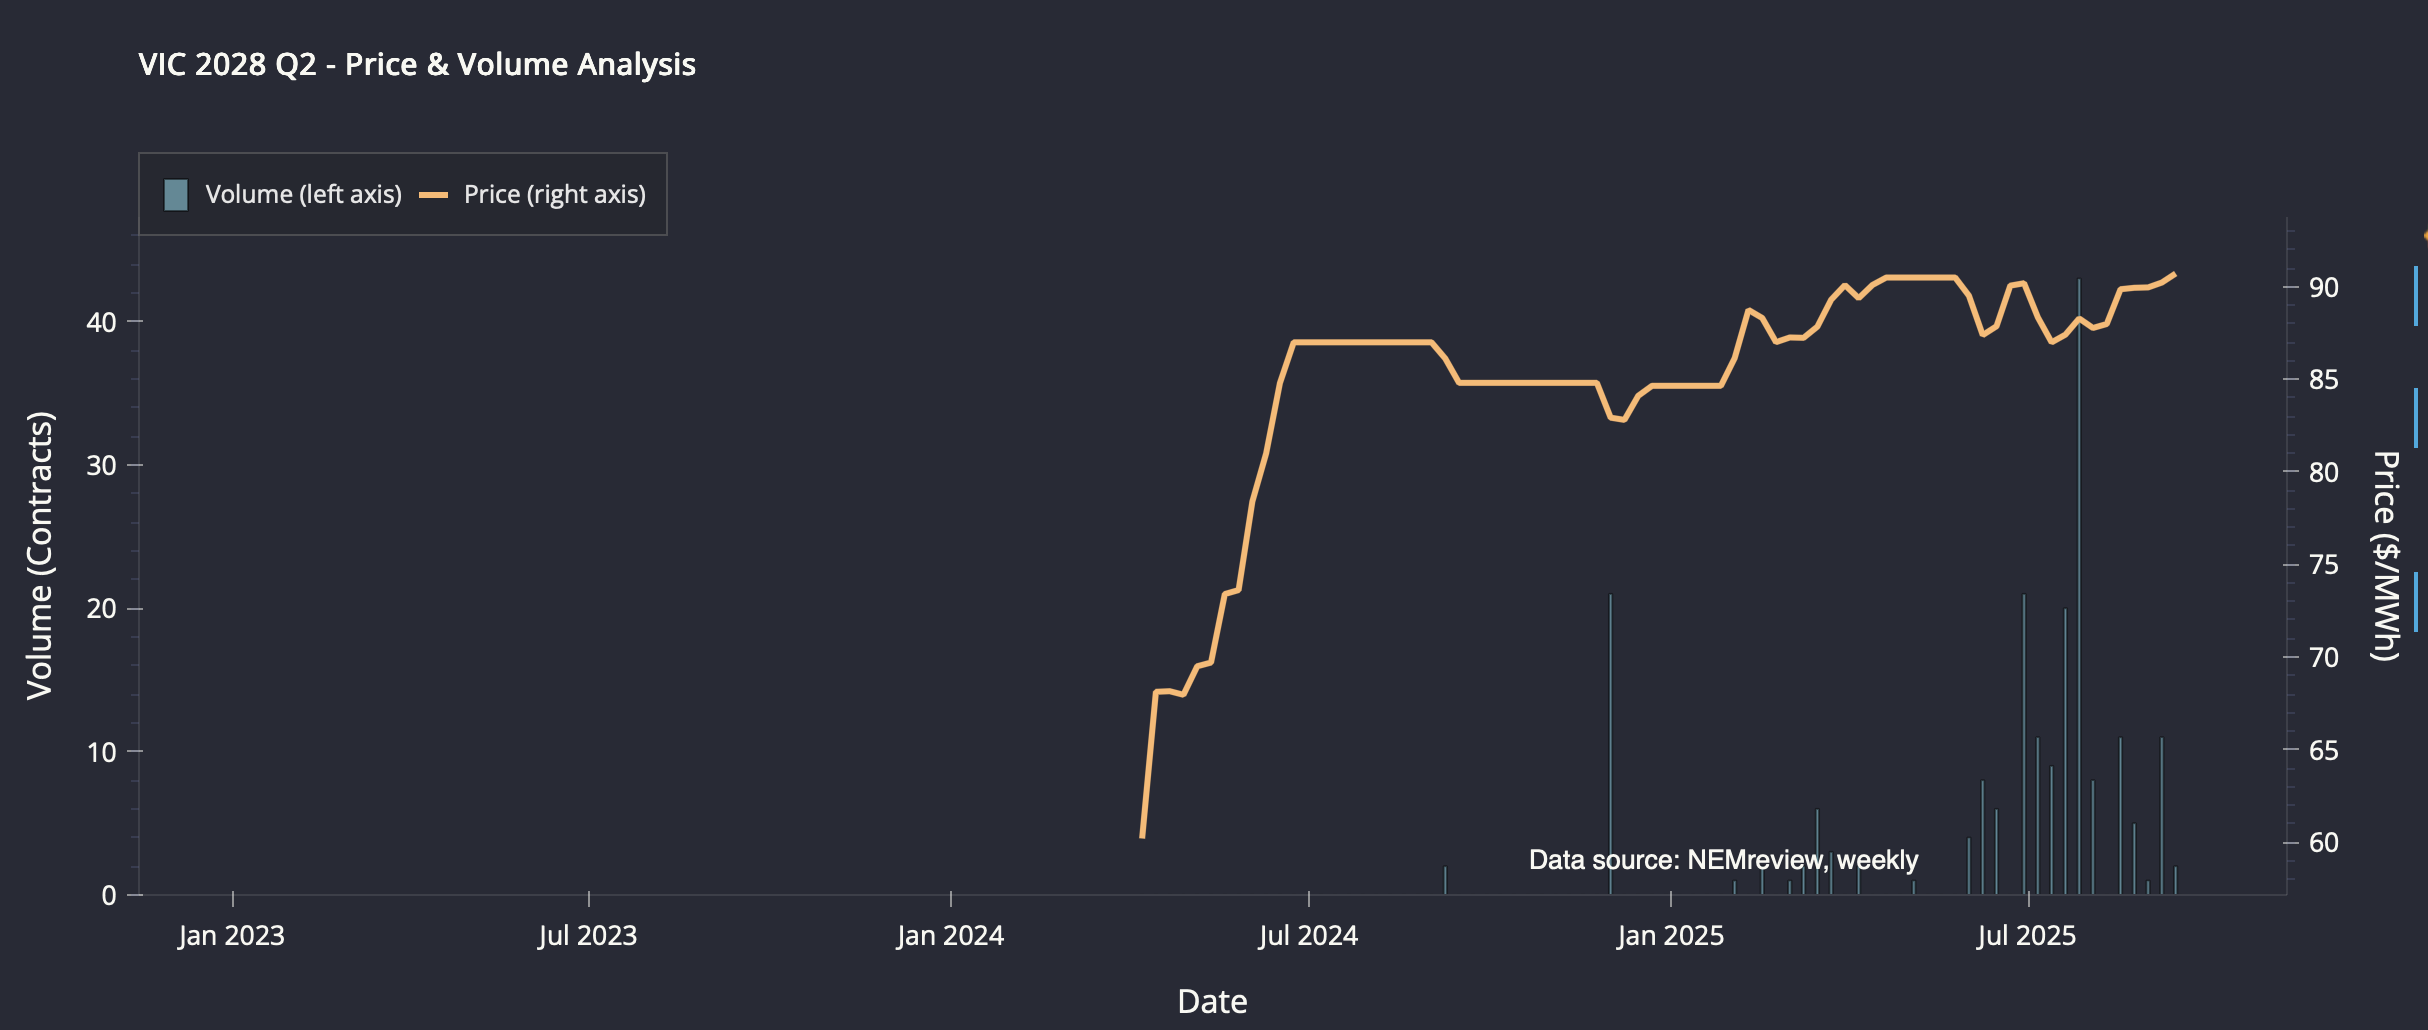
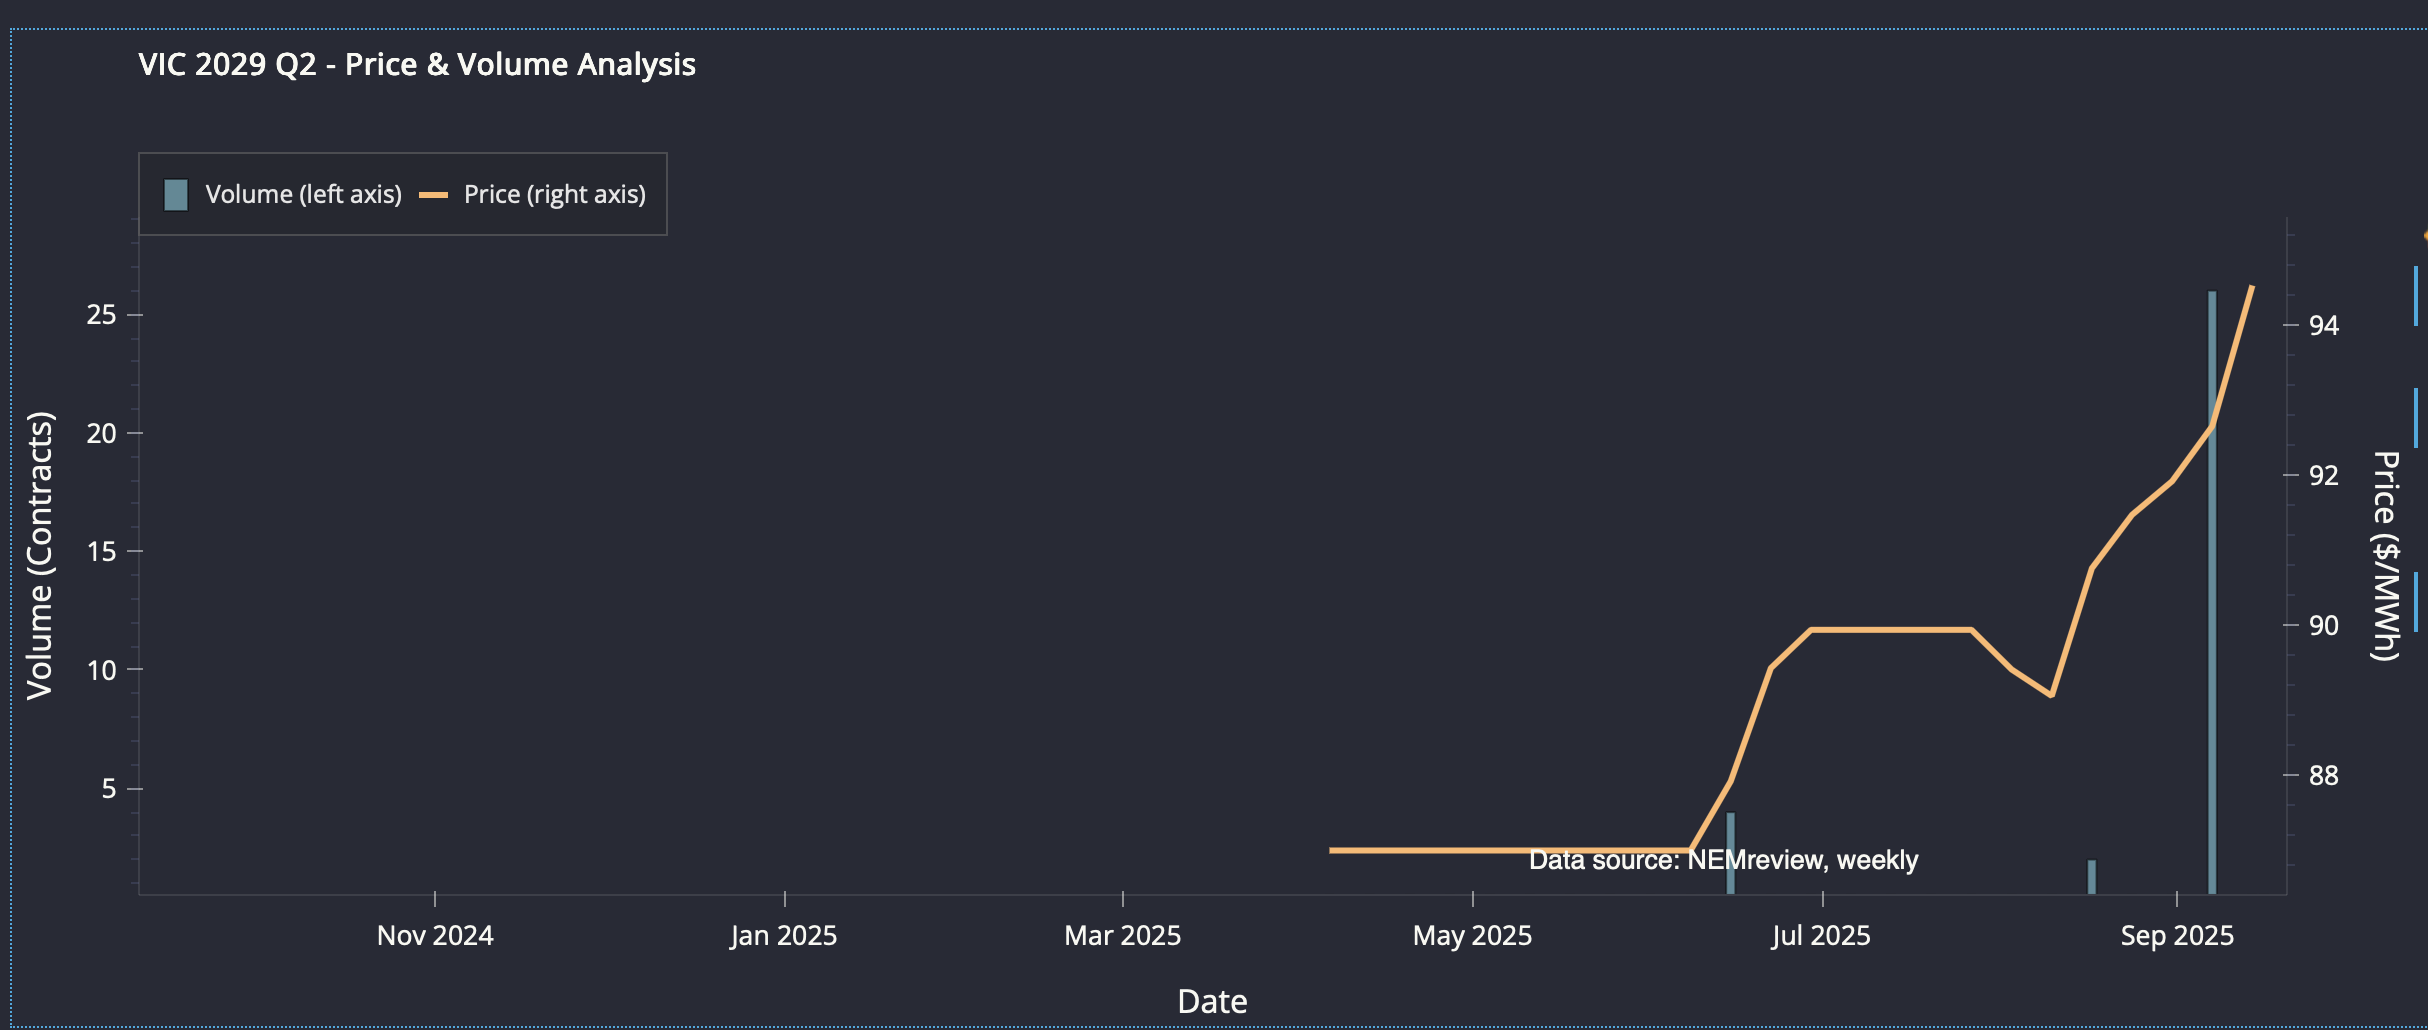
Turning to 2029 Q2, on very thin volume, the price is around $94 at the moment.
Yallourn’s output has been dropping over the past five years, but probably no more than LYB’s. While I never fully trust the data I collect myself, this is what it shows for Yallourn. The table shows the aggregate over five years, not the annual average. 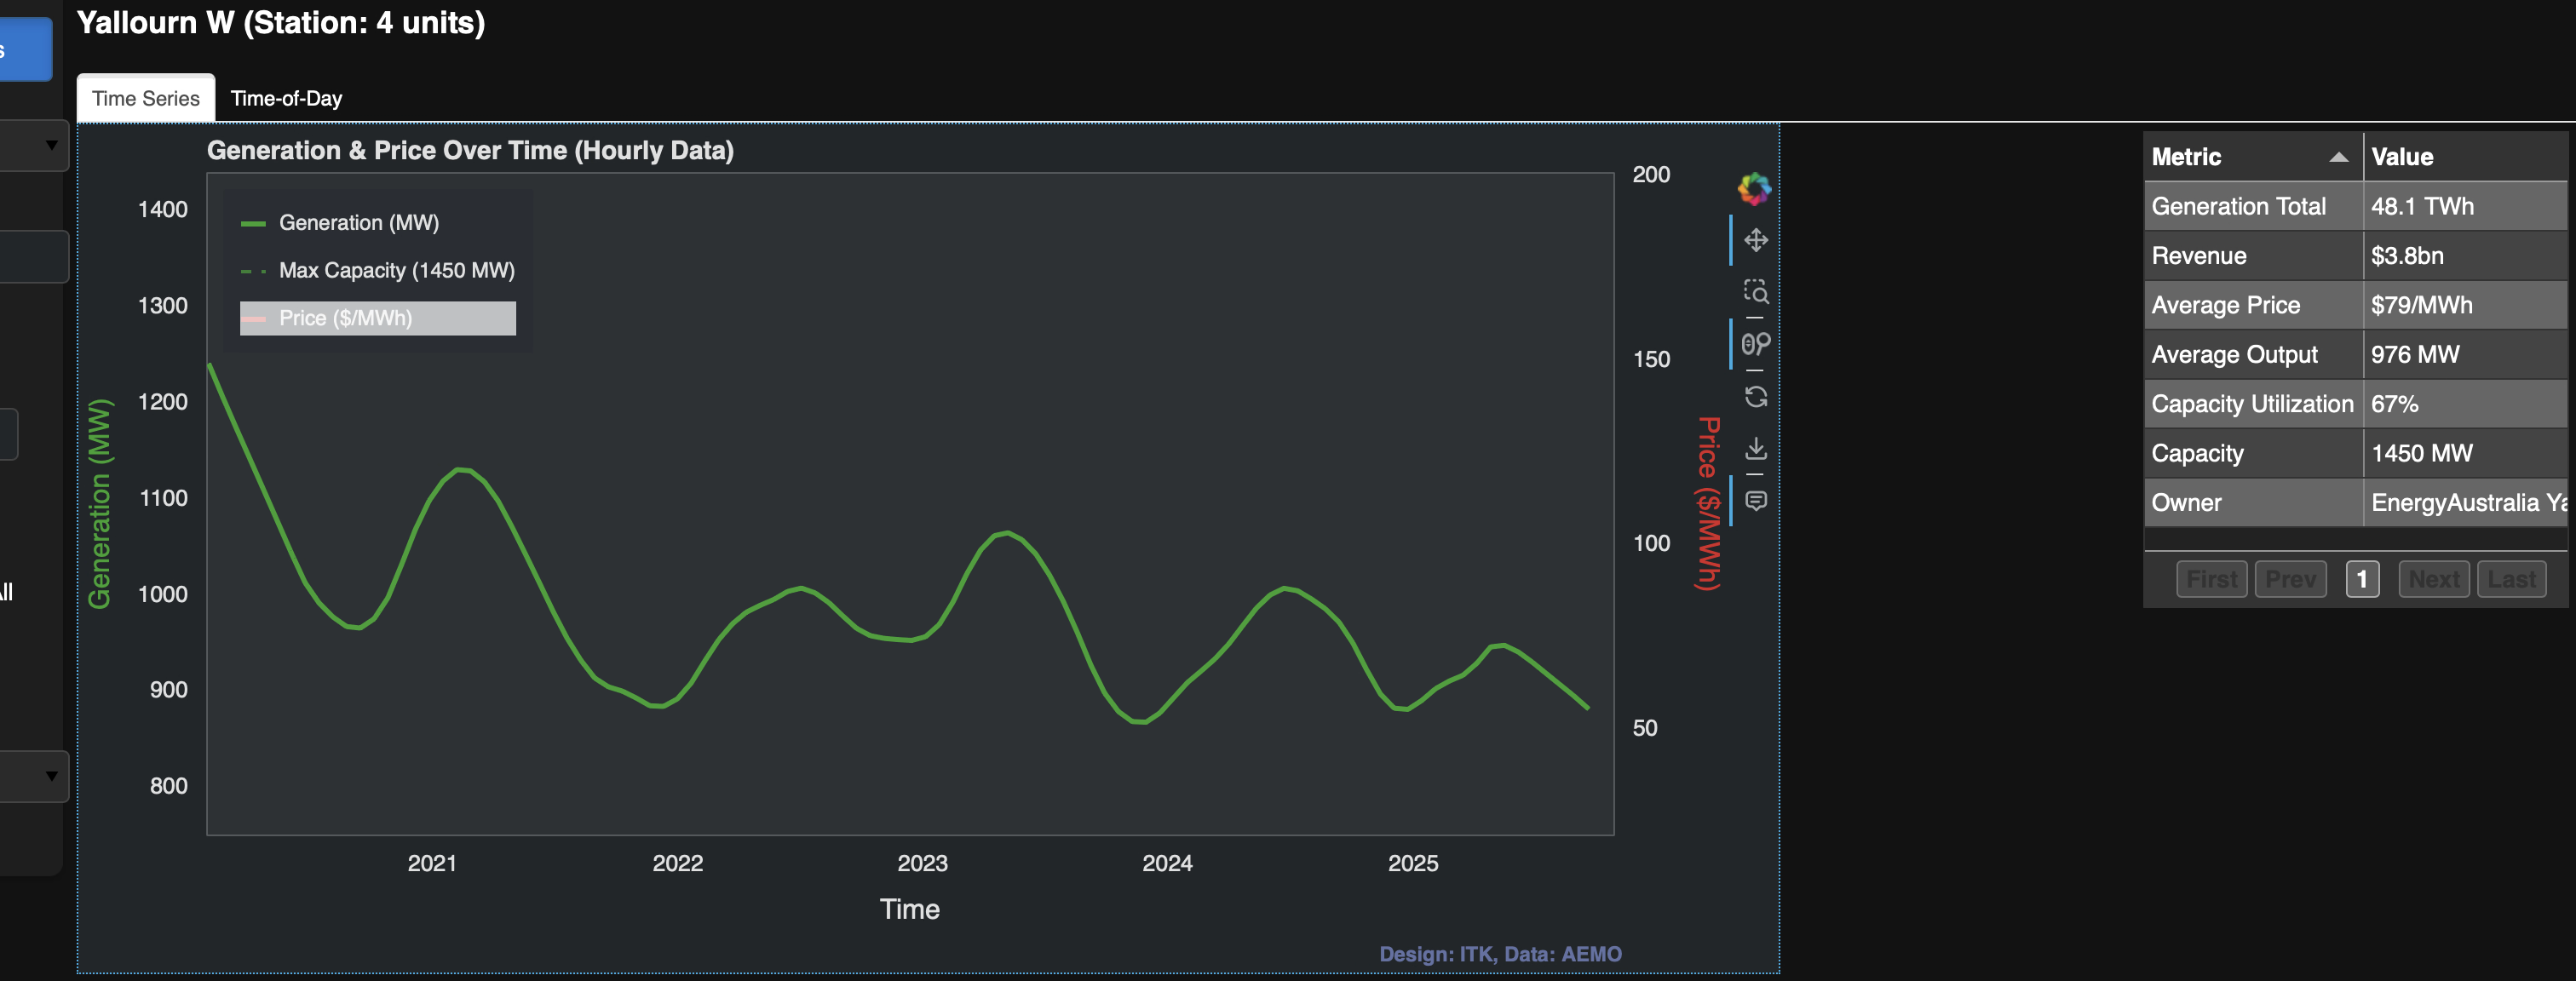
For example, LYB—a plant supposedly running until the 2040s that has to buy coal from LYA mines—shows the following:
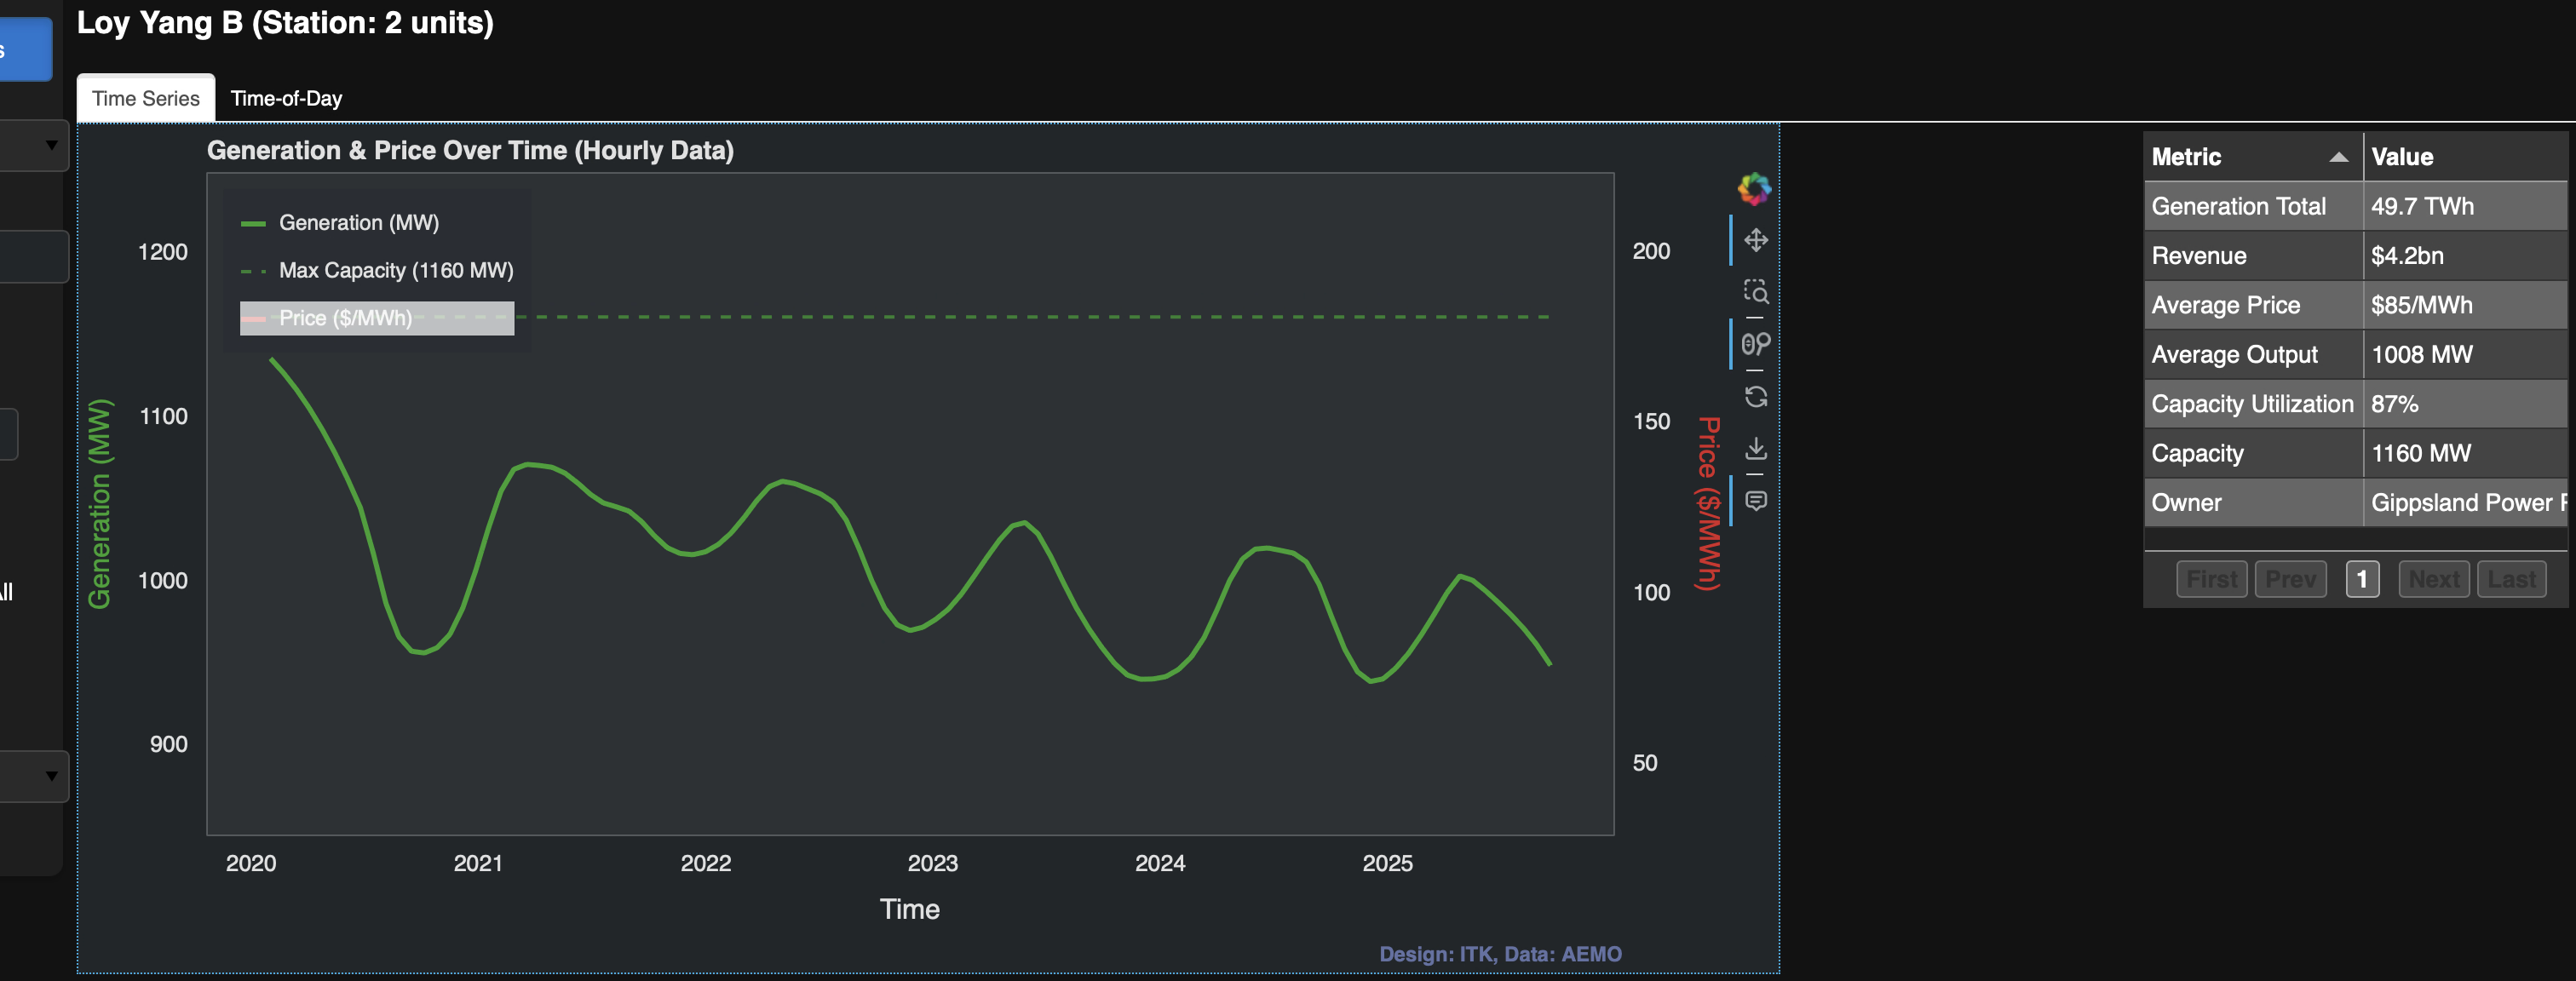
There’s a decline, but the capacity utilization is up at 87% and the average price achieved is $6/MWh higher than Yallourn. I suspect that LYB invested capital to manage ramp-down better than Yallourn, thus avoiding some of the low midday prices that Yallourn captures. But I might be wrong. While this is getting off-topic from futures, here is the LYB time-of-day plot for the last 365 days. 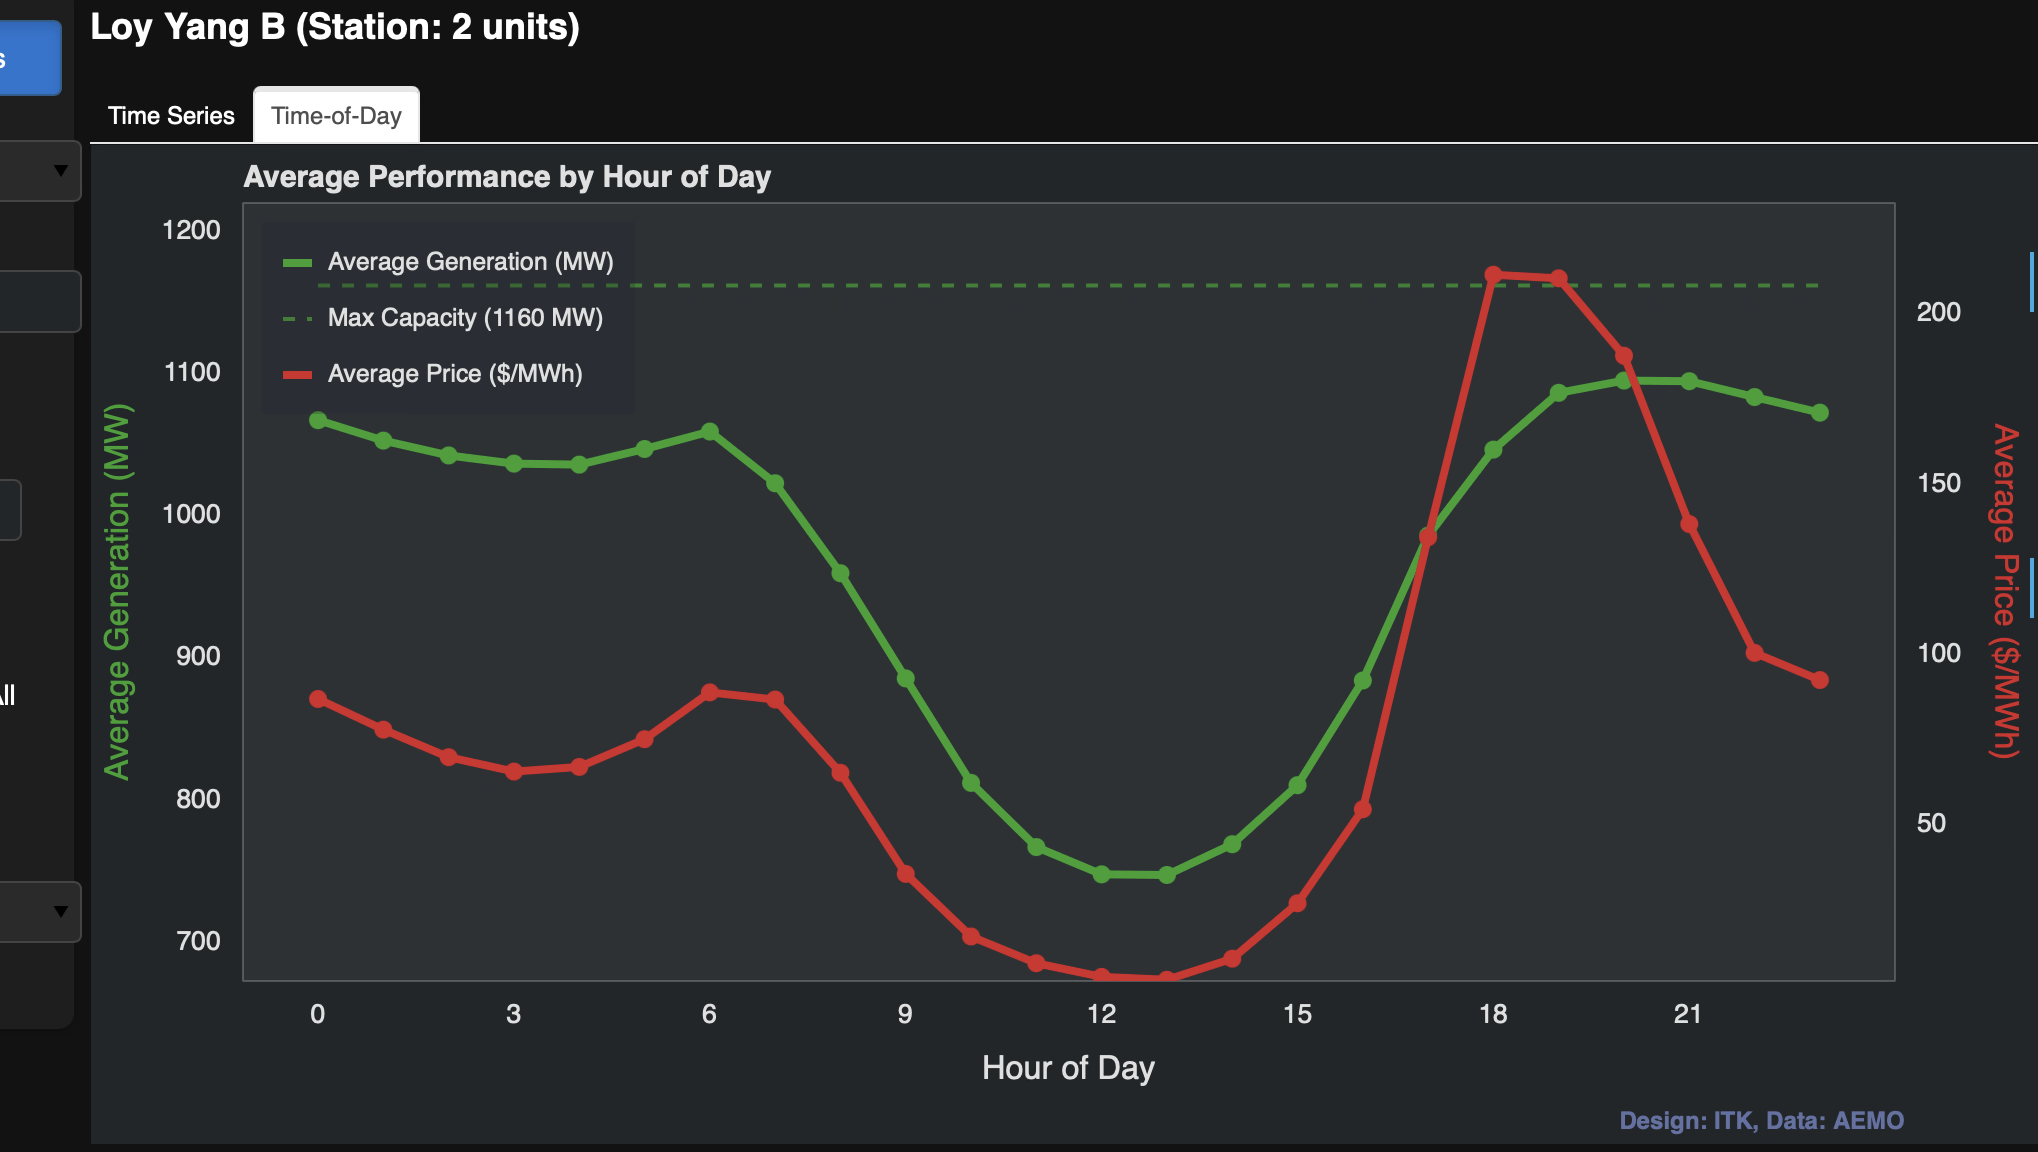
Compare this with the much softer ramp of Yallourn: 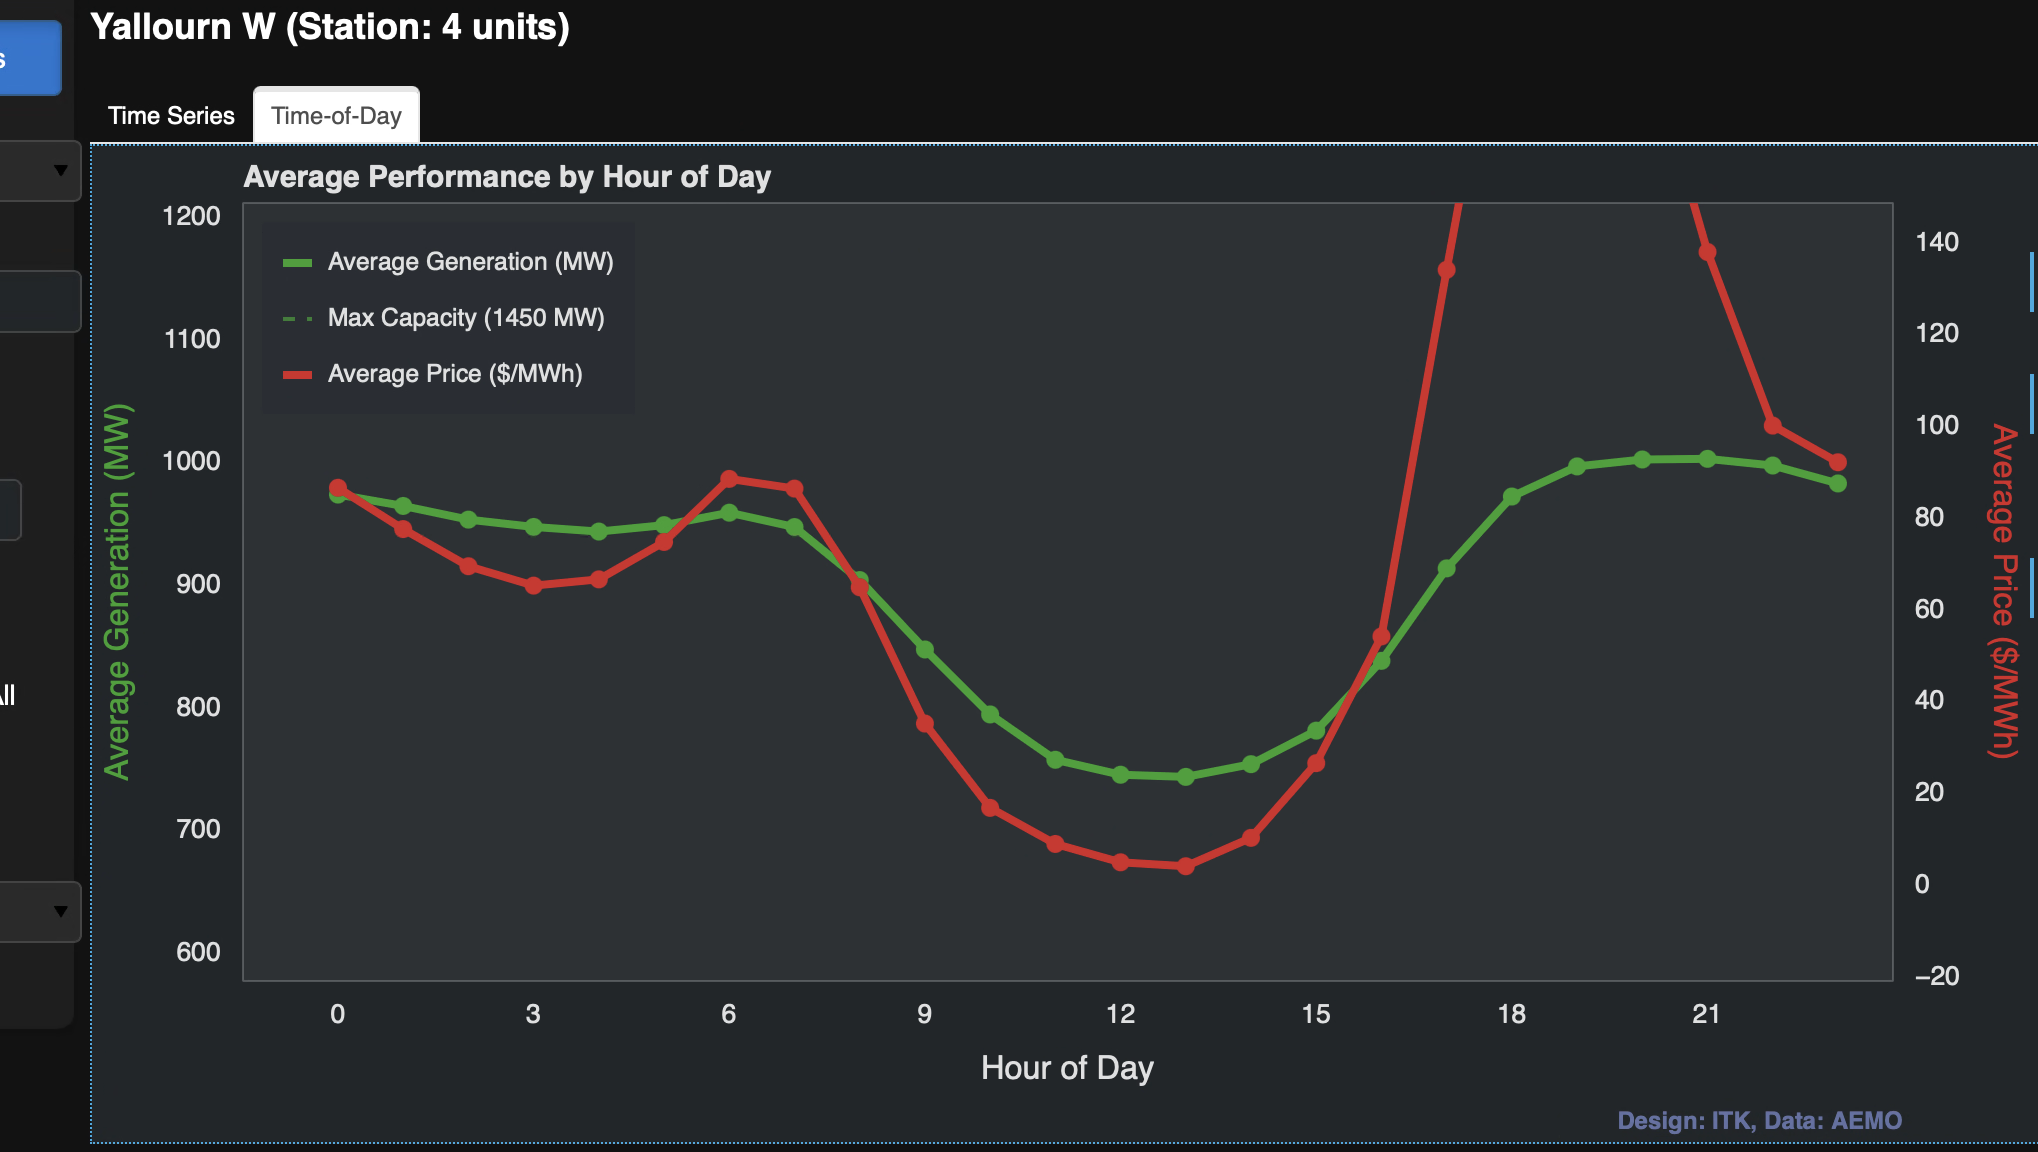
Queensland
Queensland is interesting because its quarterly pricing pattern differs from the Southern States. There is also a gentle downwards trend. The quarterly seasonality surprised me, but looking at the history, there is some support for price spikes around December and January in Queensland. 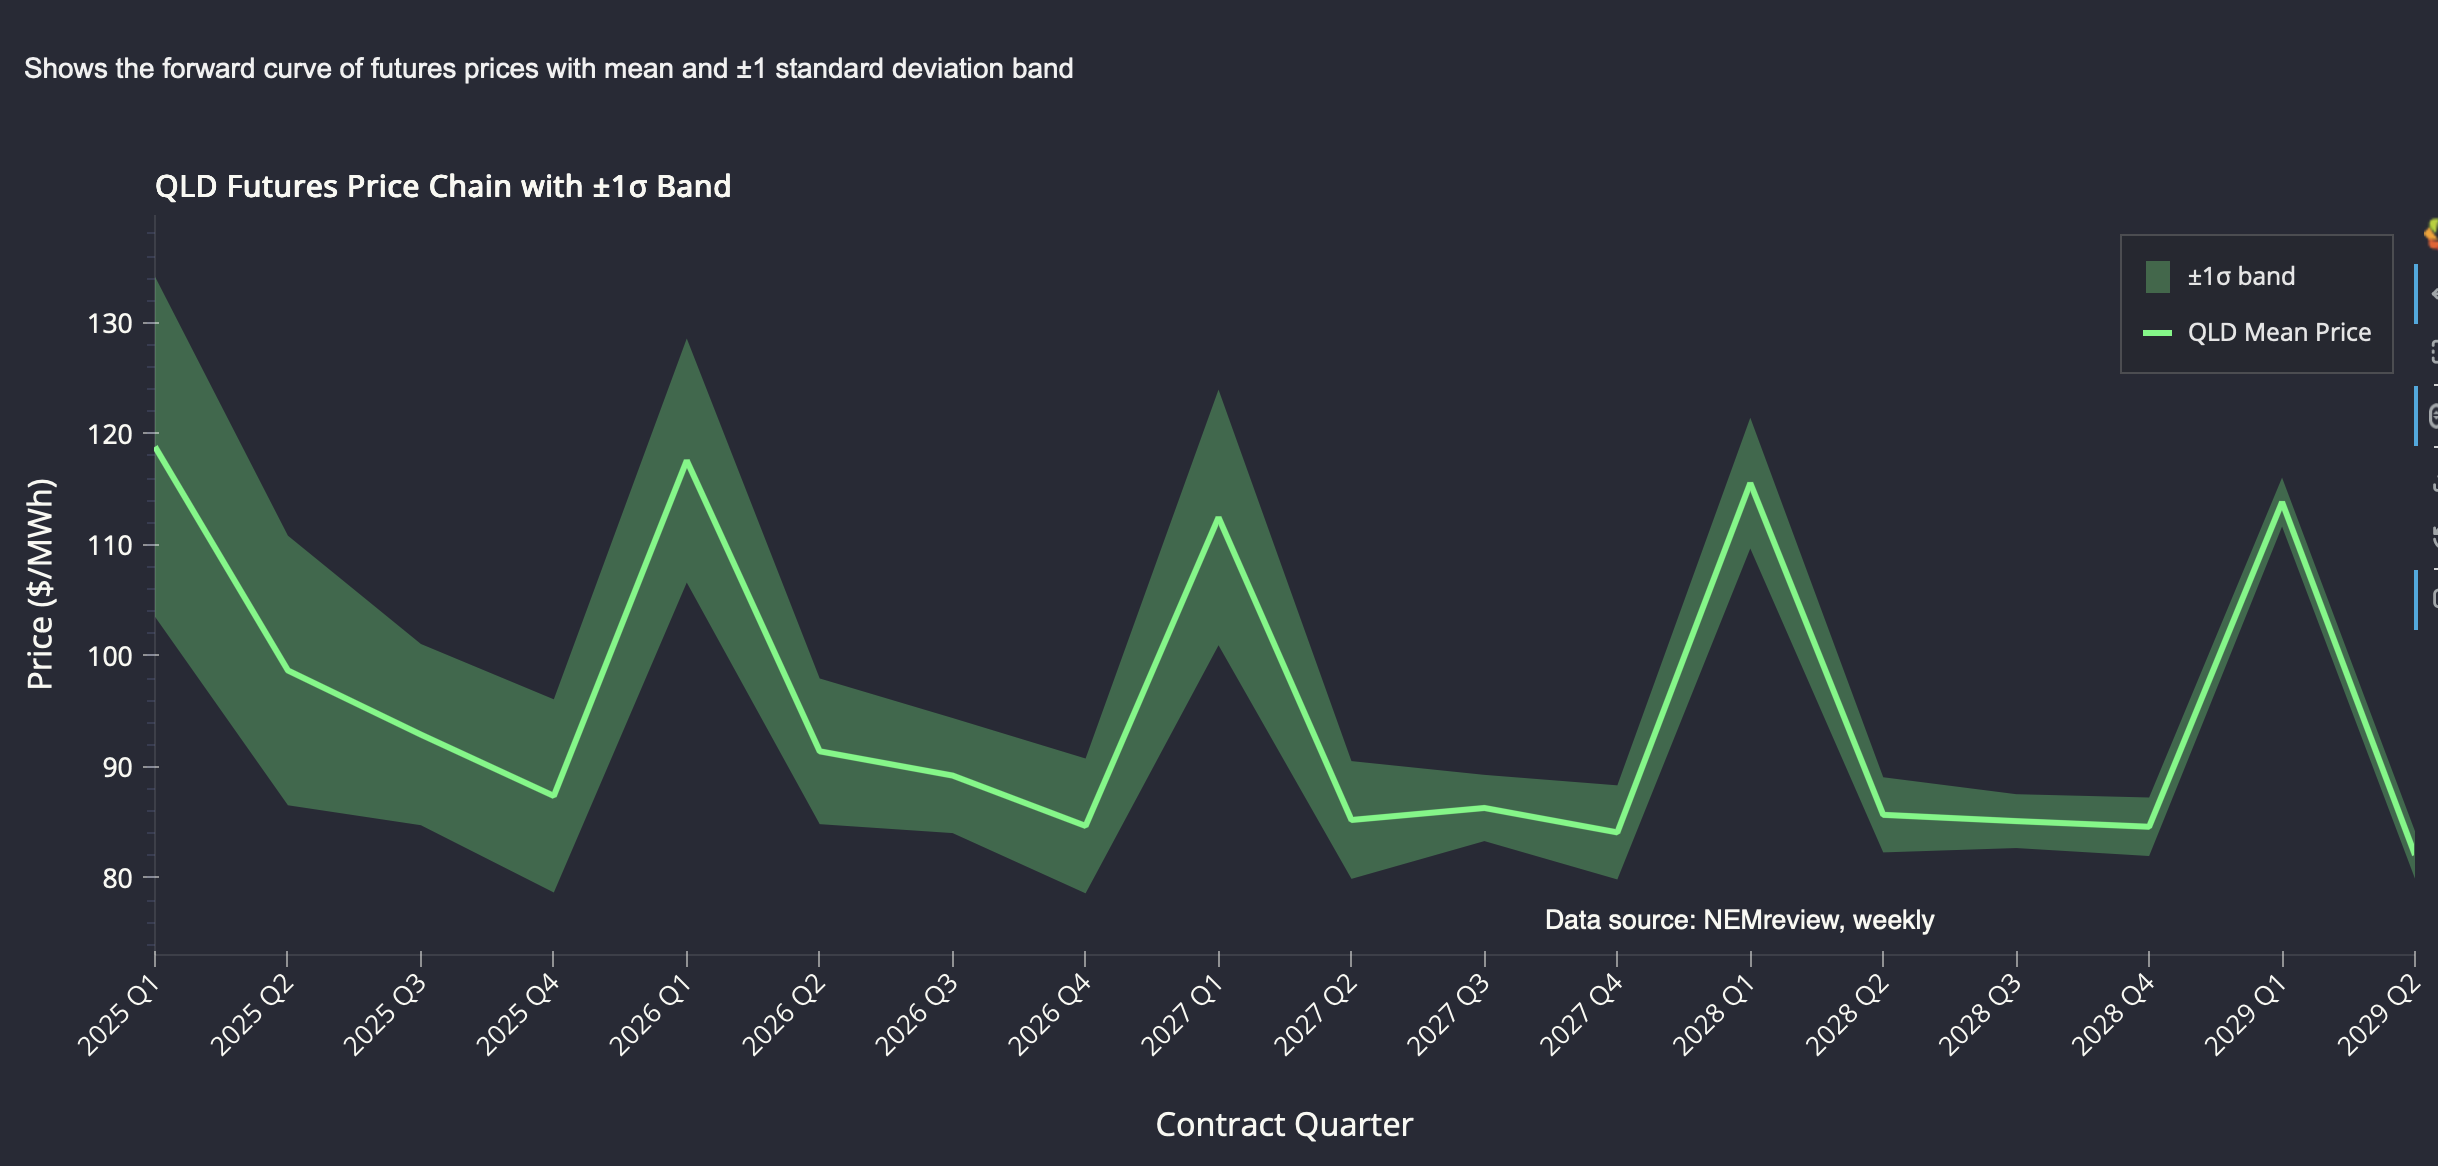
Background
Futures trading is a full-on finance topic, although there are no doubt many fine futures traders who have no background in finance. Traders are born not made, in my experience.
As a reminder:
A futures contract is a legal agreement between two parties to buy or sell something (like oil, wheat, or even a stock index) at a fixed price on a set date in the future. Unlike a simple promise, it’s a standardized contract traded on an exchange, which makes it easier for people to trade and for prices to be clear. Businesses often use futures to protect themselves from sudden price changes (for example, an airline locking in fuel costs), while investors may use them to try to profit from where they think prices are headed.
In this case, we are talking about baseload electricity, which is traded at 1 MW per contract. The contract is for a year or a quarter. In this note I focus on quarters, but I show data for financial years (ending June 30). I construct the FY number as the price average of the four quarters that make up the year. Where I show volumes, FY volumes are the sum of the contracts traded each quarter.
A quarter contains 2160 hours. So if I buy a 1 MW contract at $10 and the flat load spot price over the quarter averages $100/MWh, then I would receive $90 * 2160 = $194K. In fact, ASX futures are settled daily and use mark-to-market margining, but let’s not worry about those details here. I am not really across that stuff myself.
The data I use comes from the outstanding Global Roam datasets. I have used weekly averages for prices and weekly totals for volumes. I could look at open interest but that’s for another day.
Fallacies in futures trading - carry cost
For many commodities, the price shown in a futures contract does not necessarily reflect expectations about the forecast price. The simple reason is that futures are related to spot prices by the costs of carry. Say it’s January and the oil future for February is at $100, while you can buy oil today for $90. If the cost of storing the oil plus the one-month interest cost is less than $10, then that’s a good trade. So the price in one month settles at today’s price plus the carry cost.
If tomorrow the spot price rises, the futures price will rise by slightly more. If the spot price falls, the futures price will also fall, generally by slightly less as the carry cost has reduced.
Contango and backwardation
When futures prices are above spot prices, the industry term is contango. That’s what I think of as the natural state of affairs because of the carry cost.
However, if for some reason people want their oil or wool today and don’t care about the future, then the spot price is above the futures price and the market is said to be in backwardation. Keynes apparently believed that producers want to hedge by selling futures, but only speculators would be buyers, and they would demand a reward to buy. Thus, the natural state of affairs was backwardation.
Electricity has no carry cost so not a traditional future
Because electricity isn’t generally stored for three months (although one day it might be), electricity baseload futures may not be priced the same way as most commodities.
One academic article as far back as 2008 said:
The forward curve mainly reflects expectations (seasonality, fuel & carbon costs, hydrology, outages) plus hedging pressure/risk premia from retailers (natural longs) and generators (natural shorts). Expect it to track expected average spot for the delivery period, with a premium/discount that moves with spike risk and demand uncertainty.
But since 2008, there has been much more gentailer vertical integration. Independent retailers hold less than 30% of the market, and direct PPAs with large users like aluminium smelters mean that demand for this type of hedging in Australia is low.