In brief
QLD is where the new renewable action is right now. It is doing far more than the rest of the NEM put together, or so it seems.
The new wind and solar in QLD together with the questionable return of Callide C will surely bring electricity prices in QLD down, but maybe not before the next election. The next Govt will get the benefit.
The benefits of building the new wind and solar will be lost if Queensland persists with its overly expensive and unnecessary long duration pumped hydro.
The epiphany for me in the past year is that its much better to manage storage with power rather than duration. You can configure 2 widgets of 100 MW/4 hour as a widget of 50 MW/16 hours if you choose, but you can’t configure a 50 MW/16 hour widget as 200 MW/4 hours. The thing about long duration storage is it takes a long time to recharge. Therefore the brief intervals of say wind or sun during a wind and solar drought can’t be used as effectively in low power sites as in more flexible high power sites. Its better to have lots of power maybe with less duration spread all over the grid than big centralised long duration systems. Or at least that’s how it looks to me and its what AEMO modelled as the low cost outcome. The backstop can be gas, but good teams don’t need a backstop and not much gas will be needed if its done properly.
In any event the total amount of storage needed and the duration can be greatly reduced by building more wind rather than more solar. QLD and NSW should be partners in their efforts to decarbonise. Rather than thinking about the NSW/Victorian relationship strengthening the links between NSW and QLD “should” would greatly advantage the citizens of both States.
QLD is cracking on with the job
QLD Govt owned entities have committed PPA support to over 3.5 GW of QLD wind in the past 12 – 18 months.
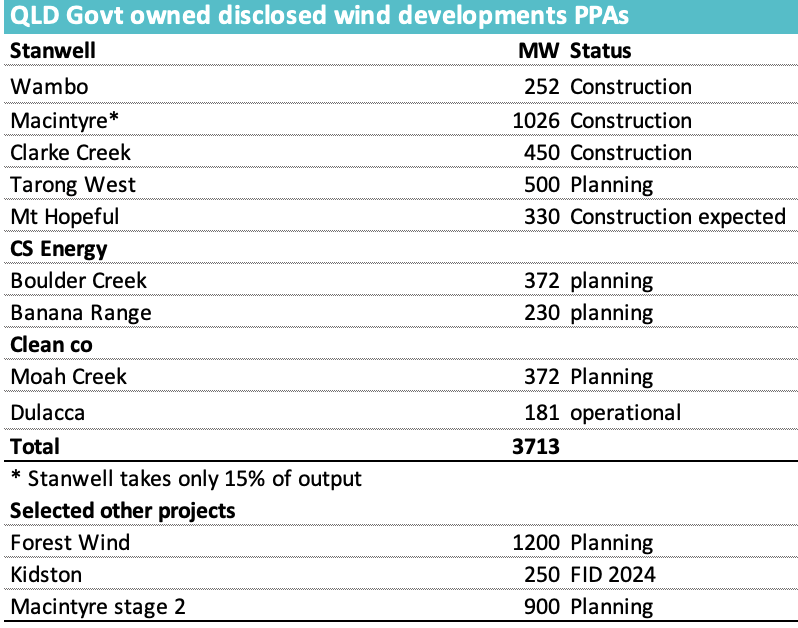
Figure 1 Source: Company
Notwithstanding the problems at Clarke Creek where the new owners are still a bit wet behind the ears construction is cracking on. In particular Acciona is demonstrating how to develop large scale wind at the Macintyre site. Dulacca wind farm was built without too many issues..
In general over my career Queensland has always been the place to go if you want to get something done. If you want to spend most of your life managing social license, planning and dealing with labour issues then by all means do development in Victoria. You might end up famous and will certainly get lots of media attention. These days NSW is nearly as tough as Victoria.
QLD is the future of the NEM
Its obvious that QLD has fantastic solar resources, but no matter how often I say it, it bears repeating that QLD has excellent wind resources. By that I don’t just mean that QLD wind has good capacity factors, it does, or often has transmission access, it does in the CSG areas where the transmission network was rebuilt without any drama whatsoever, about 10 years ago.
No the real value of QLD wind is its ability to be paired with NSW wind to reduce the need for firming. Unfortunately this is one of the areas where I’m not sure the QLD Govt, always parochial, actually gets it. Not invented here, or in this case, not built here, can be damaging just as no development can be damaging.
And the great advantage of coupling QLD and NSW wind (and the solar resource of both) is it reduces the need for firming. Why should Queenslanders care about that?
Queensland can’t afford giant pumped hydro projects
For the renewable energy transition to be successful it has to achieve two goals as well as decarbonisation. They are to keep the lights on and to keep the price reasonable. And of course it would be helpful to turn it into a winning political strategy
From what I can see of the Qld opposition at the moment energy is not the focus but the question is can “Jobs and Energy” be a positive. Unfortunately to stand any chance of being a winner no changes of course can be permitted. So in essence even in the unlikely case that every word I write in this note is completely accurate it doesn’t matter. The die is cast.
In the early romantic, frontier years of the transition we all focussed on the LCOE (price that would accept) of wind and solar. That price was (1) coming down every year and (2) clearly lower than the cost of new thermal supply.
Now however as we move from 30% wind and solar across the NEM to 60% and then 90% its become even more obvious that we also have to focus in the cost of transmission and the cost of firming.
I don’t want to speak about transmission here other than to say, really its been demonised. In what world do you find Barnaby Joyce and Bob Brown of one mind,? It’s the world where above ground transmission is demonised as an environmental disaster. Bob Brown may do it out of genuine belief and lifelong commitment and Barnaby Joyce does it out of near term, cynical I’ll do anything for a vote but the result is the same. A transmission line does not mean the end of the Australian way of life. Anyhow rant over.
No what needs to be discussed is the cost of long duration pumped hydro.
Jobs and Energy plan – resulting electricity price
One way to think about electricity prices is to do an NPV calculation on the system. That is add up the capital cost of the assets, estimate the operating cost, forecast the volume and then find a price that makes the whole thing acceptable to a capital provider.
In the case of the QLD Energy and Jobs plan, and wrongly putting to one side, the contribution of behind the meter, what we have is, 25 GW of wind and solar, 7 GW/24 hour pumped hydro and some transmission to string it together.
Looking at those assets:
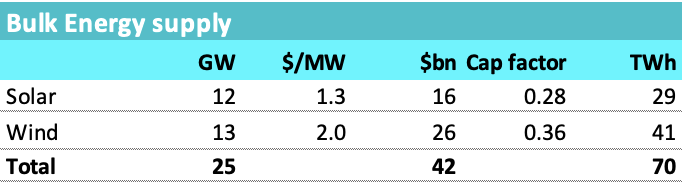
Figure 2 QLD plan, bulk energy. Source: Govt, ITK
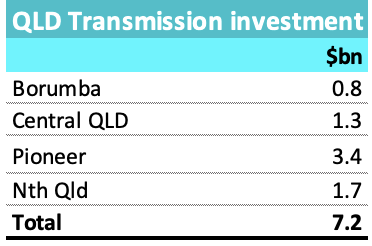
Figure 3 QLD plan, transmission: Source: Govt
Even if that transmission is a significant underestimate it doesn’t change the overall picture but the pumped hydro does.
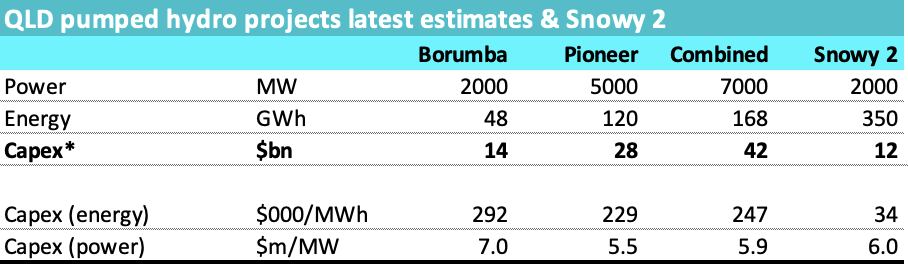
Figure 4 Govt pumped hydro. Source: Govt, company, ITK
AEMO has vastly increased its estimate of pumped hydro costs over the past few years and even so estimates just 4 $m/MW or just 57% of the pre starting estimated Borumba cost. The biggest item in a list of big items is the Pioneer/Burdekin projects. I have just read the cost through from Borumba. In all honesty it’s a complete unknown as to whether Pioneer will be built or what it would actually cost, it’s a decade away from being built even in the “plan”. Nevertheless it is in the plan and therefore its modelled here.
The historic model for “firming” plant is the gas open cycle “peaker”. It has a capital cost of around $1 m/MW plus an operating cost of maybe $100/MWh more or less. The idea was that the high operating cost could be tolerate due to low capacity factors. The peaker would cover its cost of capital by selling “caps” to retailers and would earn roughly $15/MW x hours in year = $131 k in revenue less the cost of actually operating when the cap price ($300/MWh) was exceeded. In addition the peaker could operate between its operating cost and the cap price for its own benefit.
Clearly that is not the main model of a 24 hour pumped hydro project. Were it to sell $15 caps on 2000 MW revenue is $262 m per year or a yield of less than 2%
Adding up the capex on an “overnight” basis:
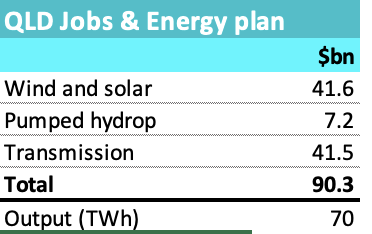
Figure 5 Jobs & Energy capex: Source: ITK
This total does not include anything for the existing gas assets which will also need to earn a return and contribute a small amount of output.
Also the approach of big long duration pumped hydro is at odds with how the ISP modelled outcomes across the NEM and in QLD.
Nevertheless putting the numbers into a very simple NPV spread sheet and assuming that reinvestment = depreciation I get around $120/MWh for a 7% IRR.

Figure 6 QLD plan, IRR. Source: ITK
I don’t show the IRR (Internal rate of return) working but 69 TWh at $120/MWh is $8.3 bn and knock off say $1bn of opex so $7 bn of ebitda compared $94 bn of capital cost = Ebitda multiple of say 13 which is in my professional opinion a typical back of the envelope outcomel.
You could argue that you don’t need 69 TWh once you include rooftop outpu but on AEMO’s demand growth forecasts you will in fact need more energy post 2035 than the system will provide.
Its only the firming part where savings can be made. You need roughly 25 GW of wind and solar and nothing the QLD Govt does will change that cost or the associated transmission by much.
QLD modelling – with and without NSW. TL;DR
As stated above NSW and QLD wind are poorly and in some cases negatively correlated. This means that when wind is not blowing in a QLD zone it is more likely to be blowing in a NSW zone and vice versa. In short by combing NSW and QLD wind you get a higher average output for any given number of MW. You can see this in the following correlation heat map.
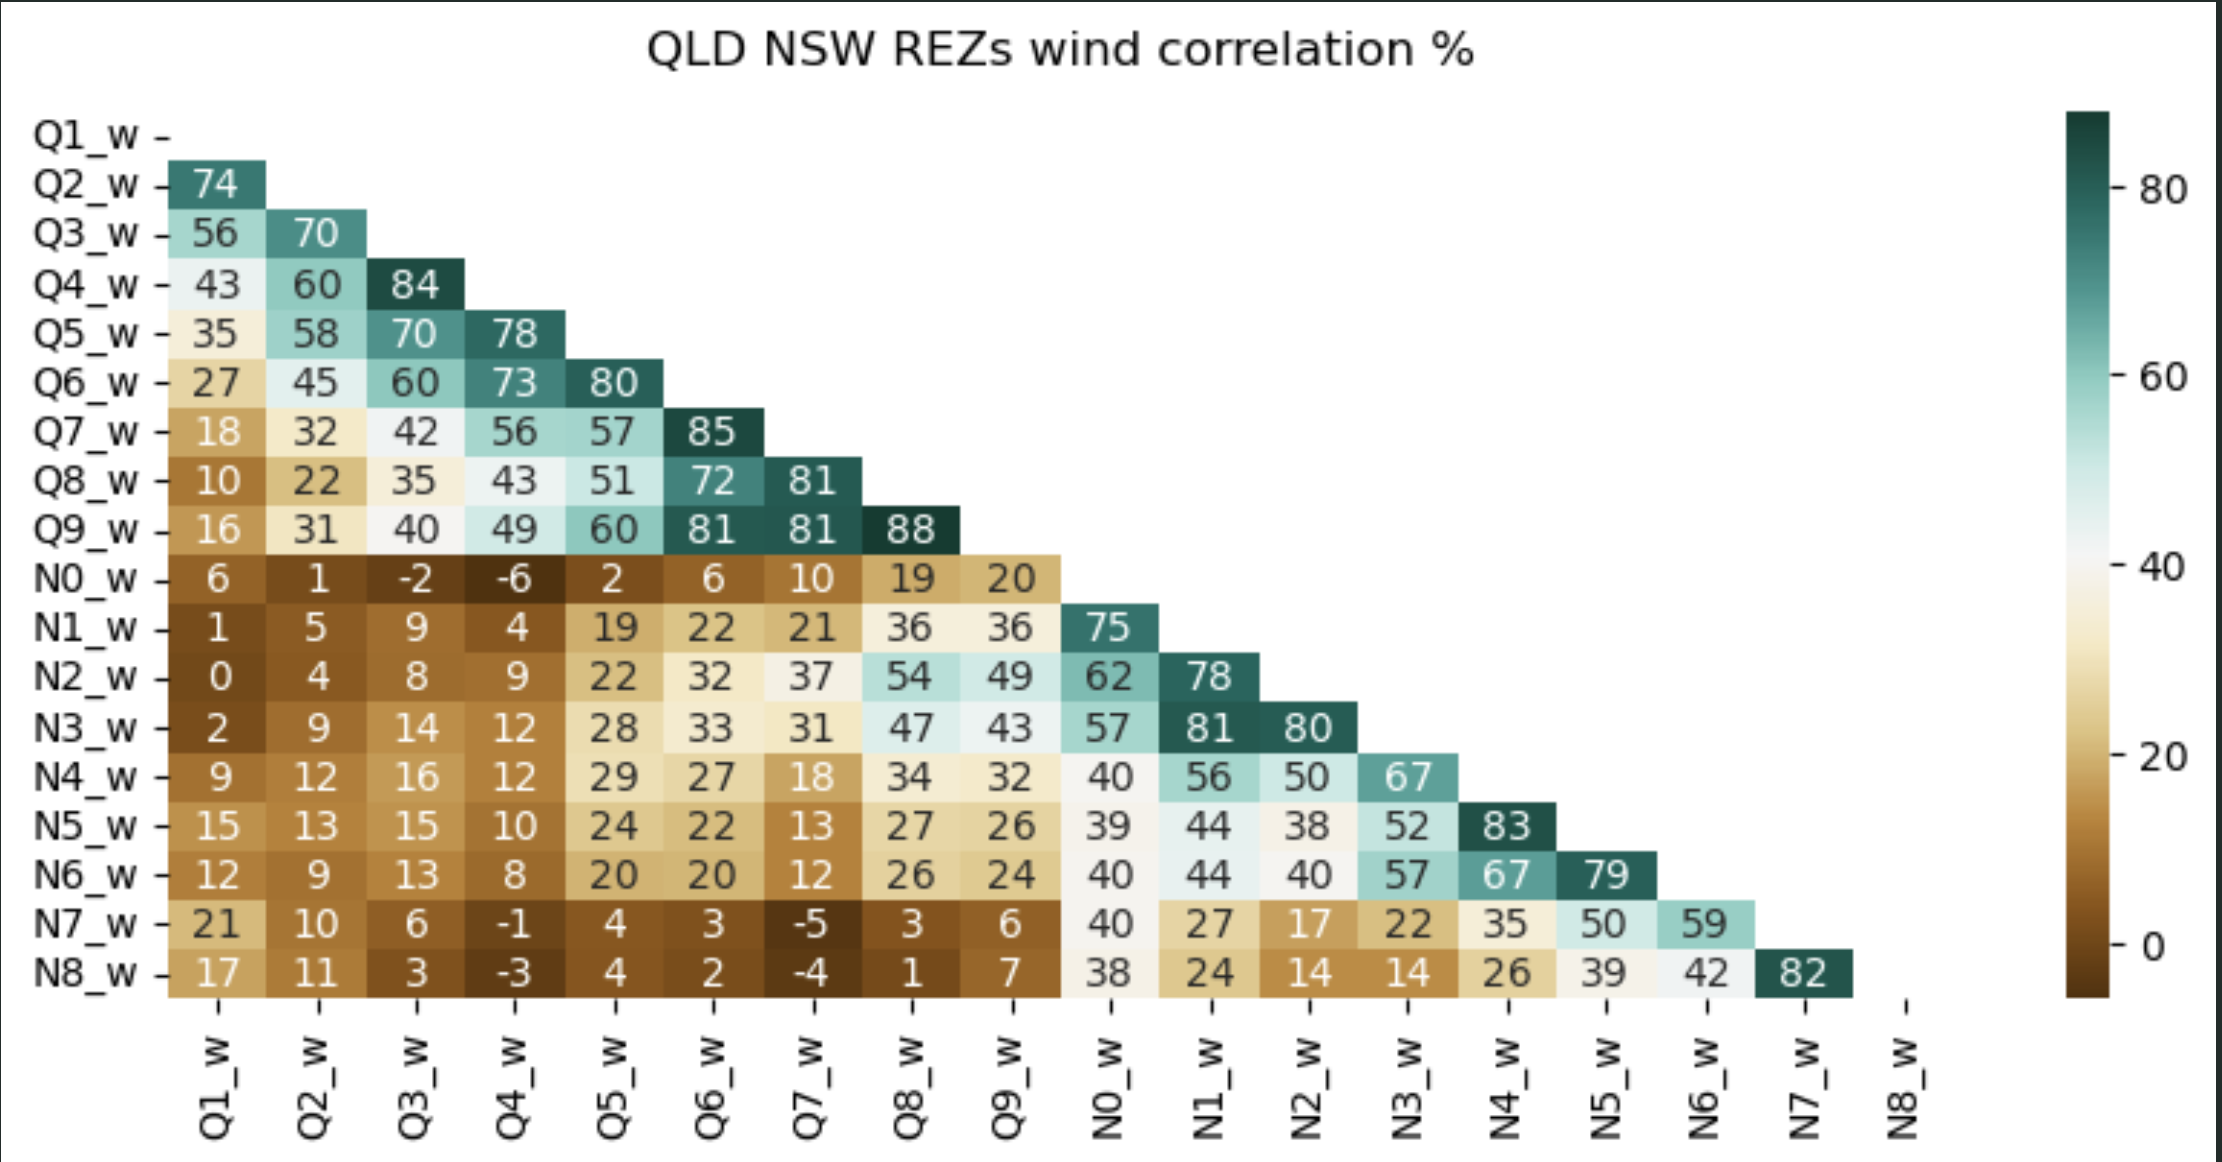
Figure 7 NSW and QLD wind make a great pairing. Source: ISP data
The brown areas show the correlation of NSW and QLD wind zones, the green are QLD compared to other QLD or NSW compared to other NSW.
However some QLD and NSW zones have other issues, like being in sensitive areas, or far away from demand so the correlation can’t be considered as anything more than a starting point.
In any case taking the Qld Jobs and Energy program with 13 GW of wind, 12 GW of utility solar, plus AEMO’s forecast of behind the meter solar, AEMO’s forecast of demand, and using the 2030-2035 window (when forecast output is just a bit higher than forecast demand (inlduding a 1 GW of hydrogen demand)) I get the following average time of day graph.
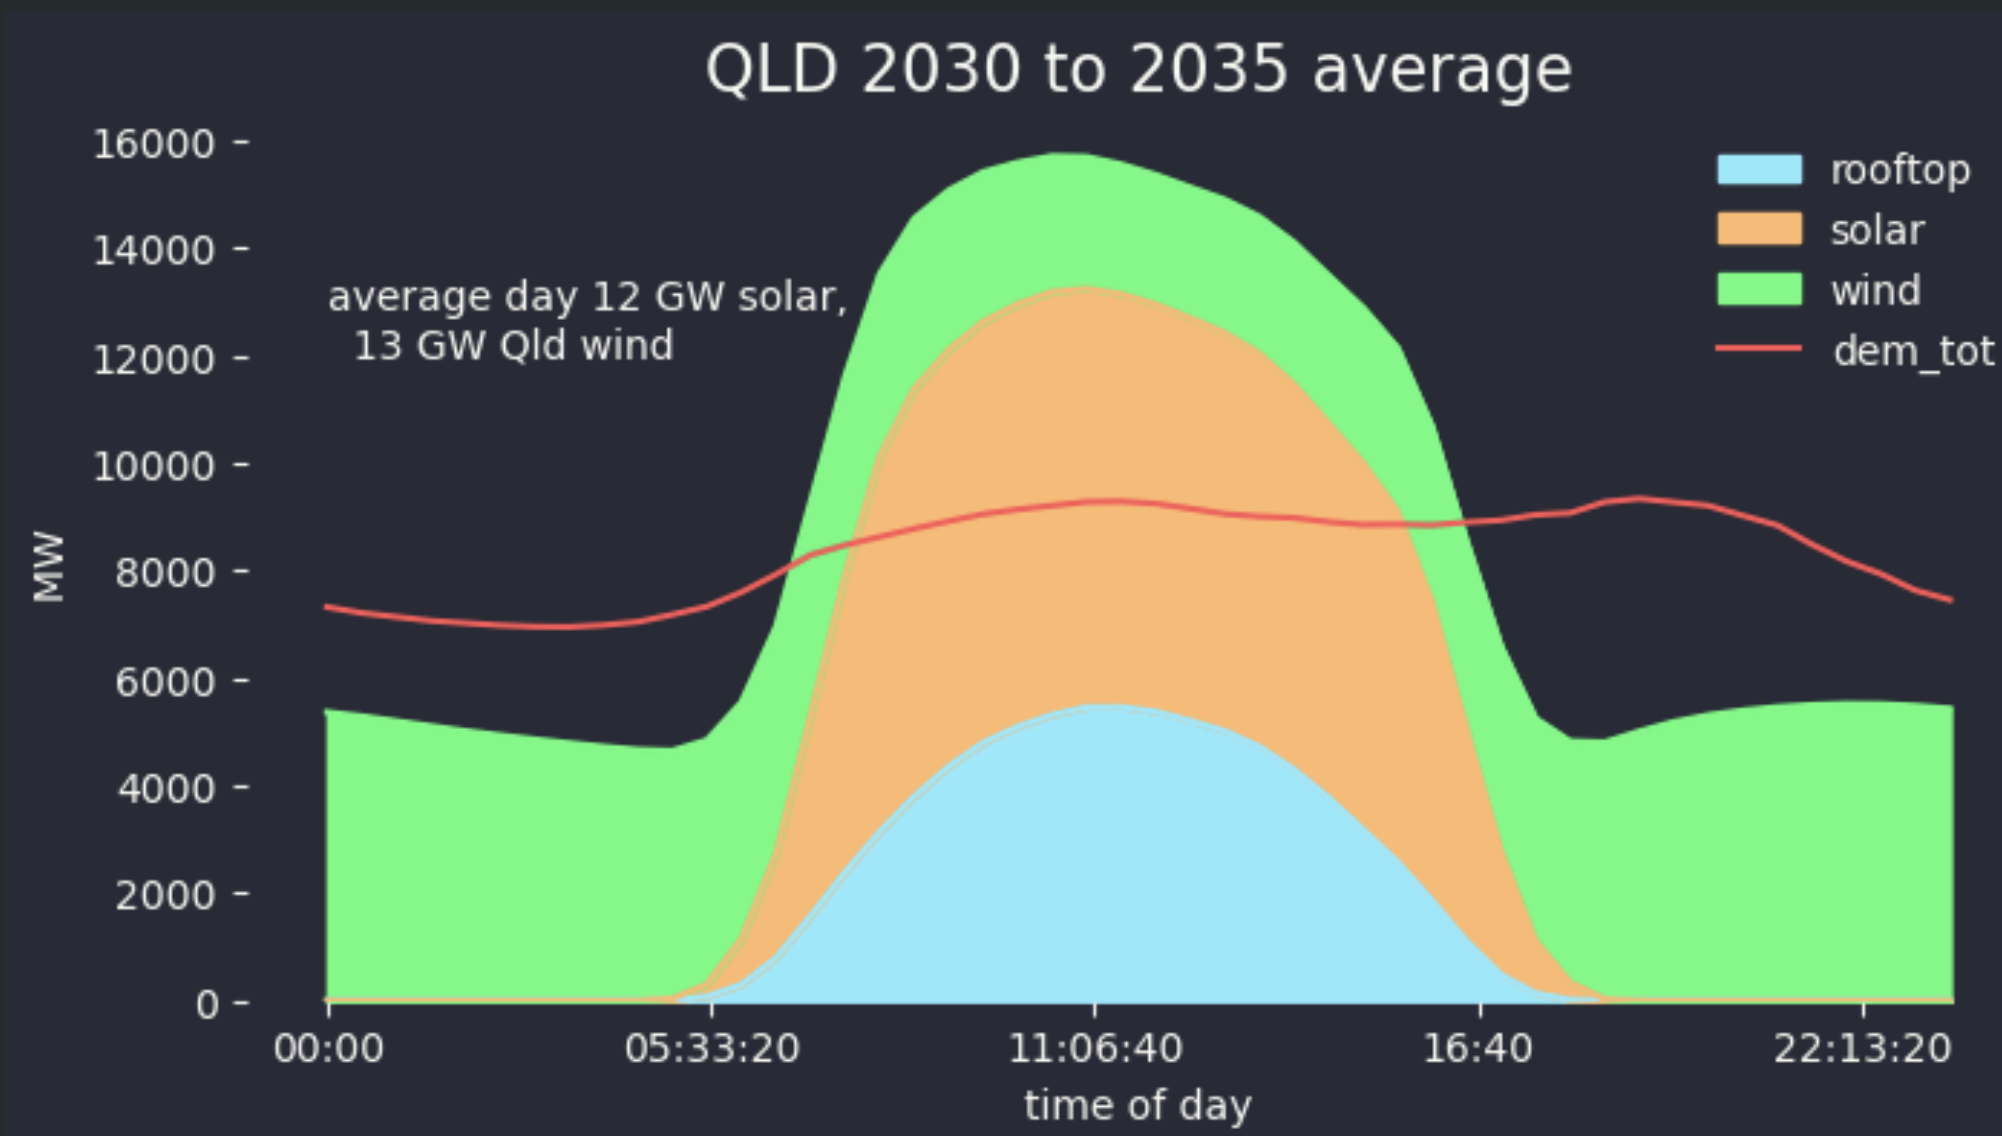
Figure 8 QLD in the 30s under the QLD jobs and energy plan. Source: Govt, AEMO, ITK
You can see the need for storage because there isn’t enough wind run the show over night. In reailty there would be gas as well as storage not to mention the possibility of imports. In short to me this portfolio looks far from optimised even without considering the variation. And yet building 13 GW of wind is not without its own challenges, even in a State as big as QLD.
In what I consider to be a more optimised version 5 GW of utility solar in QLD are replaced with 5 GW of NSW wind, this confers both a higher capacity factor and a diversity benefit.
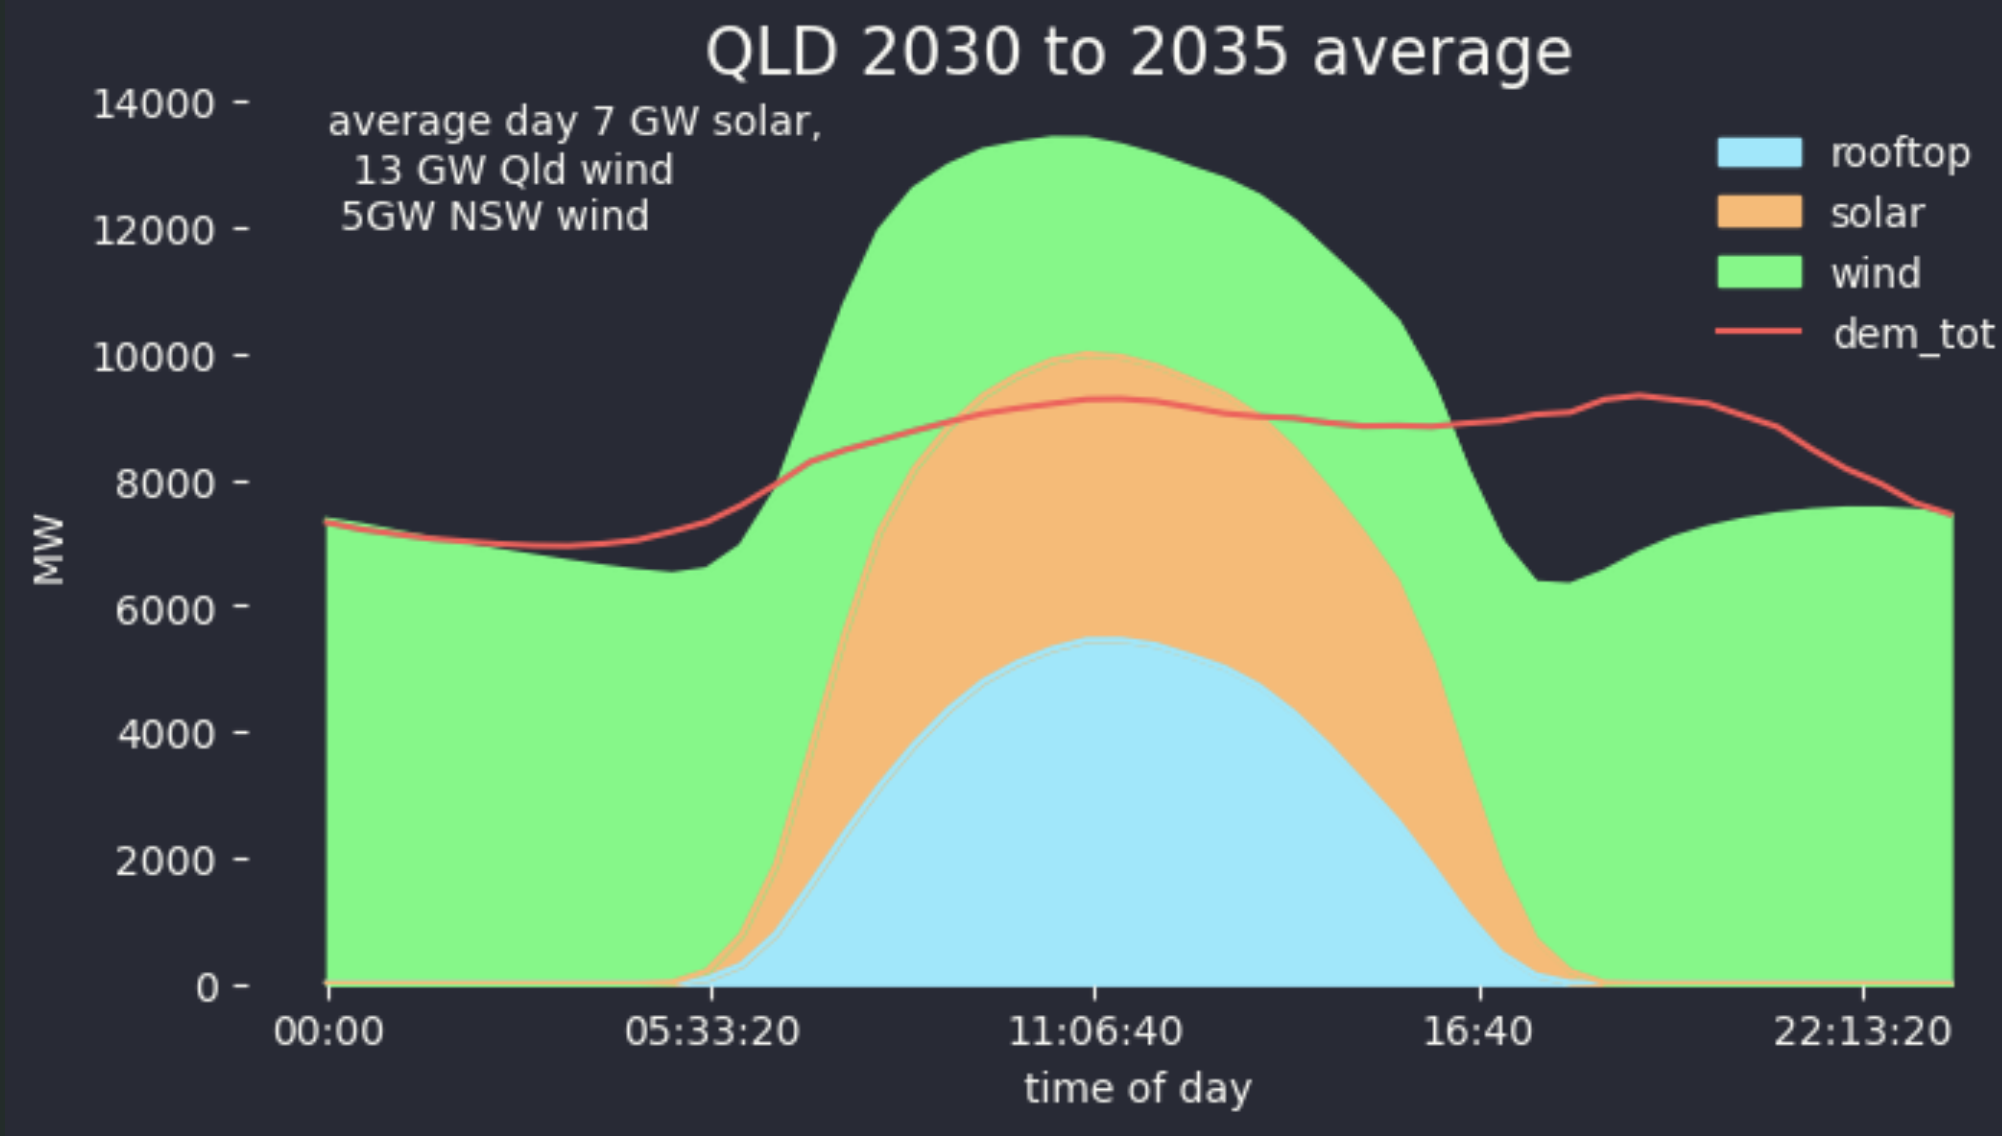
Figure 9 QLD in the 30s with NSW wind instead of some QLD solar. Source: AEMO, ITK
The advantage is obvious, at least on an average day basis.
The average daily firming, which doesn’t account for wind and or solar droughts, of the two strategies are shown below:
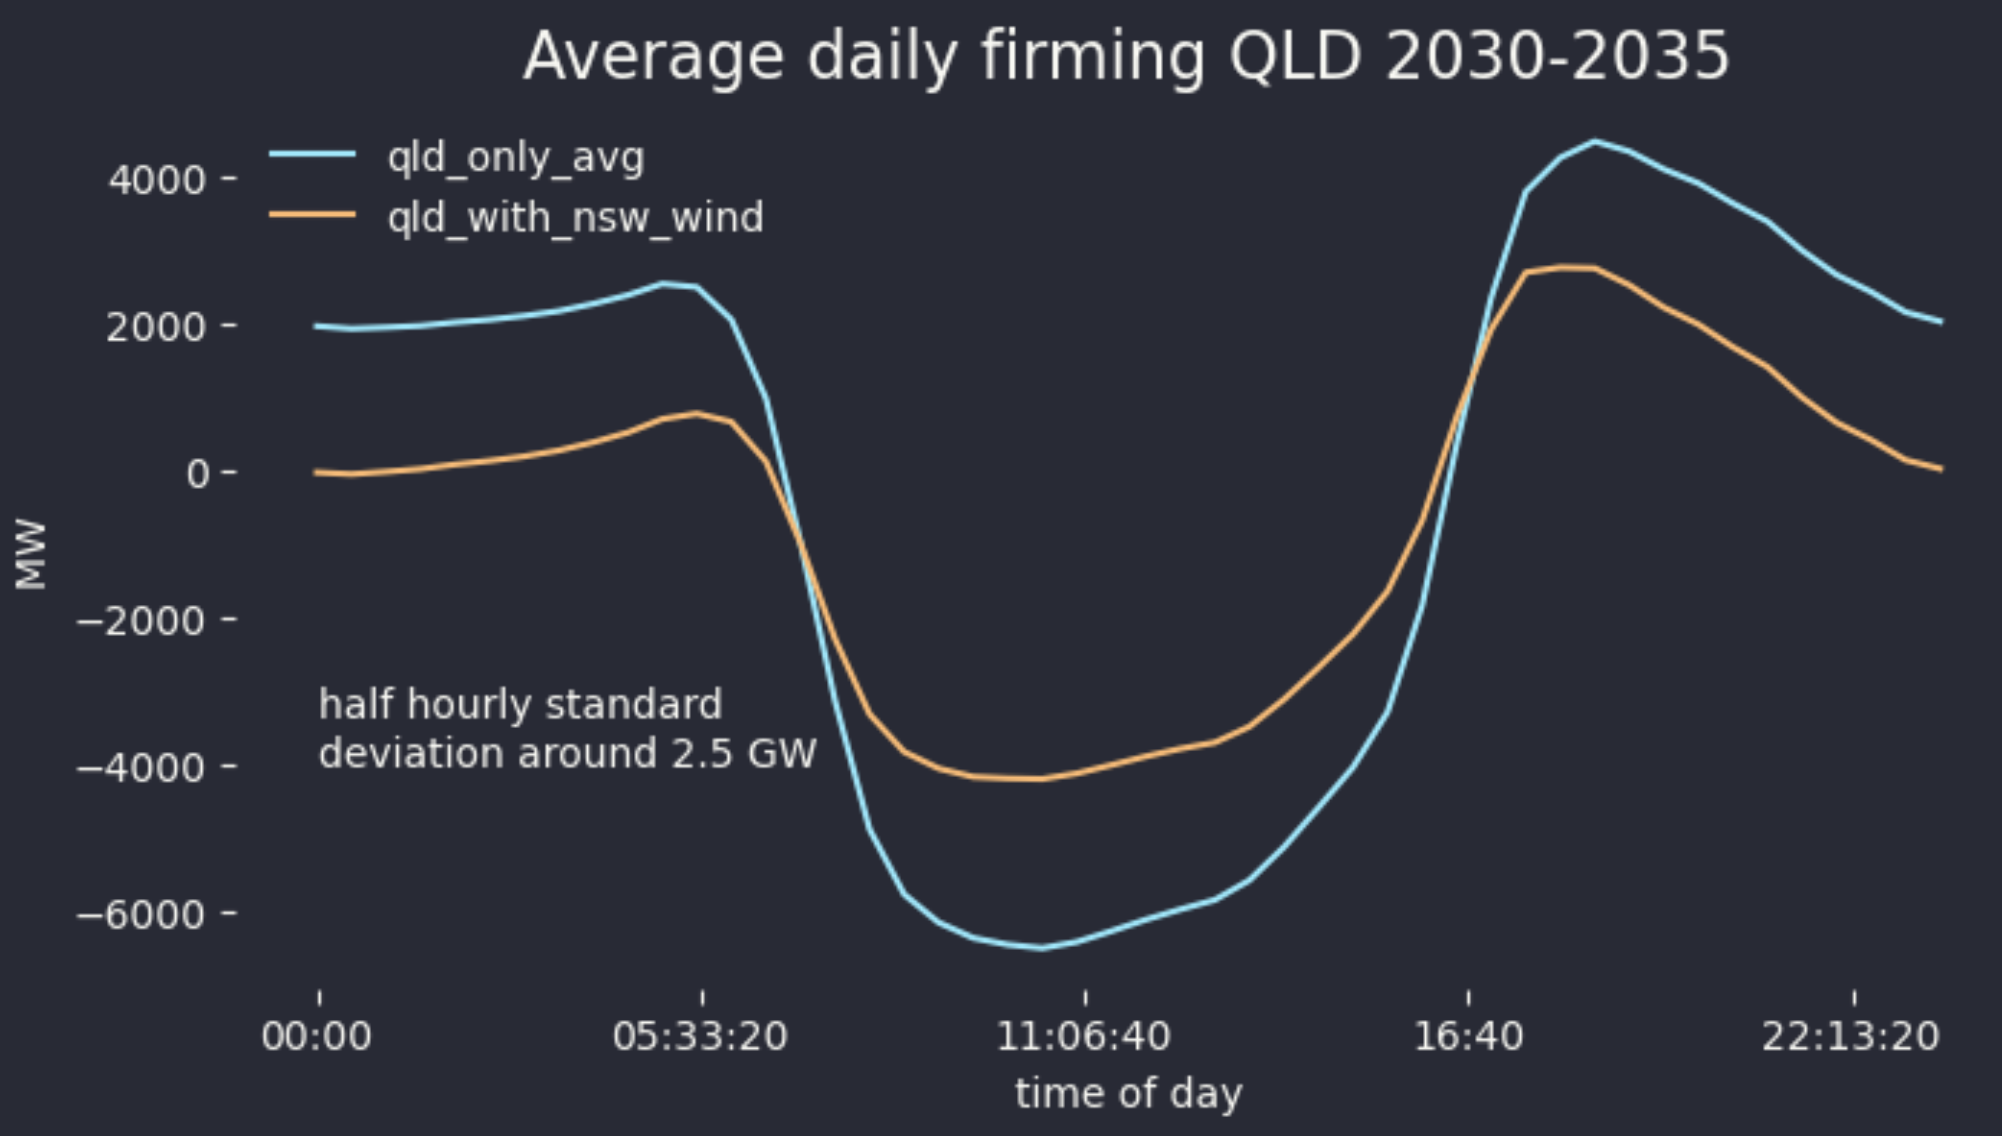
Figure 10 Average daily firming showing the advantage of merging QLD/NSW. Source: ITK