Humelink needs two lines not one now that the SW REZ is its raison d’etre
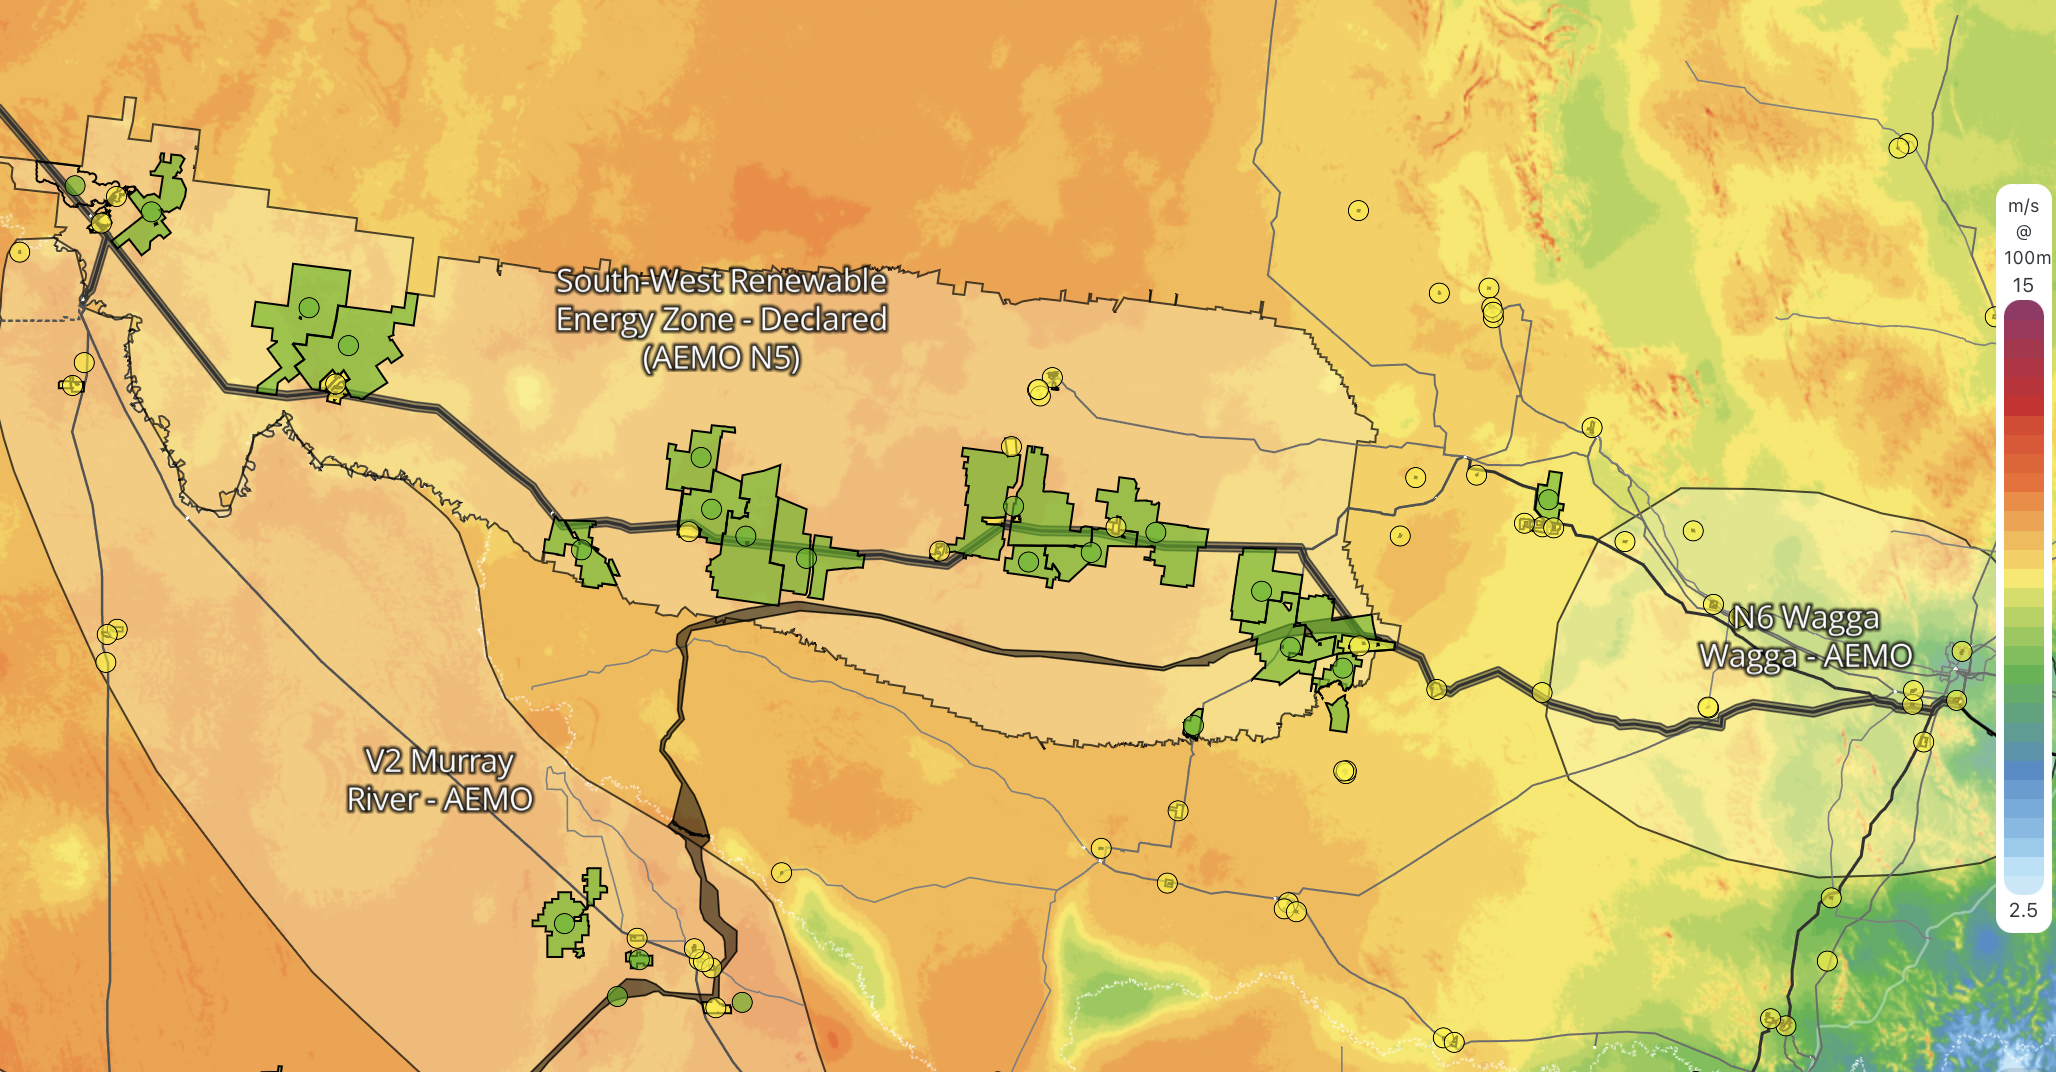
The SW REZ (N5 in AEMO terms) in NSW (Balranald to Wagga region) together with the neigbourhing V2 REZ are emerging as the most economic area to build renewable energy South of QLD. That’s because the community welcomes the development opportunity, because its located at the junction of the new 500 kv transmission links between Sydney, Melbourne and Adelaide and because there is a very large area of land with a fair wind resource. The region could support 20 GW or more of wind and solar and produce 40-50 TWh of VRE or a quarter of 2023 NEM wide demand.
Its not good from a portfolio persepective to have too much wind in one REZ but other than that the only real problem is that even though the transmission distances are relatively short, Humelink is just 360 km, opposition is strong. To realise the region potential upwards of 10 GW of transmission to both Victoria and NSW is required.
In my opinion it would be far more economic to build 10 GW of wind in the SW and V2 than to build 10 GW of offshore wind. Probably only half the cost. Offshore certainly has better performance both in capacity factors and from a portfolio point of view but, in my opinion, its not enough. However again the ability to supply Victoria is an even newer idea than using the SW REZ to supply NSW and the implications for Humelink.
Following the path of least resistance
Whether its Kurt Lewin’s Forcefield theory, or electicity flowing, or water flowing generally the action moves to the area of least resistance.
In the Central West support for renewable energy seems lack lustre.
In New England, perhaps better called Very Old England where the National party hosts some of the most rabid anti renewable people outside of QLD, any kind of development seems to meet stiff resistance. No matter the hosipitals are inadquate, airfares are sky high, crime is rampant. The region comes across as against economic development. And that’s despite the fact there were just as many supporters as opponents of the Winterbourne wind farm.
So developers look to where the going is easier and where they are more likely to be welcomed.
In the Soutwest the economic opportunity appears to be better received. This was brought home by the lack of objection to the Delta/Yanco wind farm, 1500 MW and now sold to Origin Energy for potentially up to $300 m($0.2m/MW).
The South West REZ and Victoria’s V2 REZ are in the transmission junction
My hat goes off to Spark Renewables who a few years ago were amongst the first to see the potential of the SW REZ.
The West of Wagga and around Kerang in Victoria has tremdous potential to be the main hub for electricity production South of Queensland. This area has three main attractions:
- It has access to Project Energy Connect from South Australia, to Humelink and to VNI West
- The wind resource, particularly in NSW is adequate, 7 M/S or better at 100 metre hub height
- At the moment there is good community acceptance. And why wouldn’t there be.
Its important to understand that the power and energy from this area can go to Victoria, or less likely South Australia as well as to NSW depending on conditions. Why build all this offshore wind in Victoria when you have this fantastic much cheaper resource to the North? All that is required is enough transmission?
Ignoring transmission constraints and the related marginal loss factors the over 15 GW of wind plus say 3 GW of solar, representing projects presently under development could produce say 40 TWh or that is 40% of the combined 2023 NSW & Victorian operational consumption, 20% of NEM wide operational consumption.
Clearly developers worked this out long ago. I’m so slow. Not just any developers either. The following table shows projects under development in those two zones over 500 MW.
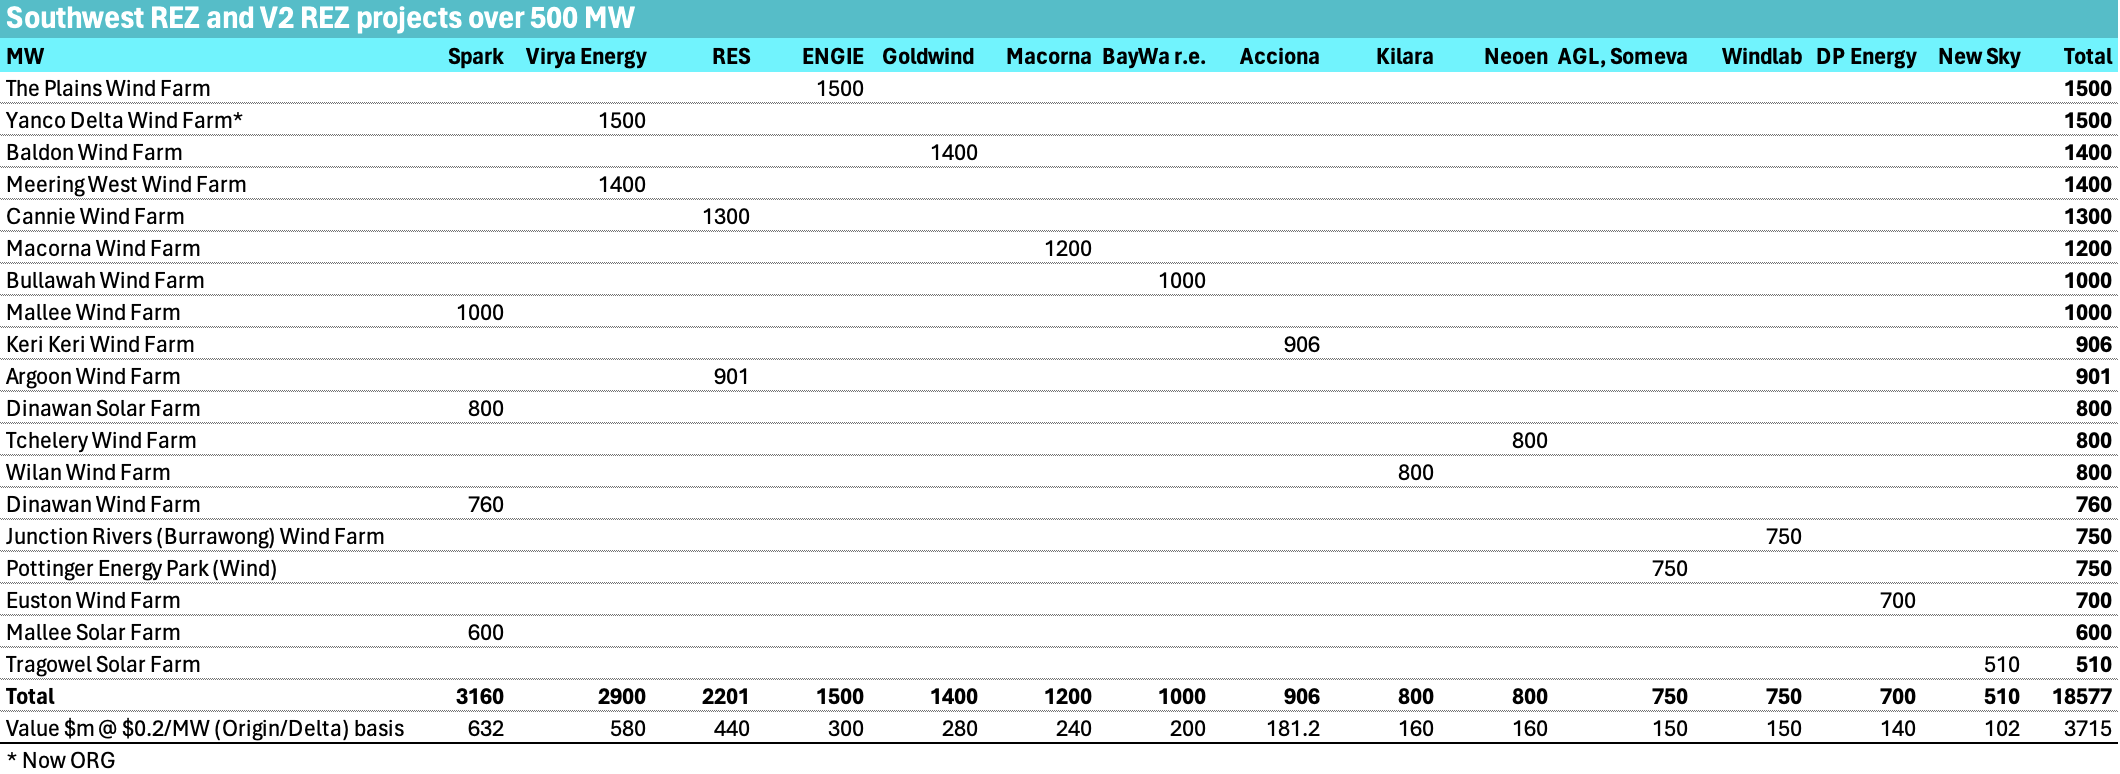
Spark, Vriya/ORG, RES, Engie and Goldwind have over 11 GW of projects combined. These are significant developers with money and credibility. Not that most of the others in the above figure don’t, this REZ is littered with what in the tennis world one might term contenders.
Clearly the transmission links need to be upsized if the REZ is to reach potential
As currently configured and budgetted Humelink’s power capacity of 2.2 GW is far too low for its new role. In my opinion Humelink was designed and sized basically to move Snowy 2.0 power to Sydney, and the connection to PEC (PEC’s capacity of 800 MW) was only a minor consideration and could be handled within the 2.2 GW.
However, if I’m right, and the true purpose of Humelink is to connect the SW REZ and that the SW REZ/ V2 combo can potentially be the biggest REZ South of QLD then Humelink’s 2.2 GW needs to be more like 9 GW.
There are various ways that Humelink capacity can be increased. The most obvious and if we go there the way it would likely be done is adding extra circuits. The “traditional” options have been discussed in the AEMO 2023 Transmission_expansion_options at section 3.8 . These options appear to include a 2000 MW, overhead DC line, or more relevantly “Option 3” an additonal double circuit 500 kV line which would add 6 GW capacity in both directions and at AEMO’s most recent published estimate of $3bn only 60% of the cost of Humelink. Similarly option 4 an additional single circuit would add 3 GW.
Debits and Credits, Hearts and minds
There are two basic attractions of the South West and V2 zones. (1) So far, and its early days, the community sees the benefits, to them, as outweighing the costs. (2) The Humelink transmission distance at 350 km is low and so the cost in $ terms ought to be relatively low. In fact adding 6 GW of transmission for $3 bn (or more likely $4.5 bn) is really a no brainer in today’s terms.
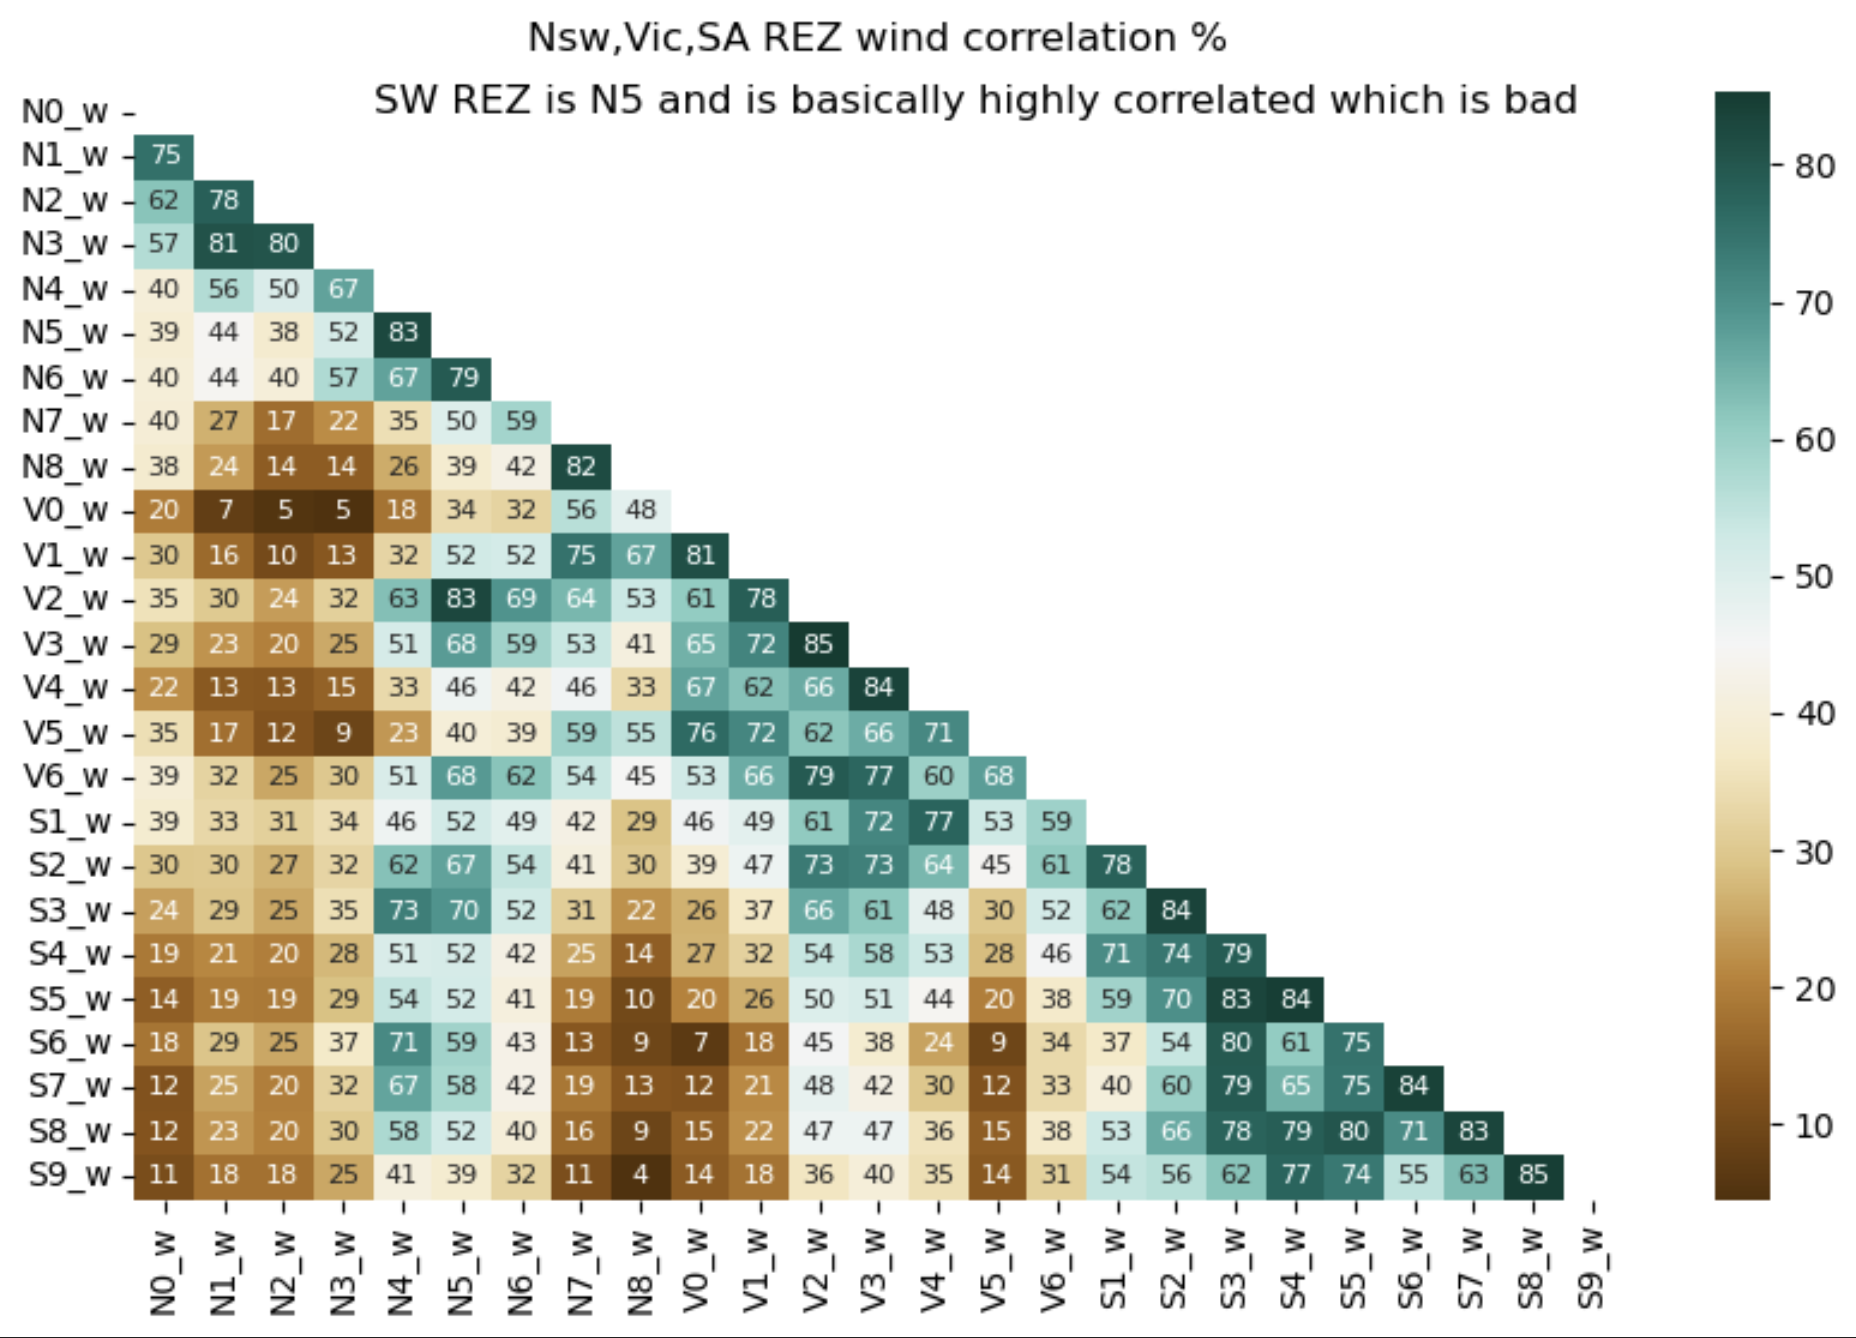
There are also two disadvantages. (1) The SW REZ is not the ideal place to locate wind from a portfolio point of view and (2) although the transmission distances are relatively short the residents don’t love it.
Regarding the correlations ITK’s prior work has unsurprisingly found that putting wind round the edges of the NEM gets you the portfolio with the overall most predictable output. Predictable means the average output/standad deviation. Putting wind in the centre of NSW, VIC, SA which is kind of where the SE REZ is means that the wind tends to be blowing or not blowing at the same time as all the other nearby zones in NSW, QLD and South Australia. On that score there are few worse places to put the wind generation.
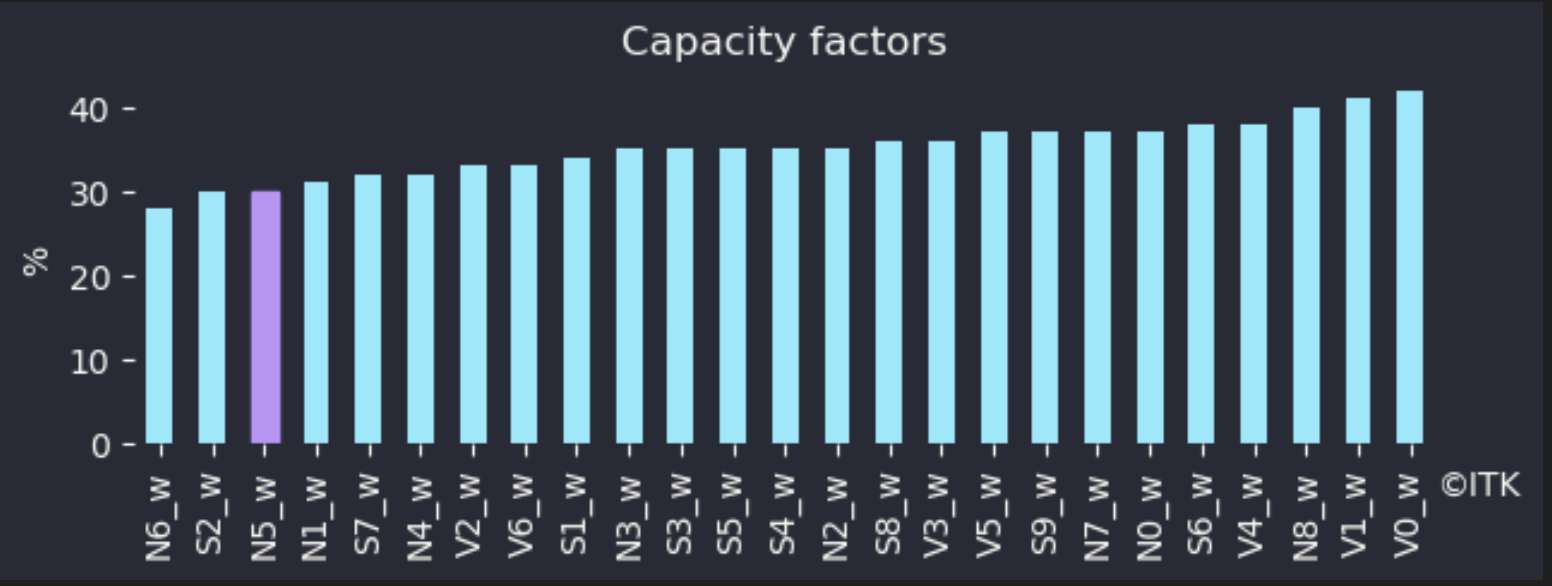
Equally although there is a lot of land, the actual capacity factor is only moderate in fact the 3rd worst in the selected States, although in truth the differences between most of them aren’t that big.
Humelink state of play
Humelink is a a 2.2 GW, 500 Kv double circuit 360 km overhead transmission line that runs from Wagga to Bannaby (100 km south of Sydney) with a branch to Snowy. Humelink is officially due to be complete in late 2026. That date was again probably set in the context of Snowy 2. The NSW section of PEC is also due in 2026. If Delta/Yanco is the most ready to go project in the South West zone there is no chance it will be operating in 2026.
As well as the SW REZ and Snowy 2, Humelink is also relevant to the broader issue of improving capacity between NSW and Victoria, particularly when considered with the Southern part of the Sydney reinforcement ring. In my opinion its one of the most important transmisison links required in the transition. Equally confirmation that its going ahead will be a signal of sorts to the community that perhaps transmission wont be quite the problem the popular media play it as. If it is overly delayed or the cost increases further electricity price differentials between Victoria and NSW will probably stay larger for longer, and NSW prices will stay higher. Development of wind and solar in NSW will be put back in a significant way. That’s how I see it, others have other views.
Humelink is resisted by the community but will be built anyway

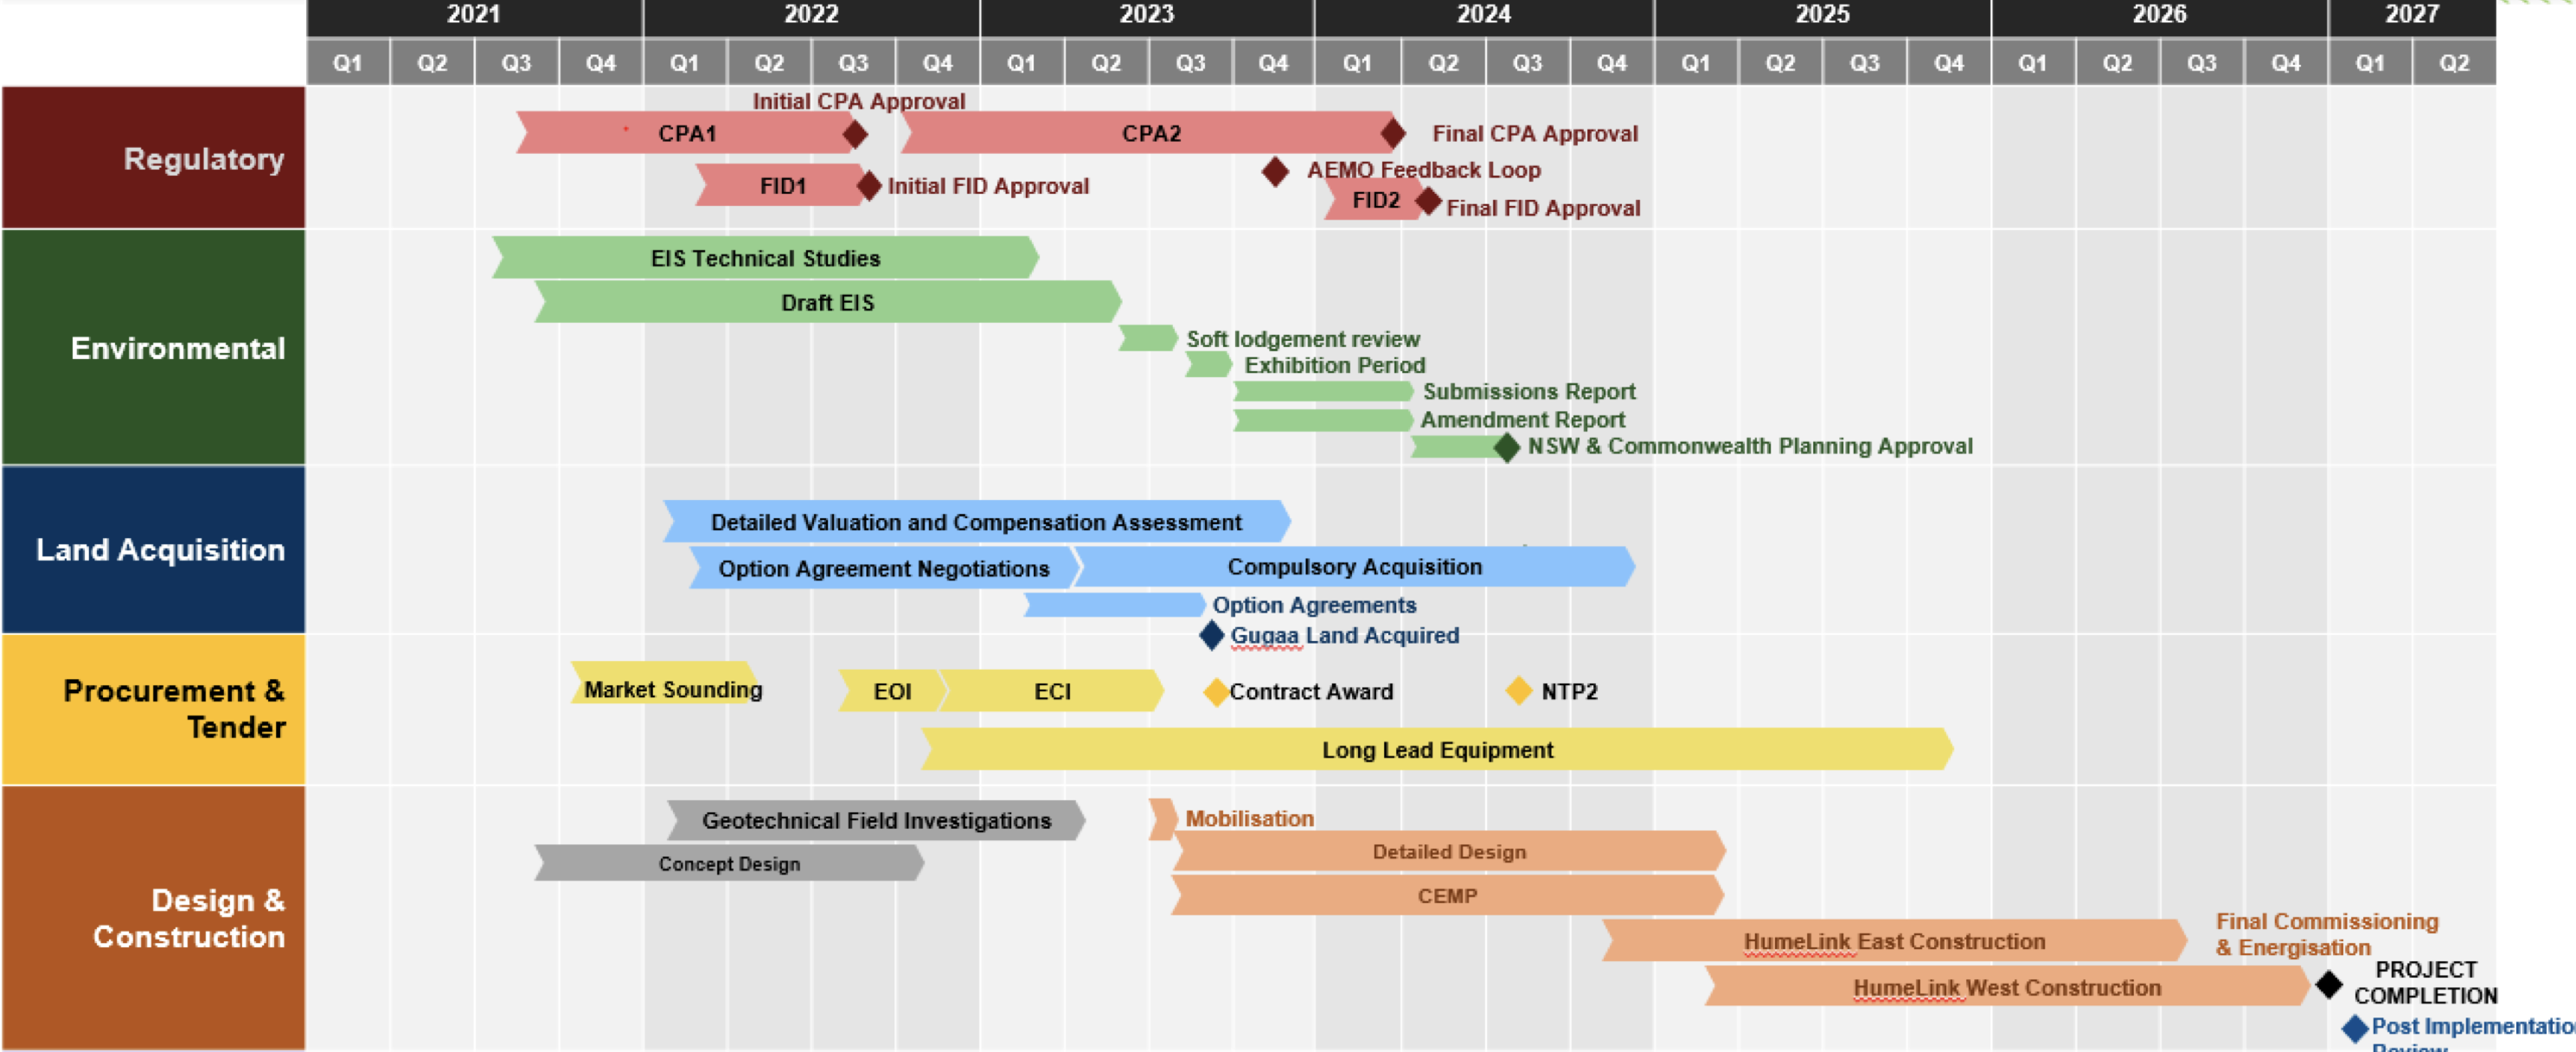
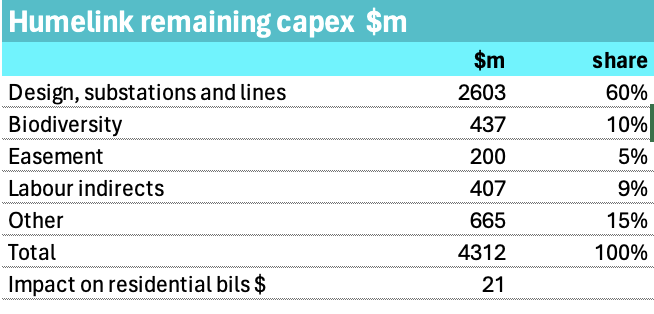
For the $5 bn Humelink project to be built, hopefully starting in 2024 three things have to happen. It has to get the planning approvals, it has to get the easement consents and it has to get the AER to approve the cost. I think all three will be achieved but some easements will almost certainly end up in court so lets start that process.
Planning approval
According to the Transgrid factsheet Humelink is expeted to start construction in 2024 subject to planning approvals. I don’t think the planning approvals are in any real doubt The NSW Planning Portal shows that Transgrid was asked for a response to EIS objections on 11 October 2023. But Transgrid’s response is not shown so the ball is in their court. The route goes through rare orchid and smokey mouse habitats. Of course mice are an endangered species in NSW. Further studies must be done even though the Dept does not actually know itself whether the flora and fauna are actually in the area and the easement is only 70 metres. I might add that like many others I love orchids, we have some that I estimate are 50 years old. I only write this to show just how difficult it is to get something done in NSW. I would hope if another double circuit is added that these studies wont have to be repeated.
In regard to the Federal EPBC Act approval the requirement seems to have been made in 2021 and Transgrid submitted its response in March 2022 and the project will be assessed under the bilateral agreement with the NSW Govt. I don’t know what that means, only that two years later there is no approval I’m aware of.
AER cost approval
In regard to the rate setting process which is done via the AER and was initially under the RIT-T test Humelink has had approval for $620 m of early works funding. Now it is now seeking approval to spend the remainder of the budget. The AER required Transgrid to submit an updated NPV analysis which Transgrid did on 29 February 2024. Naturally Transgrid confirmed that the market benefits have increased more than the cost of the project and the NPV according to Transgrid has increased. The revision is technically done under a Contingent Project Application(CPA 2) and no longer part of the RIT-T if that matters. Transgrid requested AER approval for CPA 2 in December, and in the application, requested it be approved by the end of March.
Easements
In theory, and in this case I think in reality, landowner opposition, within the law, can only delay construction. Ultimately when the objector arbitration/court process is concluded Transgrid will have the legal right to its easement. Some landowners have the money and determination to drag it out but ultimately they can’t stop it. In Humelink’s case opposition seems so entrenched that likely despite the compensation, despite two NSW Govt upper house enquires, despite the national and NSW need, they will continue to argue that either it not be built or argue for undergrounding.
In October 2023 after reading a transcript of evidence at the first Upper house enquiry I wrote:
Currently Transgrid has Consents to Enter for approximately 249.9km of the total alignment of 328km or 76% of the line. Approximately 40.747km of this is public land or approximately 16% of the 249.9km where we have Consents to Enter.
The 328 km mentioned by Transgrid is less than the total line length quoted of 360 km
Given the legal right to an easement I think that alone is enough for Transgrid to proceed. No further information is available other that in total 270 easments are required. Rereading the enquiry evidence landowners along 30% of the route hadn’t at that stage, allowed Transgrid access to their property. That would be something like 90 land owners and 100 km give or take. So 90 arbitration processes. Hopefully at some point Transgrid can provide some actual numbers.
Snowy is not as relevant anymore and Humelink is not about Snowy anymore
In my view Snowy 2.0 has faded from being a big deal to just another thing. The project is hopelessly late, about as over budget as a nuclear plant, and progress contines to be measureable in metres rather than 100s of metres. No doubt it will eventually be built and operate.
However, the market hasn’t stood around waiting. Batteries have come rushing into the void. Moreover, and again in my opinion, thinking about the need for long duration storage is evolving. In particular the fact that X GWh of batteries can be configured to give any amount of power of varying duration has come to dominate my thinking. For instance Borumba, the otherwise admirable QLD Govt’s answer to Snowy 2.0, has 2 GW of powwer for 24 hours (48 GWh) . I proved to my satisfaction that 6 GW of 8 hour batteries (48 GWh) would do a far better job than Borumba. The reason is that power is more valuable than duration. Something that policymakers should write on their forheads. 6GW of 8 hour batteries can be recharged far more quicly than 2 GW of 24 hour batteries. And if you want to you can operated the 6 GW as a 2 GW 48 hour system but you cant operate 2 GW of pumped hydro at 6 GW. The batteries are more expensive, but they are needed anyway because basically Borumba can’t do the job.
The market understands this, or at least they can see that batteries are needed, and so 5 GW of batteries are under construction and there will be more.
And as a result of all those batteries the fact is that Snowy, whether its needed or not needed, will likely not operate as often as originally designed.
DC lines are more relevant with REZs than without REZs
By and large, AEMO, Transgrid, Powerlink have argued for AC connections over DC. There are probably a number of reasons for this, but one of them has been that most of the cost in a DC transmission line is the large, expensive and noisy converter stations at each end. The need for a conversion station means that DC is a point to point system, it doesn’t generally allow for random generators to connect along the way.
A second disadvantage is that the circuit breakers for very high capacity DC lines are not that available, at least that is what I read. And underground DC lines are hard to repair. Admittedly older style and under water but we have all seen how long it took to repair a problem with Basslink. Tasmania lost the connection for months.
Still I am not the person to talk about the technical side of things. What I can say is that:
- Most future renewable generation will be built in REZs
- New transmission is largely being built to carry power from REZs to load.
Consequently, few new generators will be built outside of the REZs and hence there is no need to have the interconnection capacity along the way. To that extent the argument that AC lines are a better choice than DC lines is less valid than before REZs came along.
A financial analyst’s concept of transmission capacity
Google is of only limited assistance in understanding transmission capacity. Not only that, the questions, ie how much power can a 500 KV line carry may remain the same but the answers slowly change.
The best “old school” answer I could find was from the Baylor University website AEP_Transmission_facts
What I read is that AC transmission power capacity increases with voltage. More volts more power. However AC transmission is limited by heat, by reactive power impacts caused by its capacitance and inductance and AC transmission also has a “skin effect” which means that only the outer part of the cable carries power. The longer the cable the greater some of these effects. As discussed in prior article new conductor materials can increase the capacity of AC transmission
Transmission lines also have a number of circuits. Typically, at least in Australia, either 1 or 2. Generally the maximum permitted power capacity on a transmission line is calculated with reference to allow for a “circuit or line loss” over at least part of the transmission line length.
The upside to this calculation is that as the number of circuits increases the maximum amount of power that can be carried goes up more. So 4 circuits can carry more than 2X the power of 2 circuits. AEP explains SIL of 1 as
a loading level at which the line attains self-sufficiency in reactive power.
Using the SIL concept, three 500 kV or six 345 kV circuits would be required to achieve the loadability of a single 765 kV line. Specifically, a 765 kV line can reliably transmit 2200-2400 MW (i.e., 1.0 SIL) for distances up to 300 miles, whereas the similarly situated 500 kV and 345 kV lines with bundled conductors can deliver only about 900 MW and 400 MW, respectively. For short distances, these relationships can differ to some extent reflecting thermal capacities established primarily by the number/size of line conductors and station equipment ratings.
Alternatively a 500 KV line can carry 1500 MW for 225 km assuming both ends of the line are “well developed”.
An example of combination overhead AC and DC line is SunZia connecting wind in New Mexico to Arizona originally conceived as twin circuit AC its now effectively a DC and parallel AC line with combined capacity over 4 GW.
Worldwide the AC transmission votage record is apparently the Ekbastuz-Kokshetau 1150 kV, 432 km line which can carry 5.5 GW on 45 metre transmission towers. There are a dozen existing AC and DC lines in China that carry 5 GW or more, typically at 800 kV - 1000 kV and sometimes double circuits.