No matter if retailers buy from consumers at feed in tariffs, or from the pool, non solar customers still benefit
Sometimes it seems like retailers might be legging consumers over. After all they buy exported energy from households at the currently low feed in tariffs and on sell it to consumers big and small that don’t have their own solar. They probably buy something like 17 TWh this way, or say 8% of total gross NEM consumption at prices ranging from $10/MWh to say $40/MWh. On average probably closer to $500 m per year than $400 m. So it’s a big deal. Then they sell that electricity back to non solar consumers at say $450/MWh or $5 bn. Networks don’t earn anything of the exported power but get the full regulated price when its unsold, even if its to the house next door. This may not seem fair either, but networks have to get the revenue from somewhere, that’s the law. 1
Let’s think about customer sales to retailers as if we were economists. The first thing any economist does after breakfast is to make some assumptions. And of course the first thing anyone does who doesn’t like the economist’s answer is to criticise the assumptions.
I’m not an economist but I’ve hung around them long enough to make an assumption. So I’ll assume that the retail market is reasonably competitive. What this means is that excess profits get competed away.
So if one retailer can buy electricity cheaply from households and so can other retailers, then they will compete until profits are just high enough to stay in business. And in this way the “cheap” cost of electricity is passed on to consumers.
This means the prices that retailers charge reflect their costs. Think about the cost as if it were a tax. If taxes go up prices have to rise, if taxes fall competition pushes the prices down.
So my conclusion is that if retailers are buying electricity cheaply via low feed in tariffs then competition ensures the benefit of that cheap power flows through to non solar customers.
The second thing that happens is that there is more generation than demand for it in the NEM, at least in the past 12 months, and therefore spot prices are low in the middle of the day. Over the past 12 months spot prices were in fact lower than feed in tariffs, although more so in Victoria and Queensland than NSW. So in fact retailers could, in the past 12 months, have done better by buying from the pool rather than from the excess generation of their customers. 2
Regardless of whether retailers bought from the spot market or from customers the effect of the customer excess generation is to depress prices and competition ensures this benefit is passed on to non solar consumers.
And as we are all gradually realising, some sooner than others, this cheap midday electricity is a huge prize. In a couple of years we will look at these cheap midday prices as fully proving that prices do work as investment signals, slowly and with a lag, but they work big time. These low prices in the day and high prices at dinner time are spurring a massive wave of investment to take advantage of the trading opportunity. Prices and markets if fair and competitive work a treat. Like seeds in the garden you just have to give it enough time. Monopolies by and large don’t work. On one view the fundamental problem of the NEM is not the fuel mix. 3. Rather its how to replace the monopolies with a more competitive system, but I don’t think that will happen in my lifetime.
Networks need to report customers sales to retailer, alternatively make retailers do it if the networks cant.
If retailers get 7-8% of supply from customers exports of solar this year and depending on the pace of electrification then it will be significantly more in a few years. So in my opinion we should know as much about this energy as we do about energy that goes through the pool. Right now the data collection and reporting of this data by networks is way below the standards expected by participants in the NEM. We need to do a lot better.
I didn’t look closely at ORG’s accounts but AGL has for the last few years included a very useful portfolio analysis. My opinion, as I’ve tried to make clear, is that when the share price is going up, noone cares about disclosure or fundamentals, but in the longer term term good disclosure, good community relations, a strong culture help a lot. Fund managers look beyond the share price when they make investment decisions. Other stakeholders do likewise. Corporate Australia is one of the foundational pillars of the Australian way. Like Goverment, and the Bureaucracy and the Courts larger public companies provide the certainty and stability that let Australians go about their lives. Ha ha, I must have been smoking.
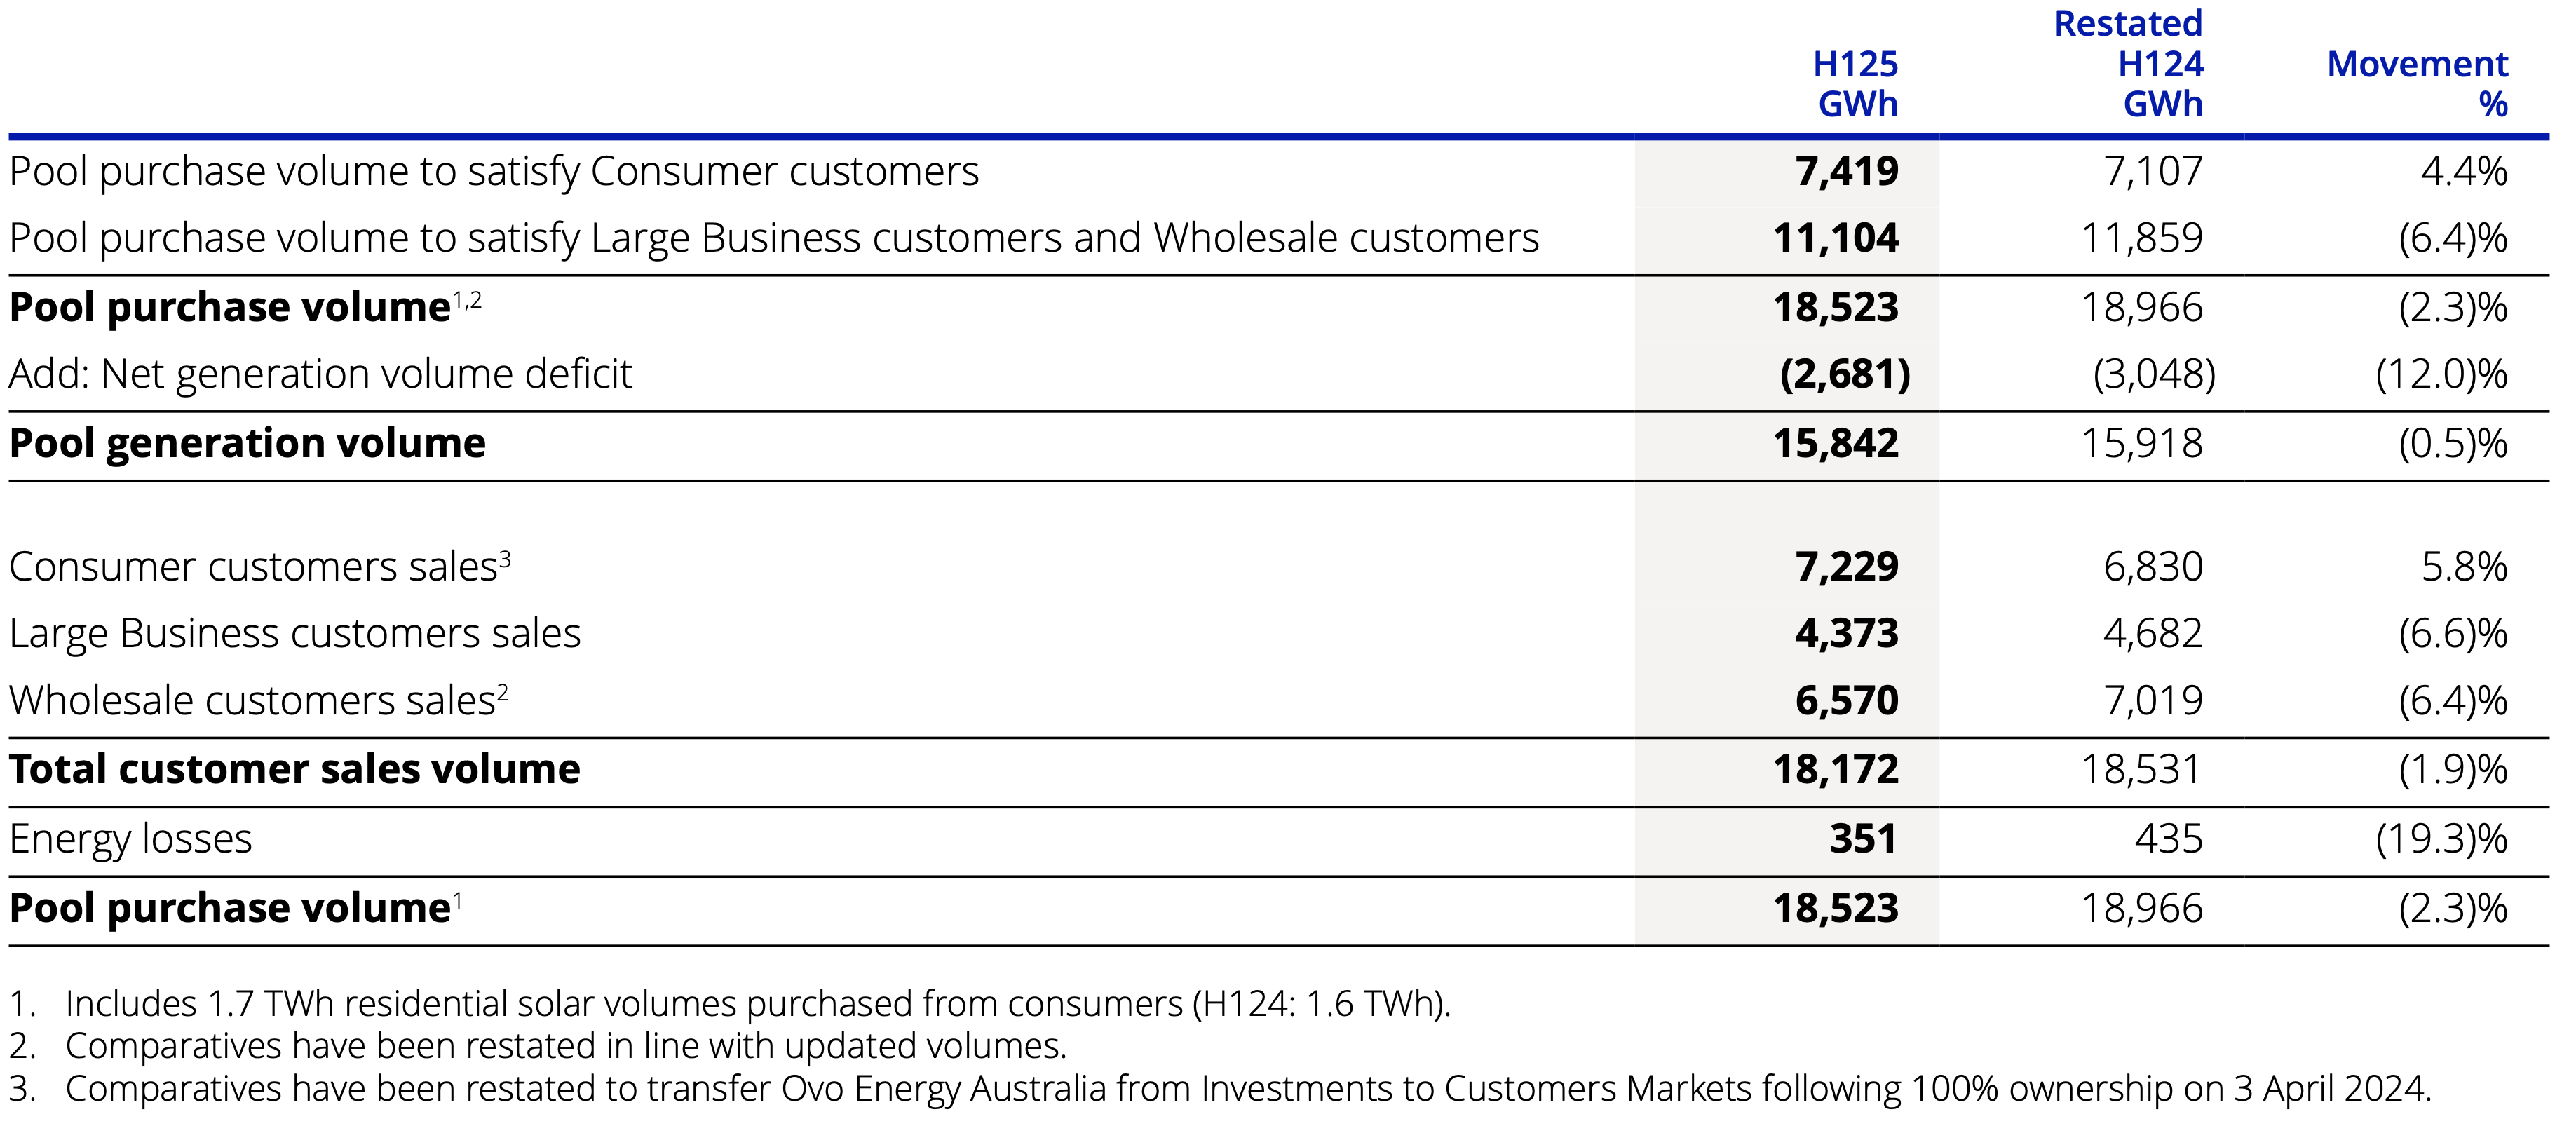
Anyhow here is a snapshot from AGL’s latest interim report. You will see that footnote 1 reports 1.7 TWh of purchases from solar customers, roughly equal to over 9% of volumes.
Retailers get more than 15 TWh from embedded solar across the NEM
No matter how much I learn about the NEM there is always something important that I hadn’t ever got round to thinking about. In this note it’s adding up customer sales to retailers as opposed to the usual focus on electrification or total rooftop production. Here the focus is the household net production.
Feed in tariffs are well below the cost of production but comparable to pool prices. Politicians perhaps correctly focus on prices but even there they only look at the headline prices and miss some stuff. People like Peter Dutton get up and proclaim flat out lies about the cost of nuclear with a perfectly straight face and some people, but I think not many, believe him.
Any how one category of disclosure can be seen from say this screenshot of Energex economic RIN statement. 
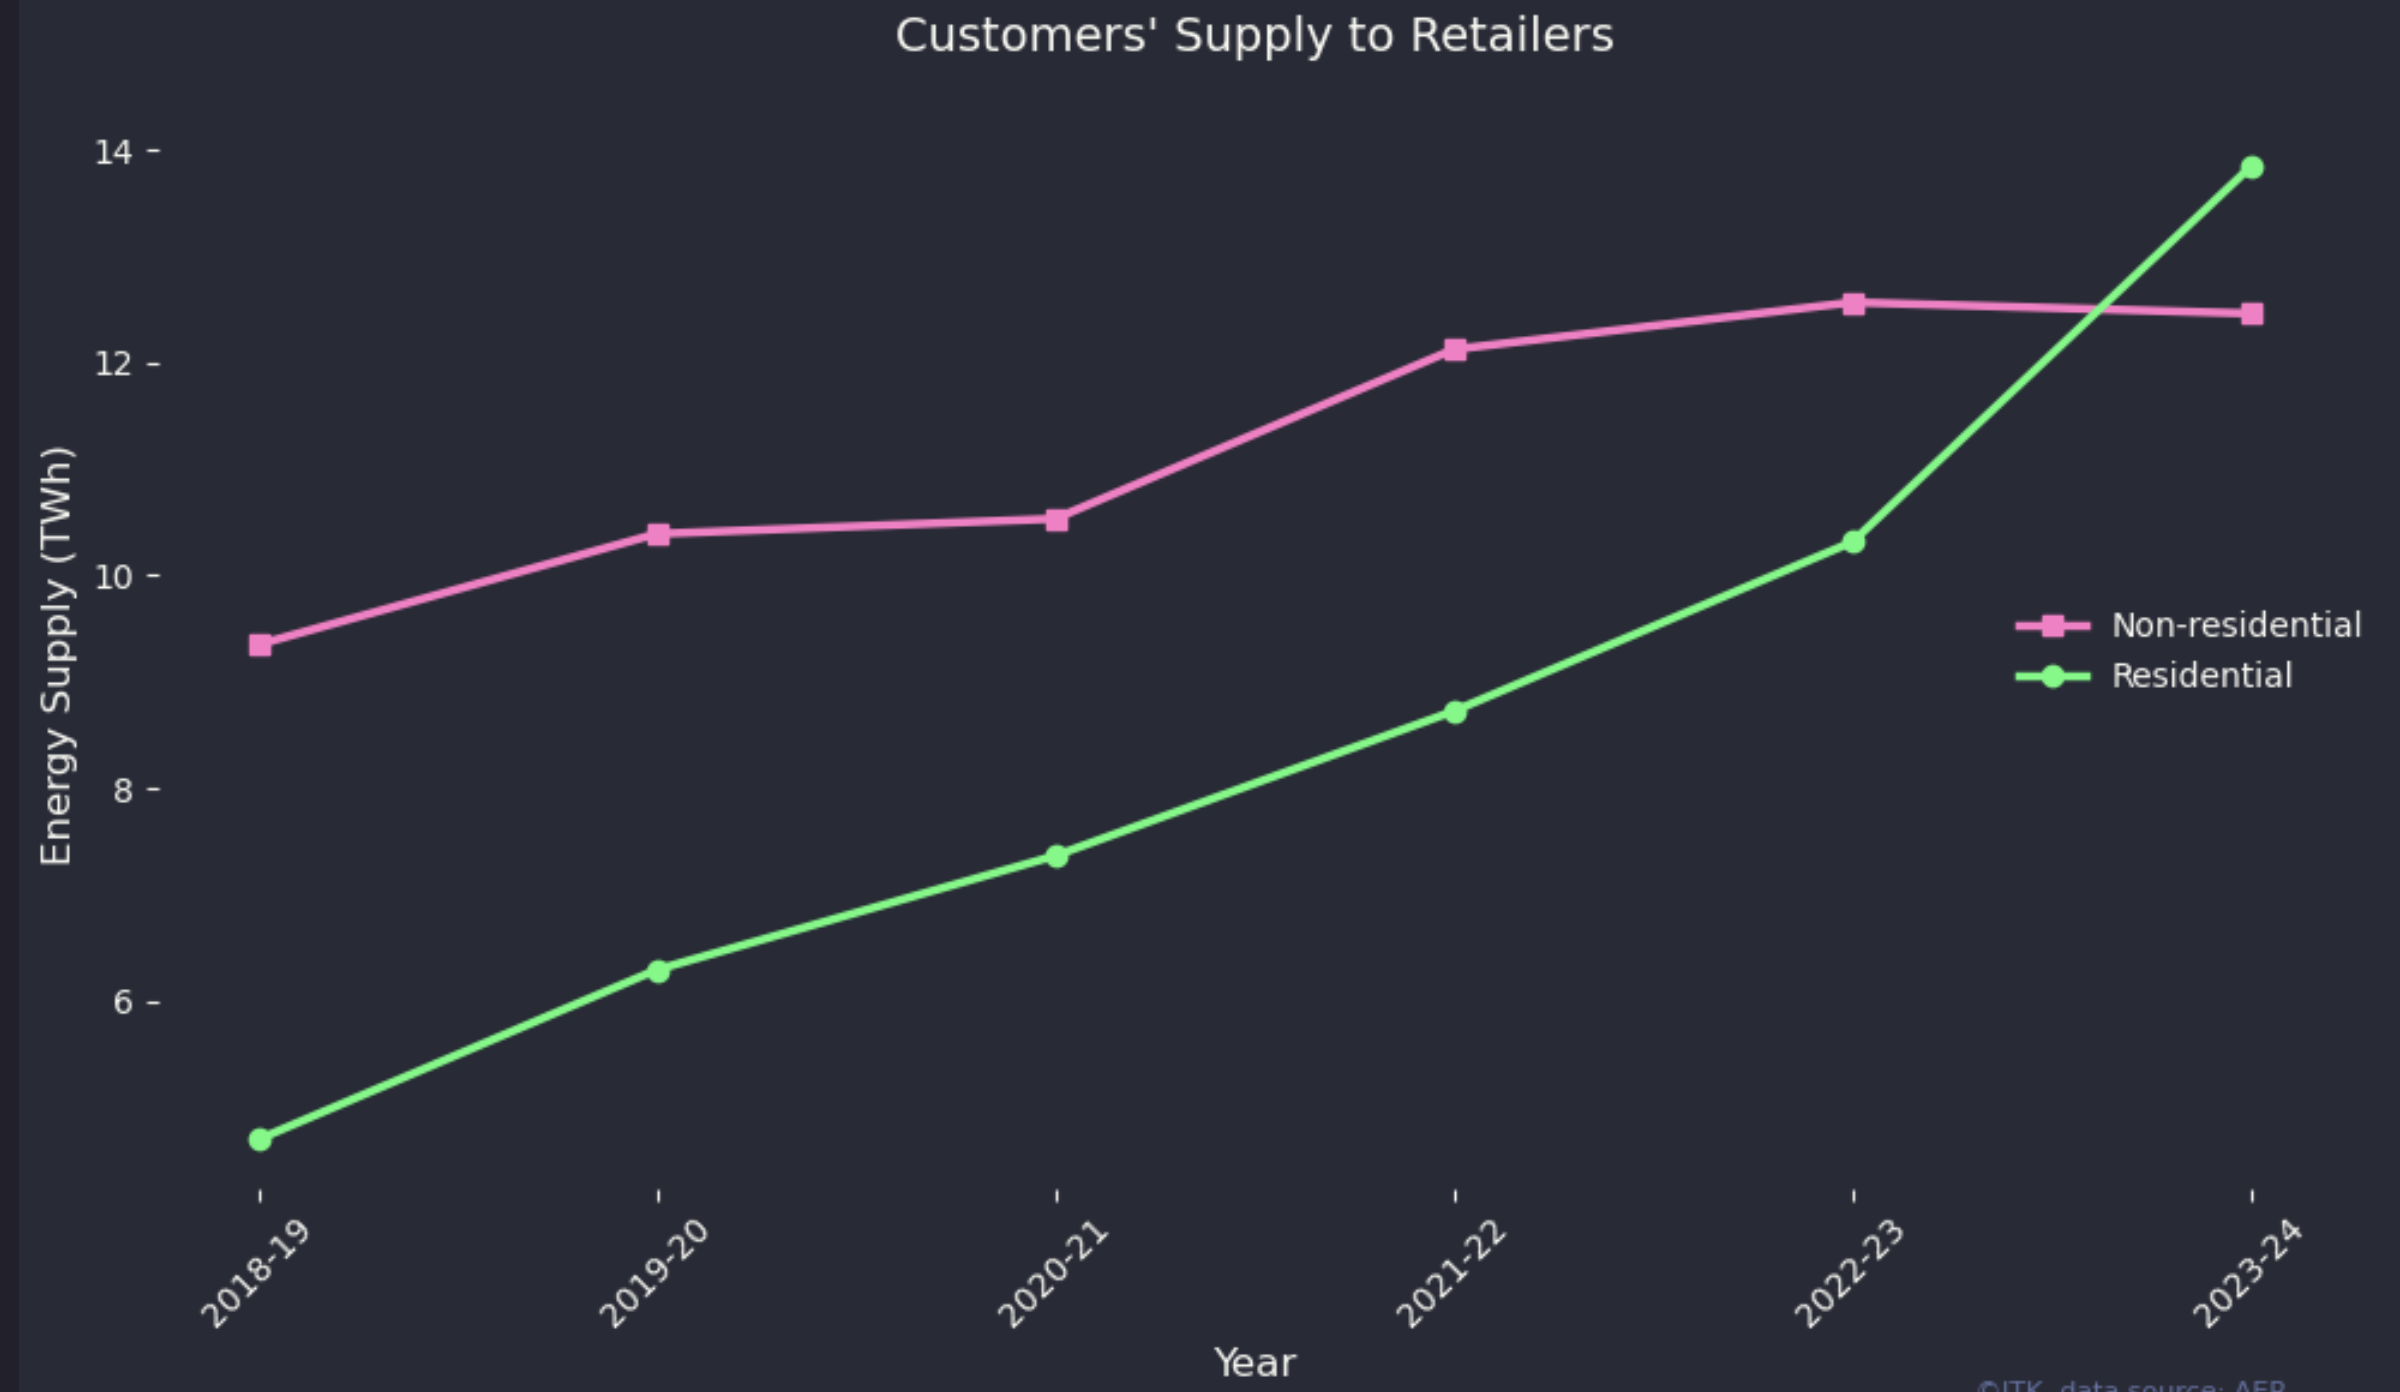
Readers will immediately notice something about this and lights will start flashing. I’ll get there. But in the meantime if we aggregate the data across the distribution networks and divide into residential and non residential I get the following visualisation.
In my opinion the non-residential data likely includes 6-7 TWh of non solar embedded generation, diesel generators, bio fuels and other things that businesses do. That category is broken out separately in AEMO’s demand forecasts . So for the remainder of this note I’m going to focus on the residential side.
A residential total of 14 TWh compares with total behind the meter solar generation for the same financial year of 24 TWh which is about the right ratio although I do worry about the non res data. The trouble is that AEMO doesn’t have actual metered data for behind the meter so its total while likely accurate is just an estimate. I presume that the networks do accurately measure the energy exported back to the grid but given that other aspects of the reporting discussed below seem unlikely to be correct I can’t be sure.
supply has just about tripled over the five years.
It represents about 7% of total NEM supply.
It doesn’t go through the pool market.
Retailers pay the customers a feed in tariff and then on sell the electricity.
I don’t actually know what happens to the electrons physically. If asked I would say they go to the closest consumption point that needs power, but that might be wrong. Ask an engineer.
Disaggregating the data makes me question how well its reported.
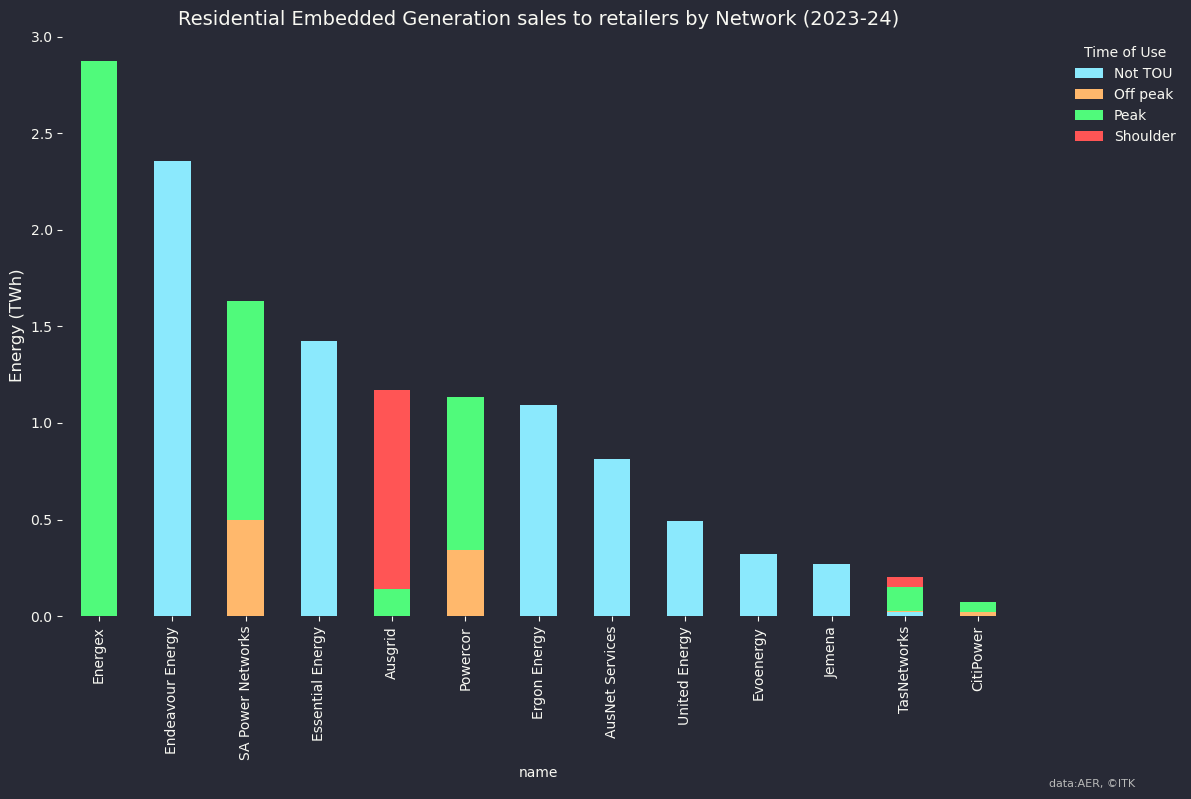
The following figure shows supply by residential customers to the relevant network disaggregated by time of day as reported. But obviously this data is not accurately reported.
I can more or less explain the totals, although it’s interesting how low Ausgrid is on the list. Speaking to distributors it’s clear to me that this reporting is inaccurate as to what time the energy is sold and whether its TOU or not and distributors basically measure and estimate the total and then just lump it into a category.
It might seem nerdy but having good data might make a difference. Imagine you are Tim Nelson recommending behind the meter policy and you can’t even see the export data properly. To me the clear inaccuracies in the reporting indicate (1) Networks don’t have the ability to properly measure and report the data partly because customers don’t have the meters and (2) The AER could do a better job of specifying how the data should be measured and reported since the networks don’t seem to be capable of doing it for themselves.
Also in total there may well be around 1000 MW of VPPs in operation. A VPP or virtual power plant, is as I think about it, just a fancy name for a collection of households who have handed charging and dispatch of their batteries over to a retailer. Those batteries will tend to be dispatched during peak hours, noting that what is a “peak hour” is inconsistently defined and noting there is no daylight saving in the spot price market. So yes some sales can happen at peak, but not many.
In Victoria all customers are supposed to have time of use communicating meters. And yet each of Ausnet, Jemena, United Energy shows 100% of exports by customers are recorded on a Not Time of Use basis. So to me it’s clear that the Victorian utilities just aren’t bothering to measure and report the data and the AER is too busy to worry. And so we know next to nothing about this great big piece of supply.
In short networks have just fallen down on the job here. I did check what was going on with Energex and report the response in the footnote. 4
The impact of behind the meter solar economics on consumer bills.
As stated above, retailers pay households and businesses a feed in tariff. Typically at the moment this is between $10/MWh and $40/MWh. At the same time other customers without solar are paying retailers $450/MWh for electricity.
However its not clear to me that retailers are taking advantage.
Firstly if retailers could by their power at the spot price it would arguably be cheaper to buy from the spot market rather than from households even when they only pay households such low feed in tariffs.
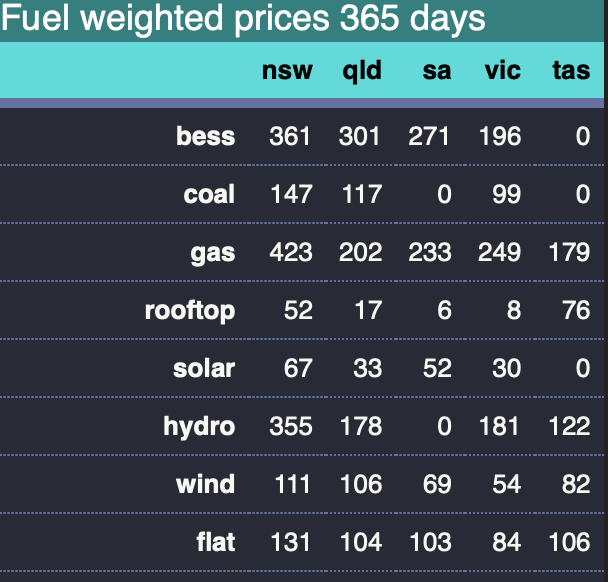
Rooftop solar average price, was just $8/MWh in Victoria and $17/MWh in Queensland.5 Feed in tariffs in QLD are around $40/MWh in Energex areas so retailers might well be losing money buying from households as opposed to buying spot on the grid.
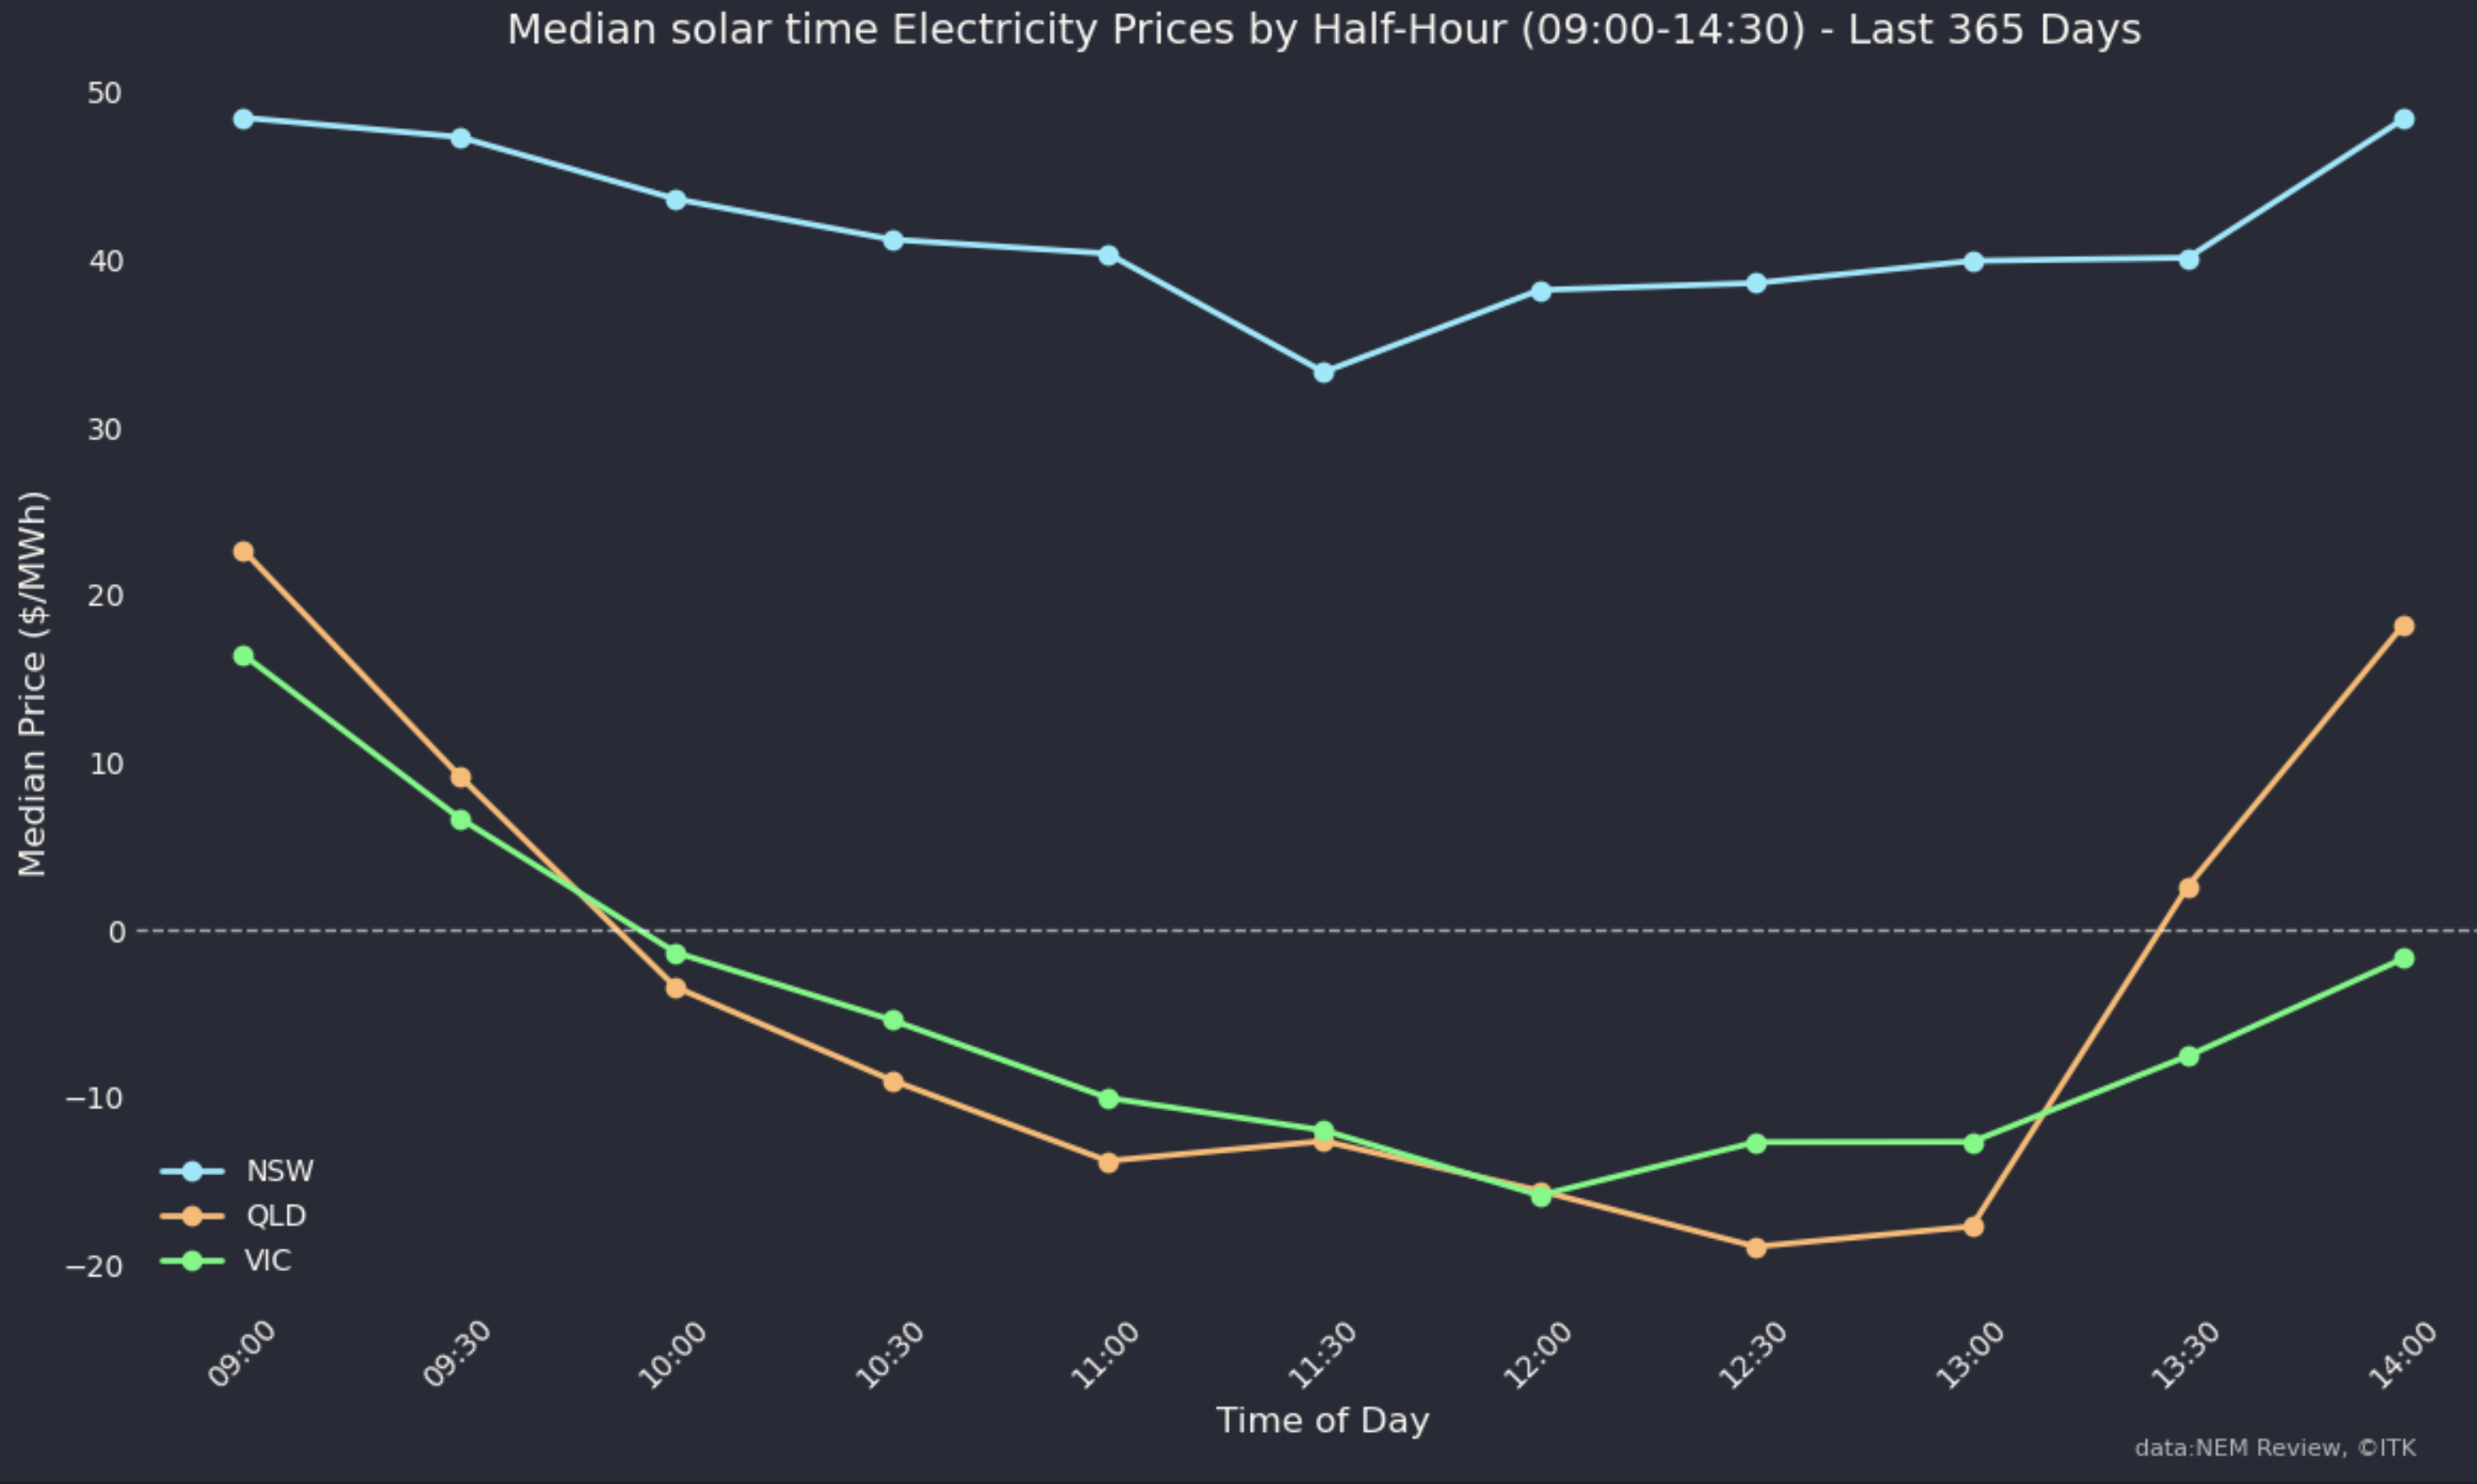
Next we can look at the prices in the main States during the solar hours.
I show medians in the following figure. Using medians removes the impact of things like coal generator or transmission outages which are particularly relevant in NSW and can push the average well above the median. The plot reinforces a view that NSW doesn’t even have enough solar let alone enough wind. It can’t even get middle of the day prices down to the levels of Queensland and Victoria. Partly this is due to transmission making some NSW solar go to Victoria even when the price is higher in NSW. Nevertheless the figure clearly shows that retailers could buy more cheaply from the spot market in QLD and VIC than from housholds. It’s an incidental point but I think that this price signal is what’s driving the massive expansion of battery investment right now. And shows how much faster battery investment can respond to an investment signal as compared to say industry demand response. Industry could be gearing up to produce more when spot prices are cheap but generally speaking business just isn’t set up to manage that way.
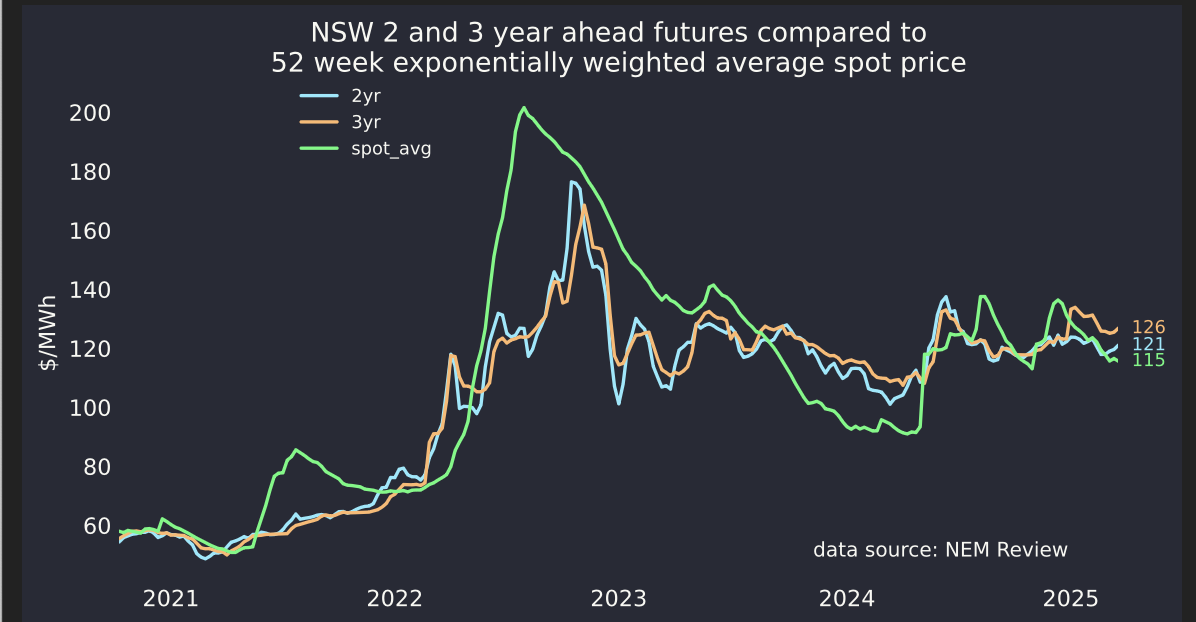
Generally though retailers source most of their energy via contracts with generators, and perhaps have some residual supply sourced from the pool. Overall contract prices tend to reflect spot prices but again only partially and with a lag. Contract prices also reflect future expectations. So a change in the spot price signals a change in supply or demand and some part of that signal is a lead indicator.
Not that it matters for this note but you can kind of see this from a figure I update weekly on my website. The point I suppose is that futures prices although related to spot prices tend to reflect the market’s view of underlying full costs of generation. Some operational generation is required in the middle of the day and retailers and therefore consumers have to pay the full costs including the capital costs of that production.
Footnotes
As I’ve often said monopolies stifle competition and innovation and it’s been that way since the 1500s when the word monopoly entered the english langue. As usual I digress.↩︎
As an aside we should generally expect feed in tariffs to be a lagging function of the spot market. Feed in tariffs are adjusted less often and who ever sets them looks at what’s going on in the spot market and then adjusts the feed in.↩︎
We know we have to quickly decarbonise and that basically all we need to do it is solar, wind and batteries and transmission. In the industry to a greater or lesser extent when people don’t talk their books that is the accepted wisdom.↩︎
There are differences in how each DNSP reports its residential embedded generation data to the Australian Energy Regulator. Specifically, there are variations in the definitions of On/Off-peak times as they apply to energy delivered (i.e., on/off-peak charging periods) and On/Off-Peak energy received (i.e., on/off-peak purchasing periods). Energex’ reporting to the AER for energy into DNSP network at On-peak times from residential embedded generation is the sum total of all energy received from residential solar photovoltaic (PV) generators during the hours of 7am-9pm. This value is reported as an estimate as it assumes that all residential solar power is metered and generated during this timeframe given daylight/sunlight hours. There is not a consistent definition applied across all DNSPs. We are aware that Powercor reports On-Peak energy received for a period of 7am-11pm and its energy delivered is reported based on charging periods per customer assigned tariffs. *Several other DNSPs, including Jemena and AusNet, do not report this information by time of receipt (on-peak, off-peak or shoulder) at all, and instead report all generation from residential solar PV into their respective networks against the variable ’Energy received from embedded generation not included in above**categories from residential embedded generation’.* Please note, the figure of 2568 GWh that is referenced appears to be for the regulatory year 2022-23 rather than 2023-24. The information for the 2022-23 regulatory reporting year is submitted to the AER in October 2023 and there is often a delay in the AER publishing information.↩︎
calculated as the revenue = (sum of the last 15520 half hours of rooftop volume in a half hour * price in that half hour /2) divided by the total rooftop volume ↩︎
