New projects are needed but the VRE total is going up and the batteries will make a big difference
Renewable generation should be around 50% of NEM supply by 1 July 2026 probably a little less given that Golden Plains stage 2 is very early in the construction cycle. To get to 80% by 2030 will partly depend on what happens to demand. If Demand is flat capacity capable of supplying about 67 TWh a year will be needed. After allowing for rooftop solar I reckon about 25 GW will be needed, maybe a bit more. That’s a heck of an ask but in my opinion still possible and broadly in line with the objectives and scale of the CIS. I’ll have more to say on the role of the CIS once I get round to talking about ITK’s price forecasts, but that can wait. Talking capacity and output here.
I hadn’t updated the VRE capacity details for about 3 months. Using a summary from www.renewmap.com.au possibly the most interesting new web site for us energy nerds to be developed in the past year I’ve updated the under construction and operating tables for wind, solar and batteries in the NEM. I rely on the renewmap team’s definitions of operating and under construction. As an example last time I did the update back in March Rye Park was shown as under construction even though 50% of the capacity was producing.
For this exercise the exact definitions don’t matter. I’m interested in understanding how much VRE (variable renewable energy) the NEM is capable of producing and a different question how much it’s likely to actually produce. Actual production depends not just on the weather, and this early Winter has been a strong reminder of not just wind drought but also how important QLD is going to be to the Southern States as the VRE roll out continues, but also on MLFs (marginal loss factors) and economic curtailment. Economic curtailment can itself occur for two reasons. Reason 1 is that prices go negative and despite the value of RECs various PPA agreements require a producer to shut down when prices are negative. Reason 2, not so common yet but will become more so is that the total of wind and solar production exceeds demand.
As long as there is “must run” thermal generation in the system we will get more curtailment than is needed in a highly renewable system. At the moment there are 1000s of MW of coal and gas that have to run 24/7. That generation is loss making typically in the middle of the day and results in excess production and some curtailment.
For instance in QLD even in Winter, even without the 1.6 GW of wind nearing operations prices are still going negative at lunch time.
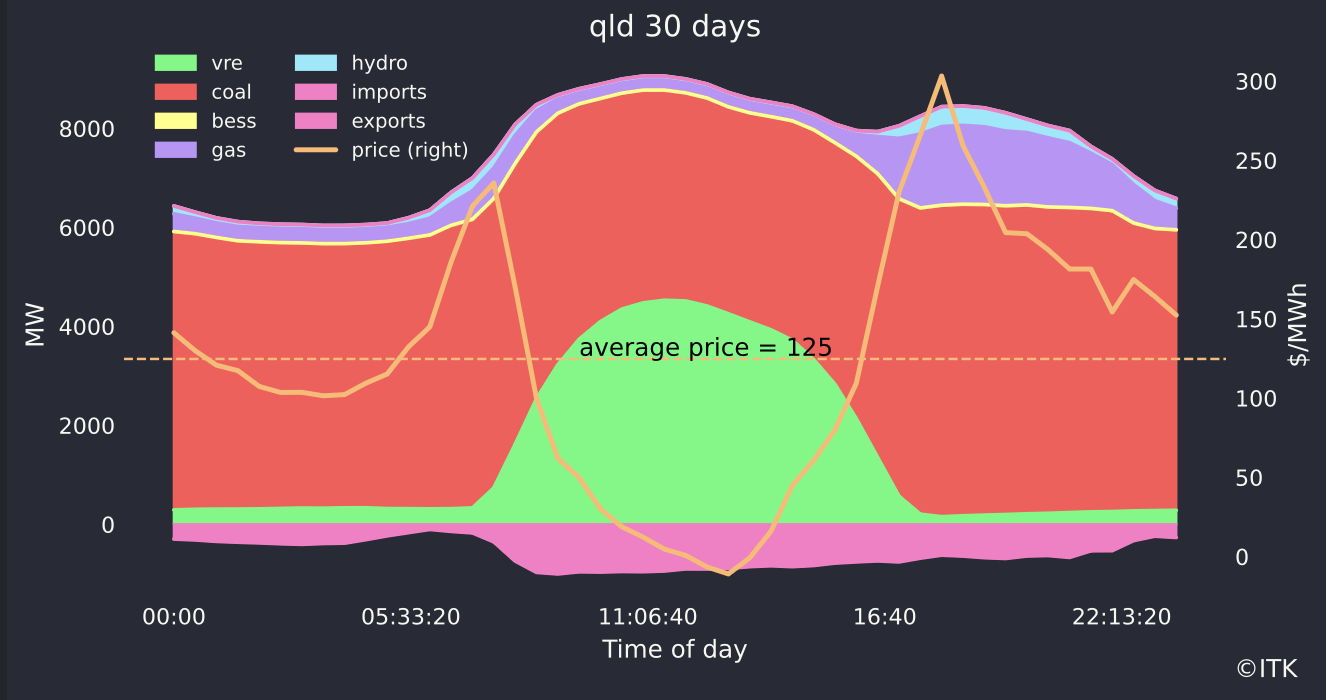
QLD can export most of its surplus to NSW but clearly if prices are negative it’s not getting rid of all of it. The other option for a surplus of lunchtime power is to charge it up for storage because the spreads are still excellent over $300/MWh in all States except Victoria.
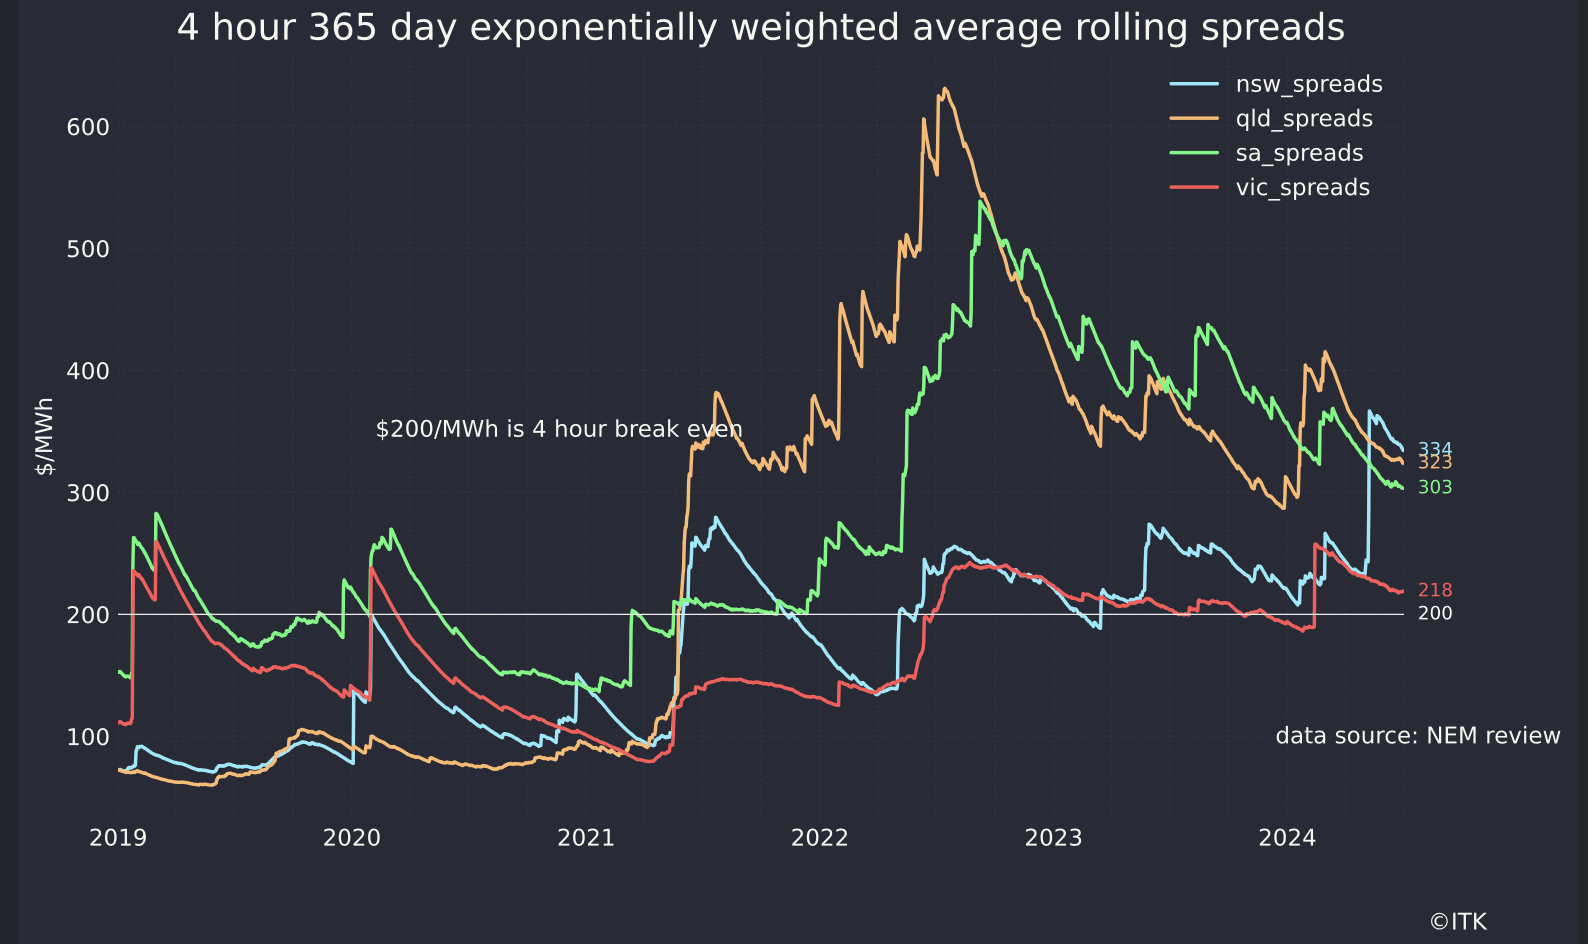
Lots of margin, based on looking backwards, for battery developers if you consider the rapidly falling cost of batteries. Speaking of battery cost my understanding is that a 2 hour battery cost say A$650/KWh a year ago but my understanding is the quotes now start with a $4 and still falling. The reduction is due to a, long expected by ITK and everyone else, reduction in cell costs. So because balance of system costs haven’t changed, the reduction is in the cell costs, there is basically a strong incentive to increase duration. In turn with more duration less of the battery’s revenue will come from frequency control and more from trading the daily market. Over the next three years this will play out as a flattening of evening price peak, reducing gas opportunity, at least outside of wind droughts, and maybe taking some stress off midday prices.
No matter how many utility batteries are built unless there are lots of household and network batteries it’s likely that rooftop solar will still make life very tough for utility generators at lunch time. That’s because a rooftop solar system has a capacity factor of at least 14% which works out to say 3.5 MWh per day on average. So if we are installing over 2 GW of rooftop solar a year, you need 2 GW of 4 hour batteries just to deal with the incremental supply. Never mind all the utility solar as well. Much better to have 1 GW of 8 hour residential and community batteries installed each year.
And if the reason utility battery costs are falling strongly is because of falling cell costs, then it’s likely that household battery costs can also fall quite a lot. I’ve only been waiting a decade for that to happen.
Anyhow all that is a bit off today’s topic which is existing and new supply. I’m only going to show the broad totals.
Where we are and the road out to the next bend
First existing installed utility VRE capacity has increased from 19.9 GW in March to 20.7 GW since I last did the numbers. Of course there is a similar quantity of rooftop solar
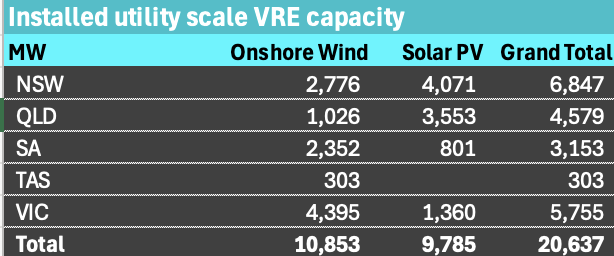
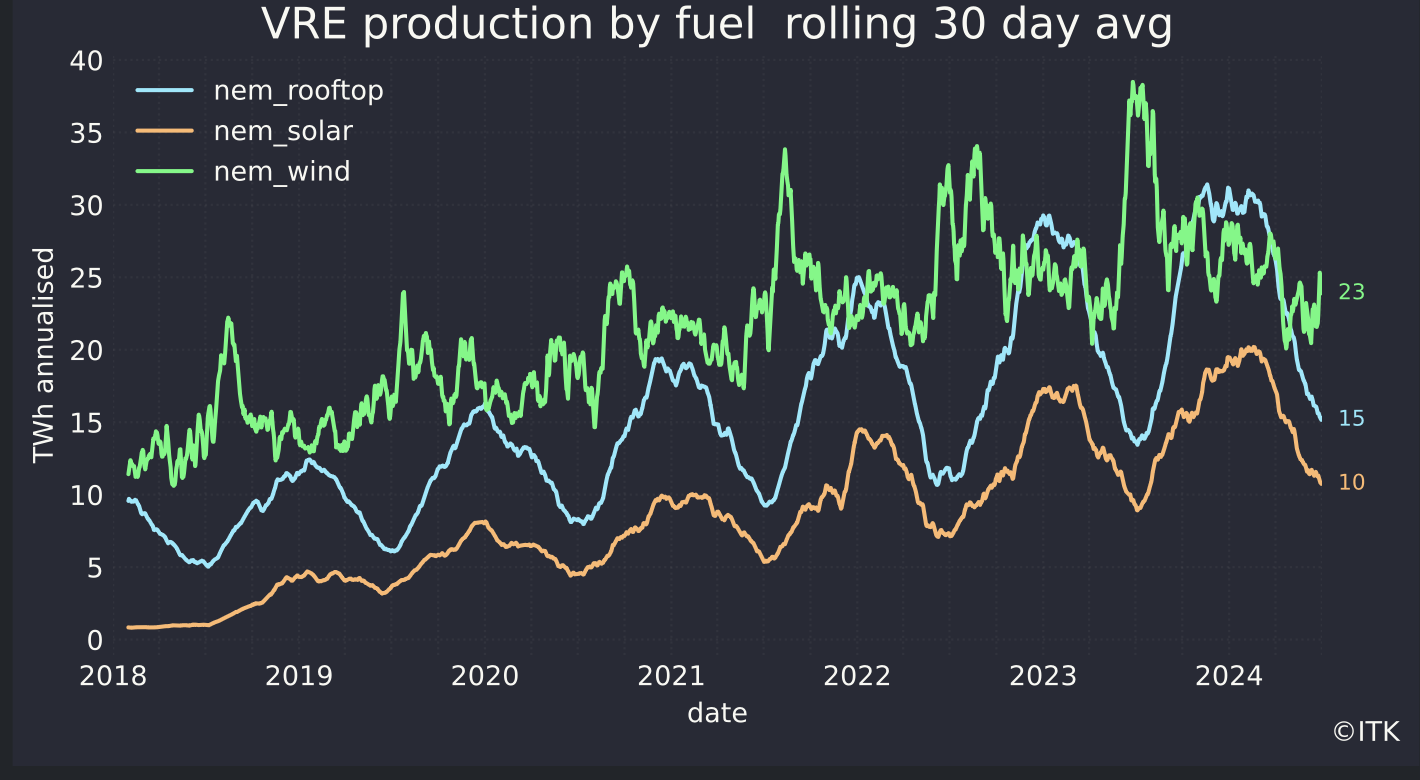
Wind is up by about 300 MW and utility solar by about 500 MW. However output is well down due to the wind drought. No surprise there. Where the surprise will be is when the wind picks up again.
Turning to under construction
The total remains about 6.9 GW, boosted by Golden Plains stage 2 in Victoria.
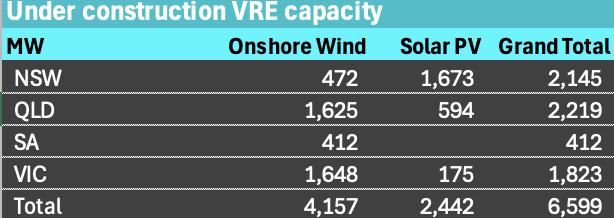
Pleasingly wind capacity is going to increase 40% and even more pleasingly more than 1/3 of that is in QLD.
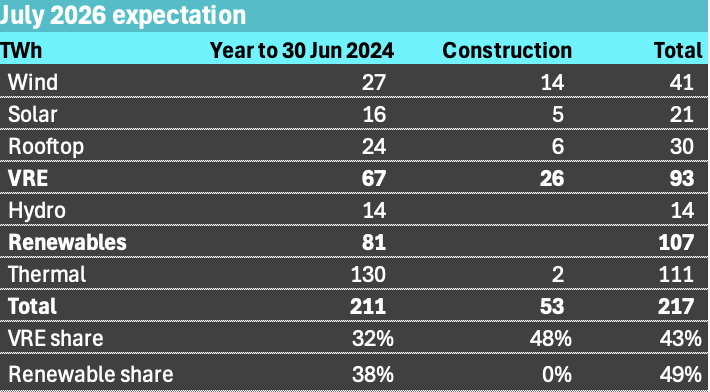
Heading close to 50% renewables in two years.
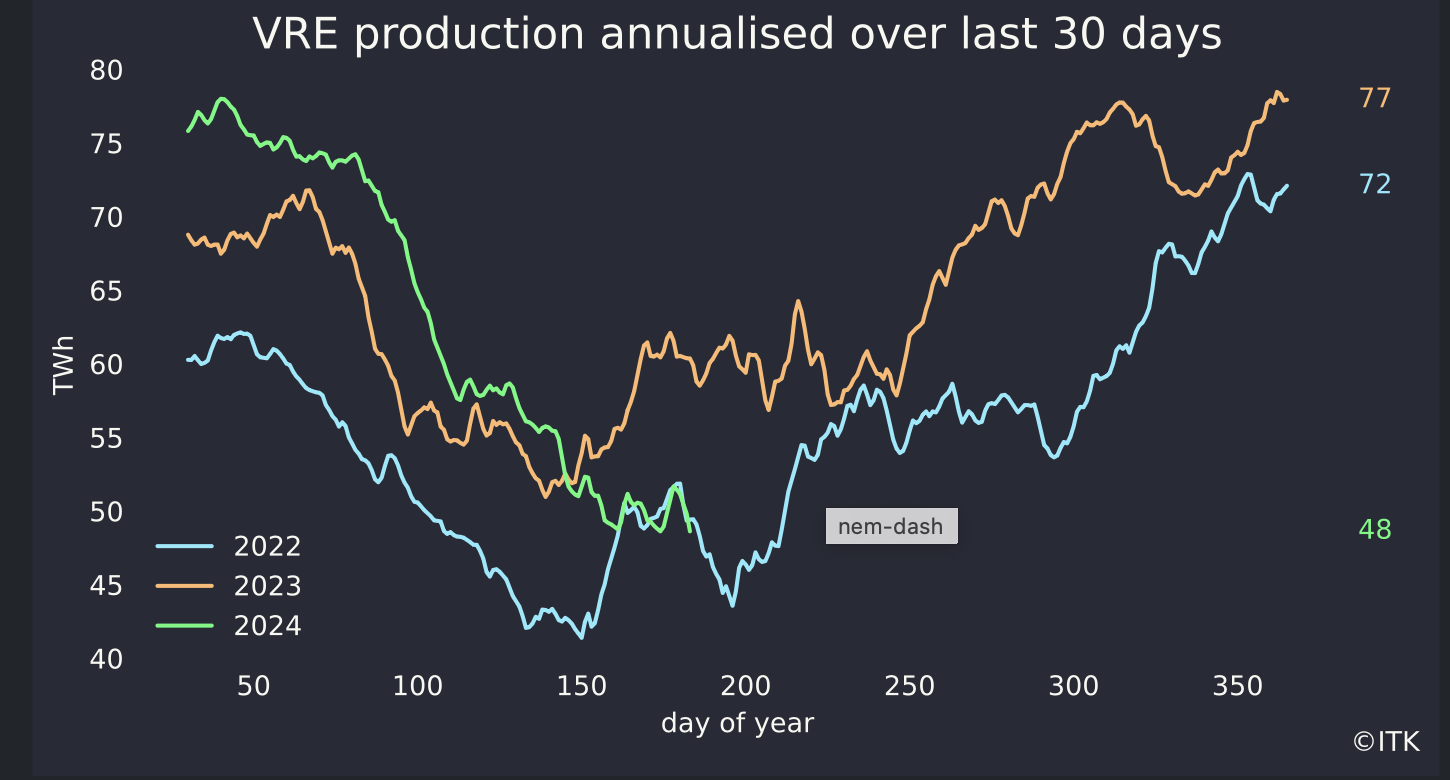
Wind actual output over the past year is 27 TWh, on 10.8 GW of capacity that works to a capacity factor of 28%. Really even allowing for older technology comfortably over 30% should be expected. I guess the difference is the wind drought, that there is always some capacity undergoing maintenance, and MLFs. Generally I do do my forward forecasts on a rosier basis.
Even allowing for this year’s worst I’ve seen in a decade and presumably unusual wind drought the 365 day total for VRE is around 31% of total energy supplied in the NEM. That’s after curtailment and MLF stuff.
And by the way since we are counting, NSW solar share is down on PCP even though capacity is up.
Putting it together and assuming all new capacity is operating within two years I get a 49% renewable share by this time in 2026. Essentially that’s close to a bankable share, leaving aside only construction and connection risks.
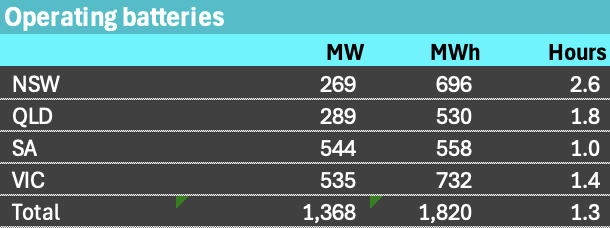
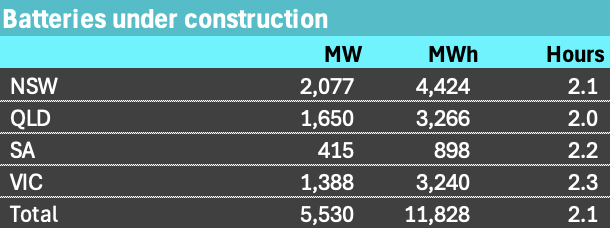
Batteries
Battery GW are increasing 400% from an operating 1.4 GW to 6.7 GW total counting the 5.5 GW under construction. The Capital battery in the ACT is now counted as operating, although some may wonder.
As impressive as that is the GWh of capacity is going from 1.8 to 13.6 a 650% increase. Batteries under construction have an average of 2.1 hours of duration up from the 1.3 hours of the existing fleet. I’ve already talked about my expectations that this will increase a lot further.
People can talk about pumped hydro till the cows come home. If Battery costs have fallen 23% in 18 months and are still falling as global capacity ramps up, I would need a crystal clear business case to compete with them. Don’t forget the generally much better round trip efficiency of batteries.
Batteries are moving from a sideshow to centre stage for setting peak prices
Right now batteries pretty much shadow price gas, in some cases demanding a premium. That’s possibly because the existing battery fleet gets more than half its revenue from ancilliary services etc. Even though some of the new batteries will be used for transmission reliability and other system services there is clearly going to be way more capacity available for day trading. I am reminded of the old stockbroking joke about Q: “how do become a small daytrader”, A: “Start as a big daytrader” nevertheless.
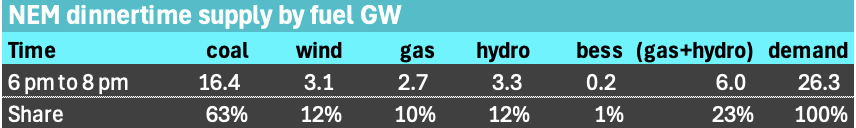
The figure below shows that gas and hydro supply a median 6 GW (23%) of dinner time demand. Even if only 3 GW of the batteries under construction start trading in that dinnertime space they will probably end up dropping those peak prices significantly, at least that is my expectation.
Equally they will represent an even bigger share of midday demand and so have the potential to lift midday prices quite a bit as well.