Victoria has done so well, but risks stumbling now.
My reading of the Victorian Draft Transmission Document 2025 suggests that Victoria doesn’t really want to do much more onshore development and prefers to have higher LCOE offshore wind and the associated jobs than to go through the work of building on the industry that they currently lead Australia in.
- Only about 4-5 GW of new onshore wind in Victoria are contemplated. See Figure 4
- The lower level of land use committed to renewable energy is a major feature of the report. See Figure 6
- There is no discussion of how Victoria fits into the NEM or the role of imports or exports. To me that is perhaps the most disappointing feature.
- The focus continues to be on developing 10 GW of offshore wind and its clear that’s what’s designed to replace brown coal generation.
- Overall demand growth must be modest if its to be based on Victorian consumption alone. See Figure 2.
- There is lots of discussion about economic modelling methodology but no discussion of the modelled outcomes. There are appendices that deal with time of day and other operational factors but for the most part I’ve formed my own opinions on those topics. The lack of disclosure on costs ,benefits and electricity prices is disappointed. Its not like the Victorian Government hasn’t had enough time to do the work.
- An all too brief review of offshore wind has not changed my view its much more expensive than onshore. In easy round numbers offshore is $200/MWh and onshore is say $100/MWh before we argue the toss. Using AEMO’s half hourly wind traces leads to a conclusin that offshore is much steadier in its output, and offshore also tends to blow harder in Winter and that’s a real advantage. Even so I’m not sure it’s what I’d want to be doing. See Figure 3
- Victorians wont see the $200/MWh. That will be hidden away in a CFD with the Victorian Govt. I estimate about $2bn a year cost to the budget and in truth when Vic Govt debt is $194 bn and climbing what’s another $2 bn a year even if it is roughly about $26 bn NPV over the life of the asset at a 7.5% WACC. Its not that big a deal. Is it? And if you allowed for the seasonality and firming benefits it might be less anyway. But not so much less that I would be doing it with my money. As if.
- Earlier I mentioned the steadiness of offshore wind. You can see the daily profile in Figure 8. Of course the downside of that is the same as nuclear or coal, running in the middle of the day will lead to very low prices (good) and economic curtailment (bad). The economic curtailment will likely mean the achieved capacity factor falls shore of theoretical just as with onshore but perhaps more so because of the greater likelihood of producing at lunchtime.
TL;DR For my money I’d rather Victorian had a less parochial view and looked more to what more onshore Victoria, South Australia and NSW could bring to the party rather than forcing Victorians to subsidise offshore wind so extensively. But I don’t have the benefit of reading the modelling outcomes , and I might be misunderstanding. I often do. No doubt if I did more work I would understand the situation better and be able to see it through the policy maker eyes in a way that right now I cannot.
Victoria has lead the way in decarbonising
Victoria, South Australia and the ACT have been the pinup team for renewable energy in the NEM. As the figure below shows, Victoria is the leading State in the NEM for wind generation and Victoria’s overall VRE share lags only South Australia, albeit NSW and QLD are rapidly catching up.
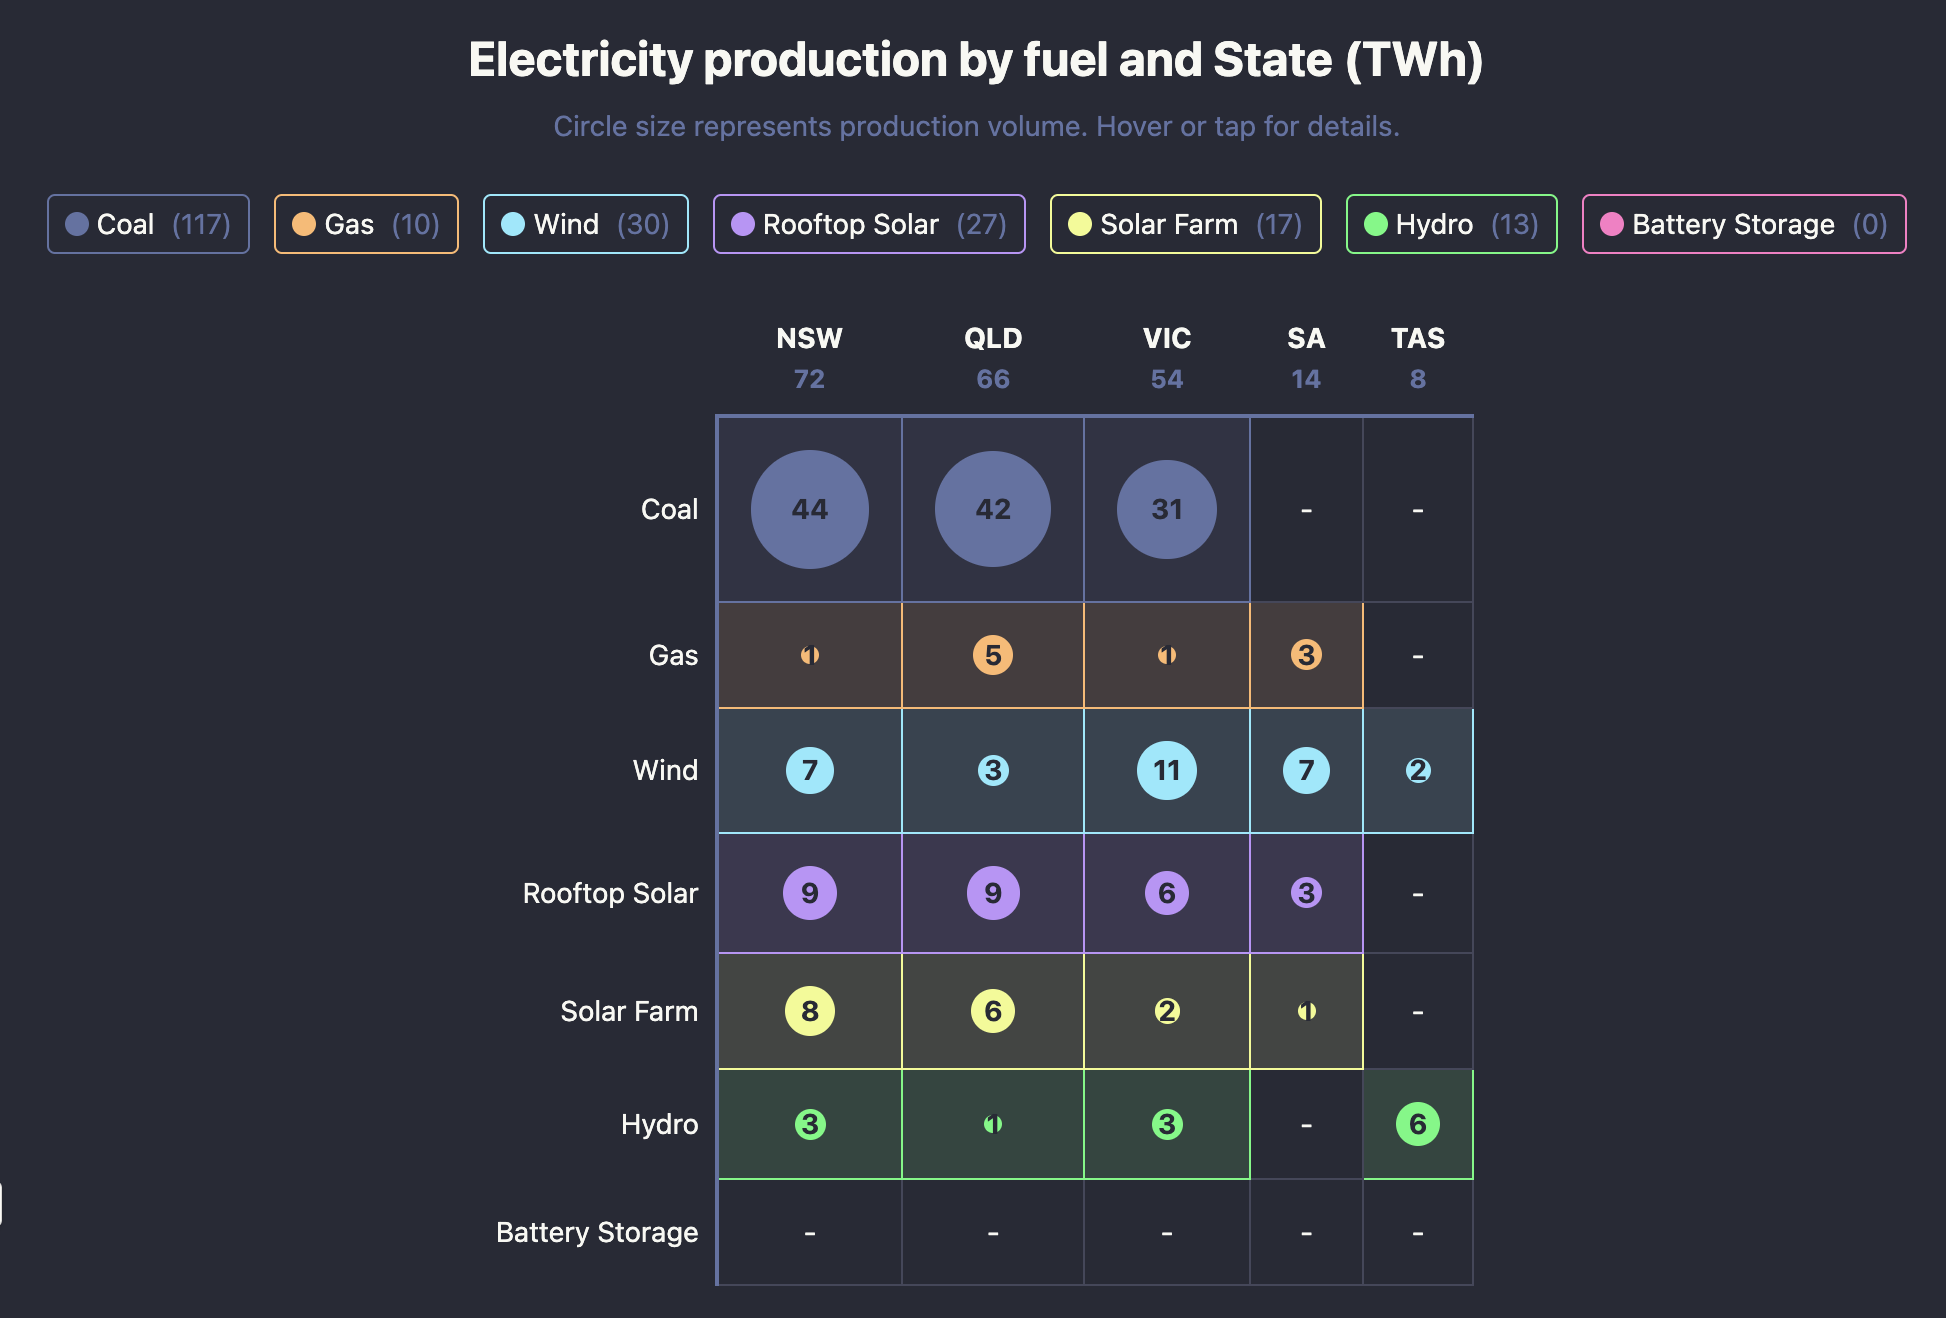
Victoria also leads the way along with the ACT when it comes to weaning the State off gas.
In short Victoria is a leader. Still there have been issues, particularly, as in most places around the transmission needed to hook up to the grid. And the issues seem to be slowing Victoria down. Simon Corbell when the renewable energy officer in Victoria was one of the first to draw attention to the growing disquiet around transmission long before it became the contested public issue it is today across the entirety of the NEM. Long after NSW and QLD have developed REZ plans and in NSW’s case started to heavily invest in them Victoria has now published a transmission development plan. The plan basically limits onshore renewables but without any justification, in this document, continues to assume most forward development will be offshore. To me it’s a plan that is parochial, not well well developed and actually the rationale is not explained. It’s like “here is what’s happening, don’t care what anyone else is doing and dont ask questions. No names no pack drill”
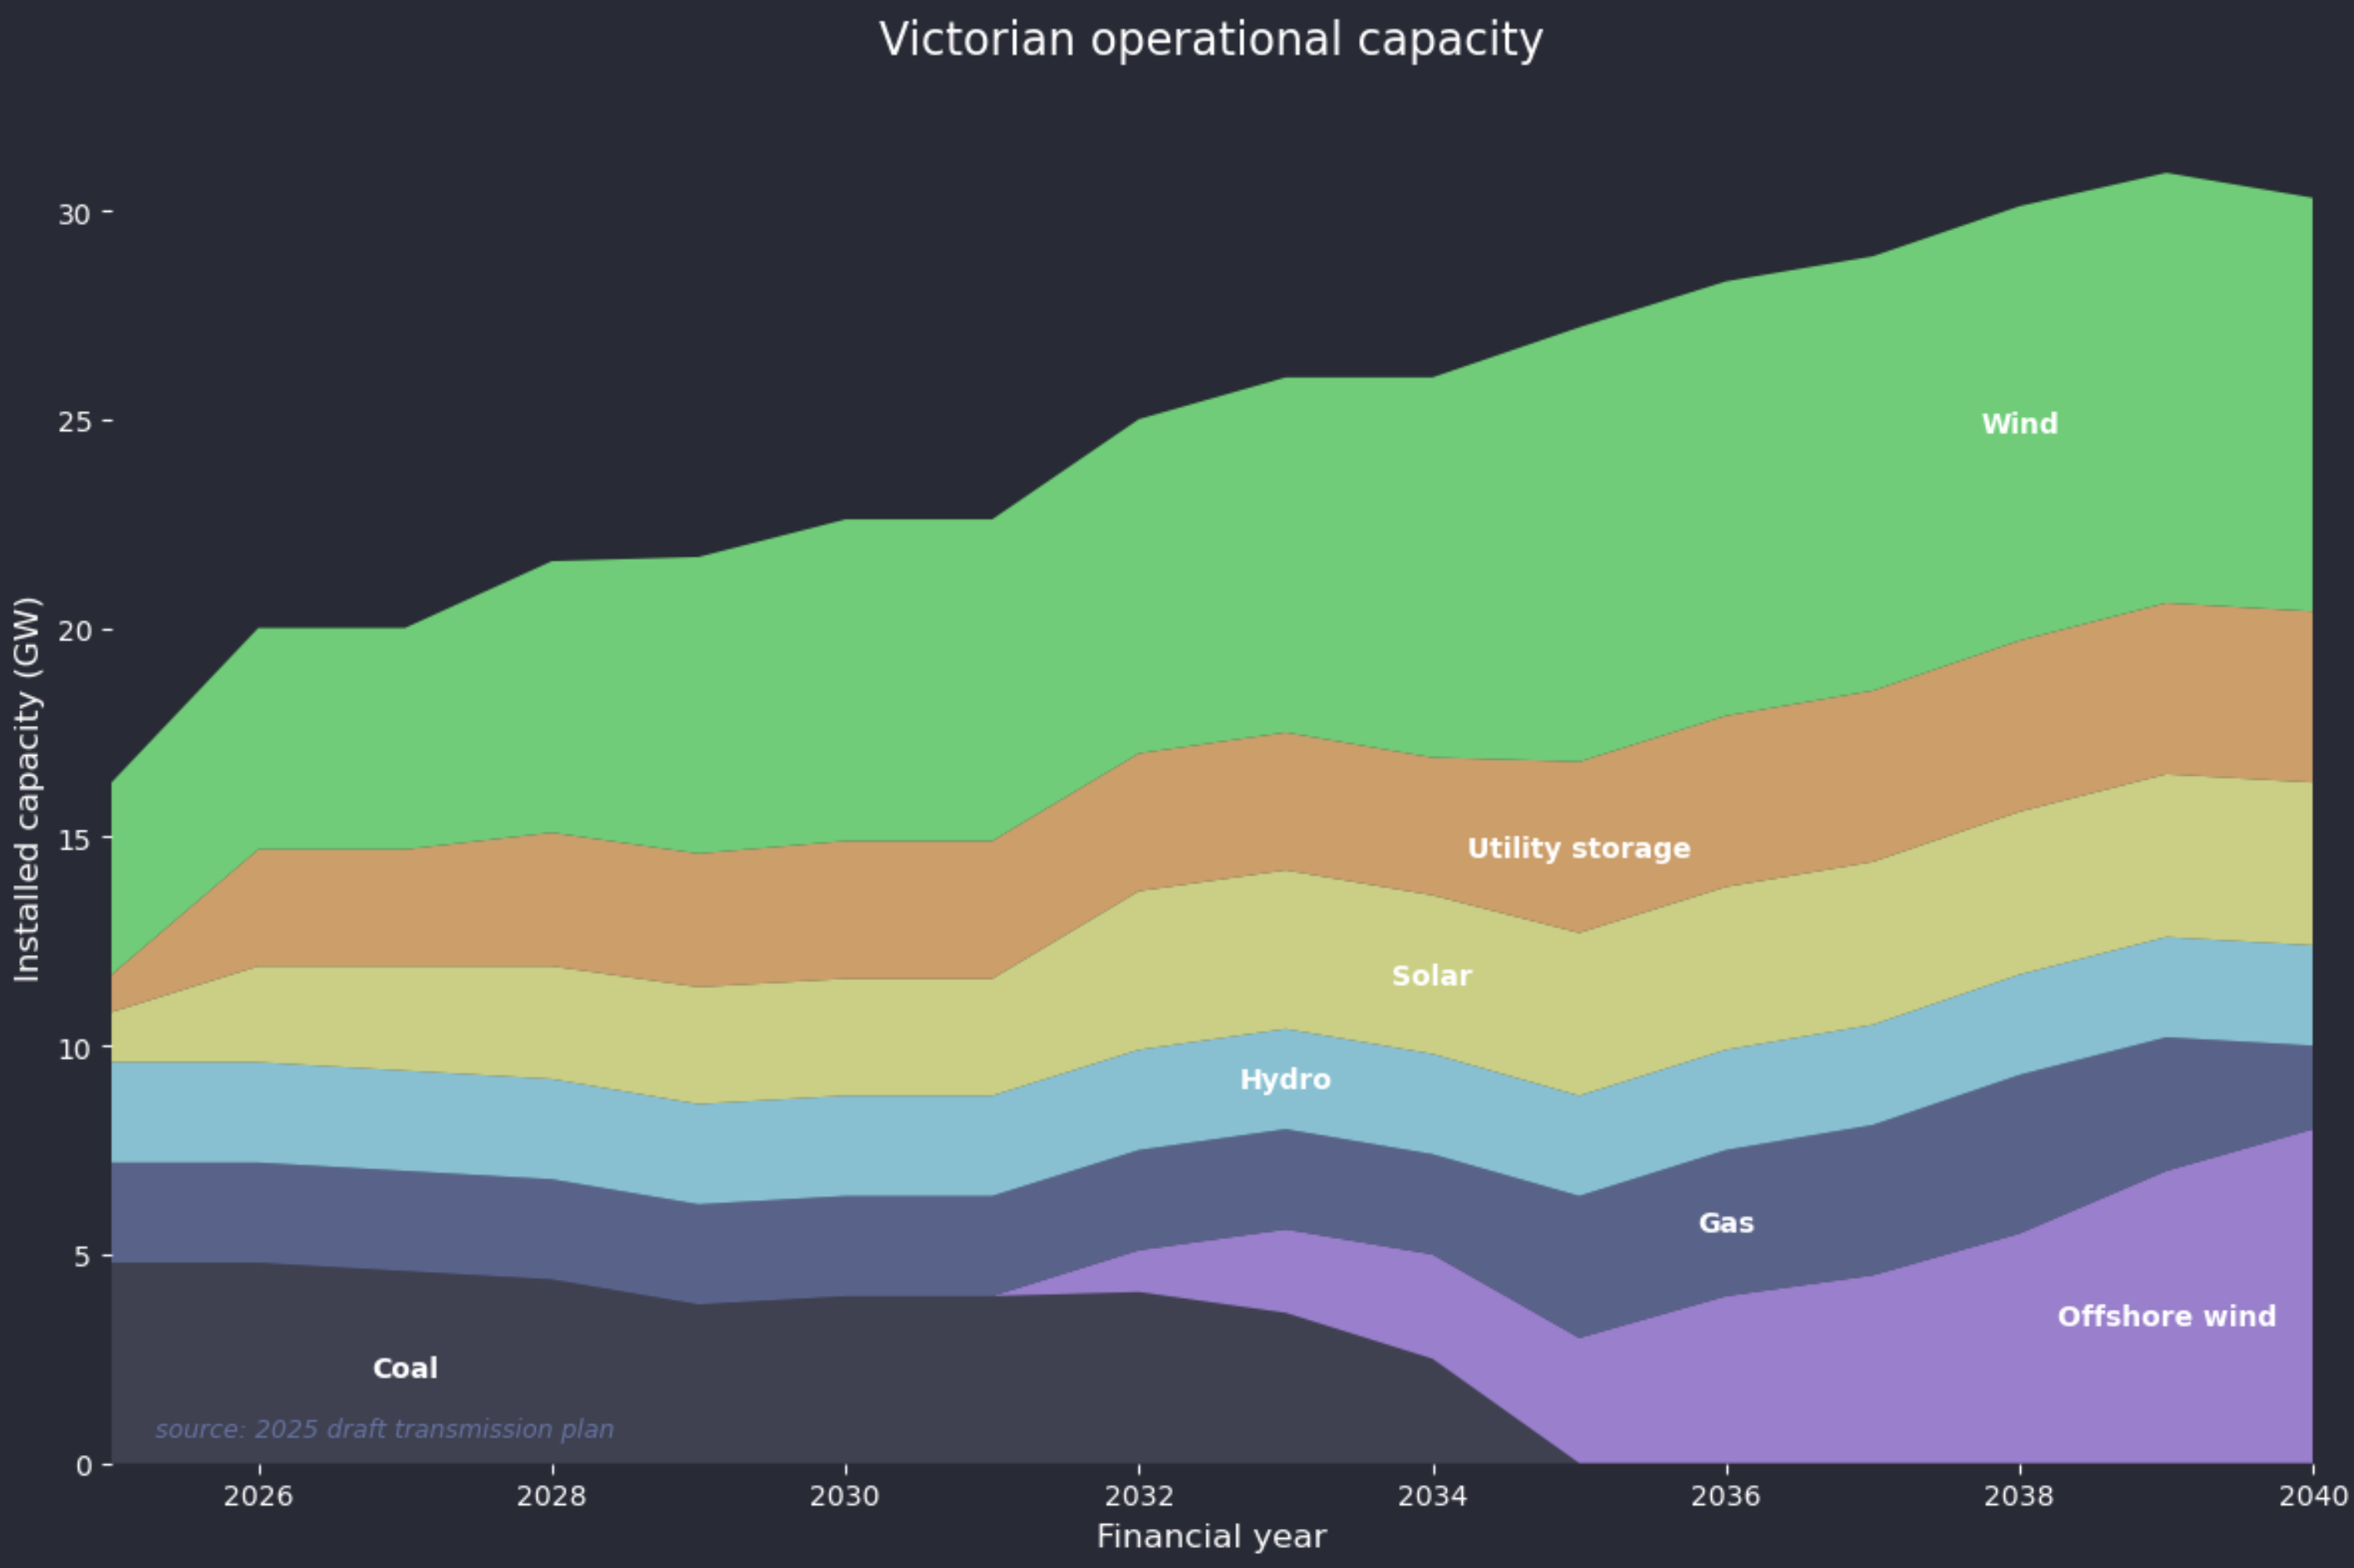
Operational power capacity grows to 30 GW by 2040
The following chart adapted from the Draft transmission planning report shows broadly that offshore wind, batteries, another 1 GW of gas and a modest expansion of onshore wind are what’s to replace the brown coal capacity.
Energy
In terms of energy the figure below replaces storage with rooftop generation. Offshore wind is assumed to have a capacity factor of 45%. Other economic capacity factors are based on latest 12 month output relative to installed capacity. In terms of output obviously there would need to be a much smoother integration of the offshore wind with the LYA and B closures but the plot is only designed to provide a general picture.
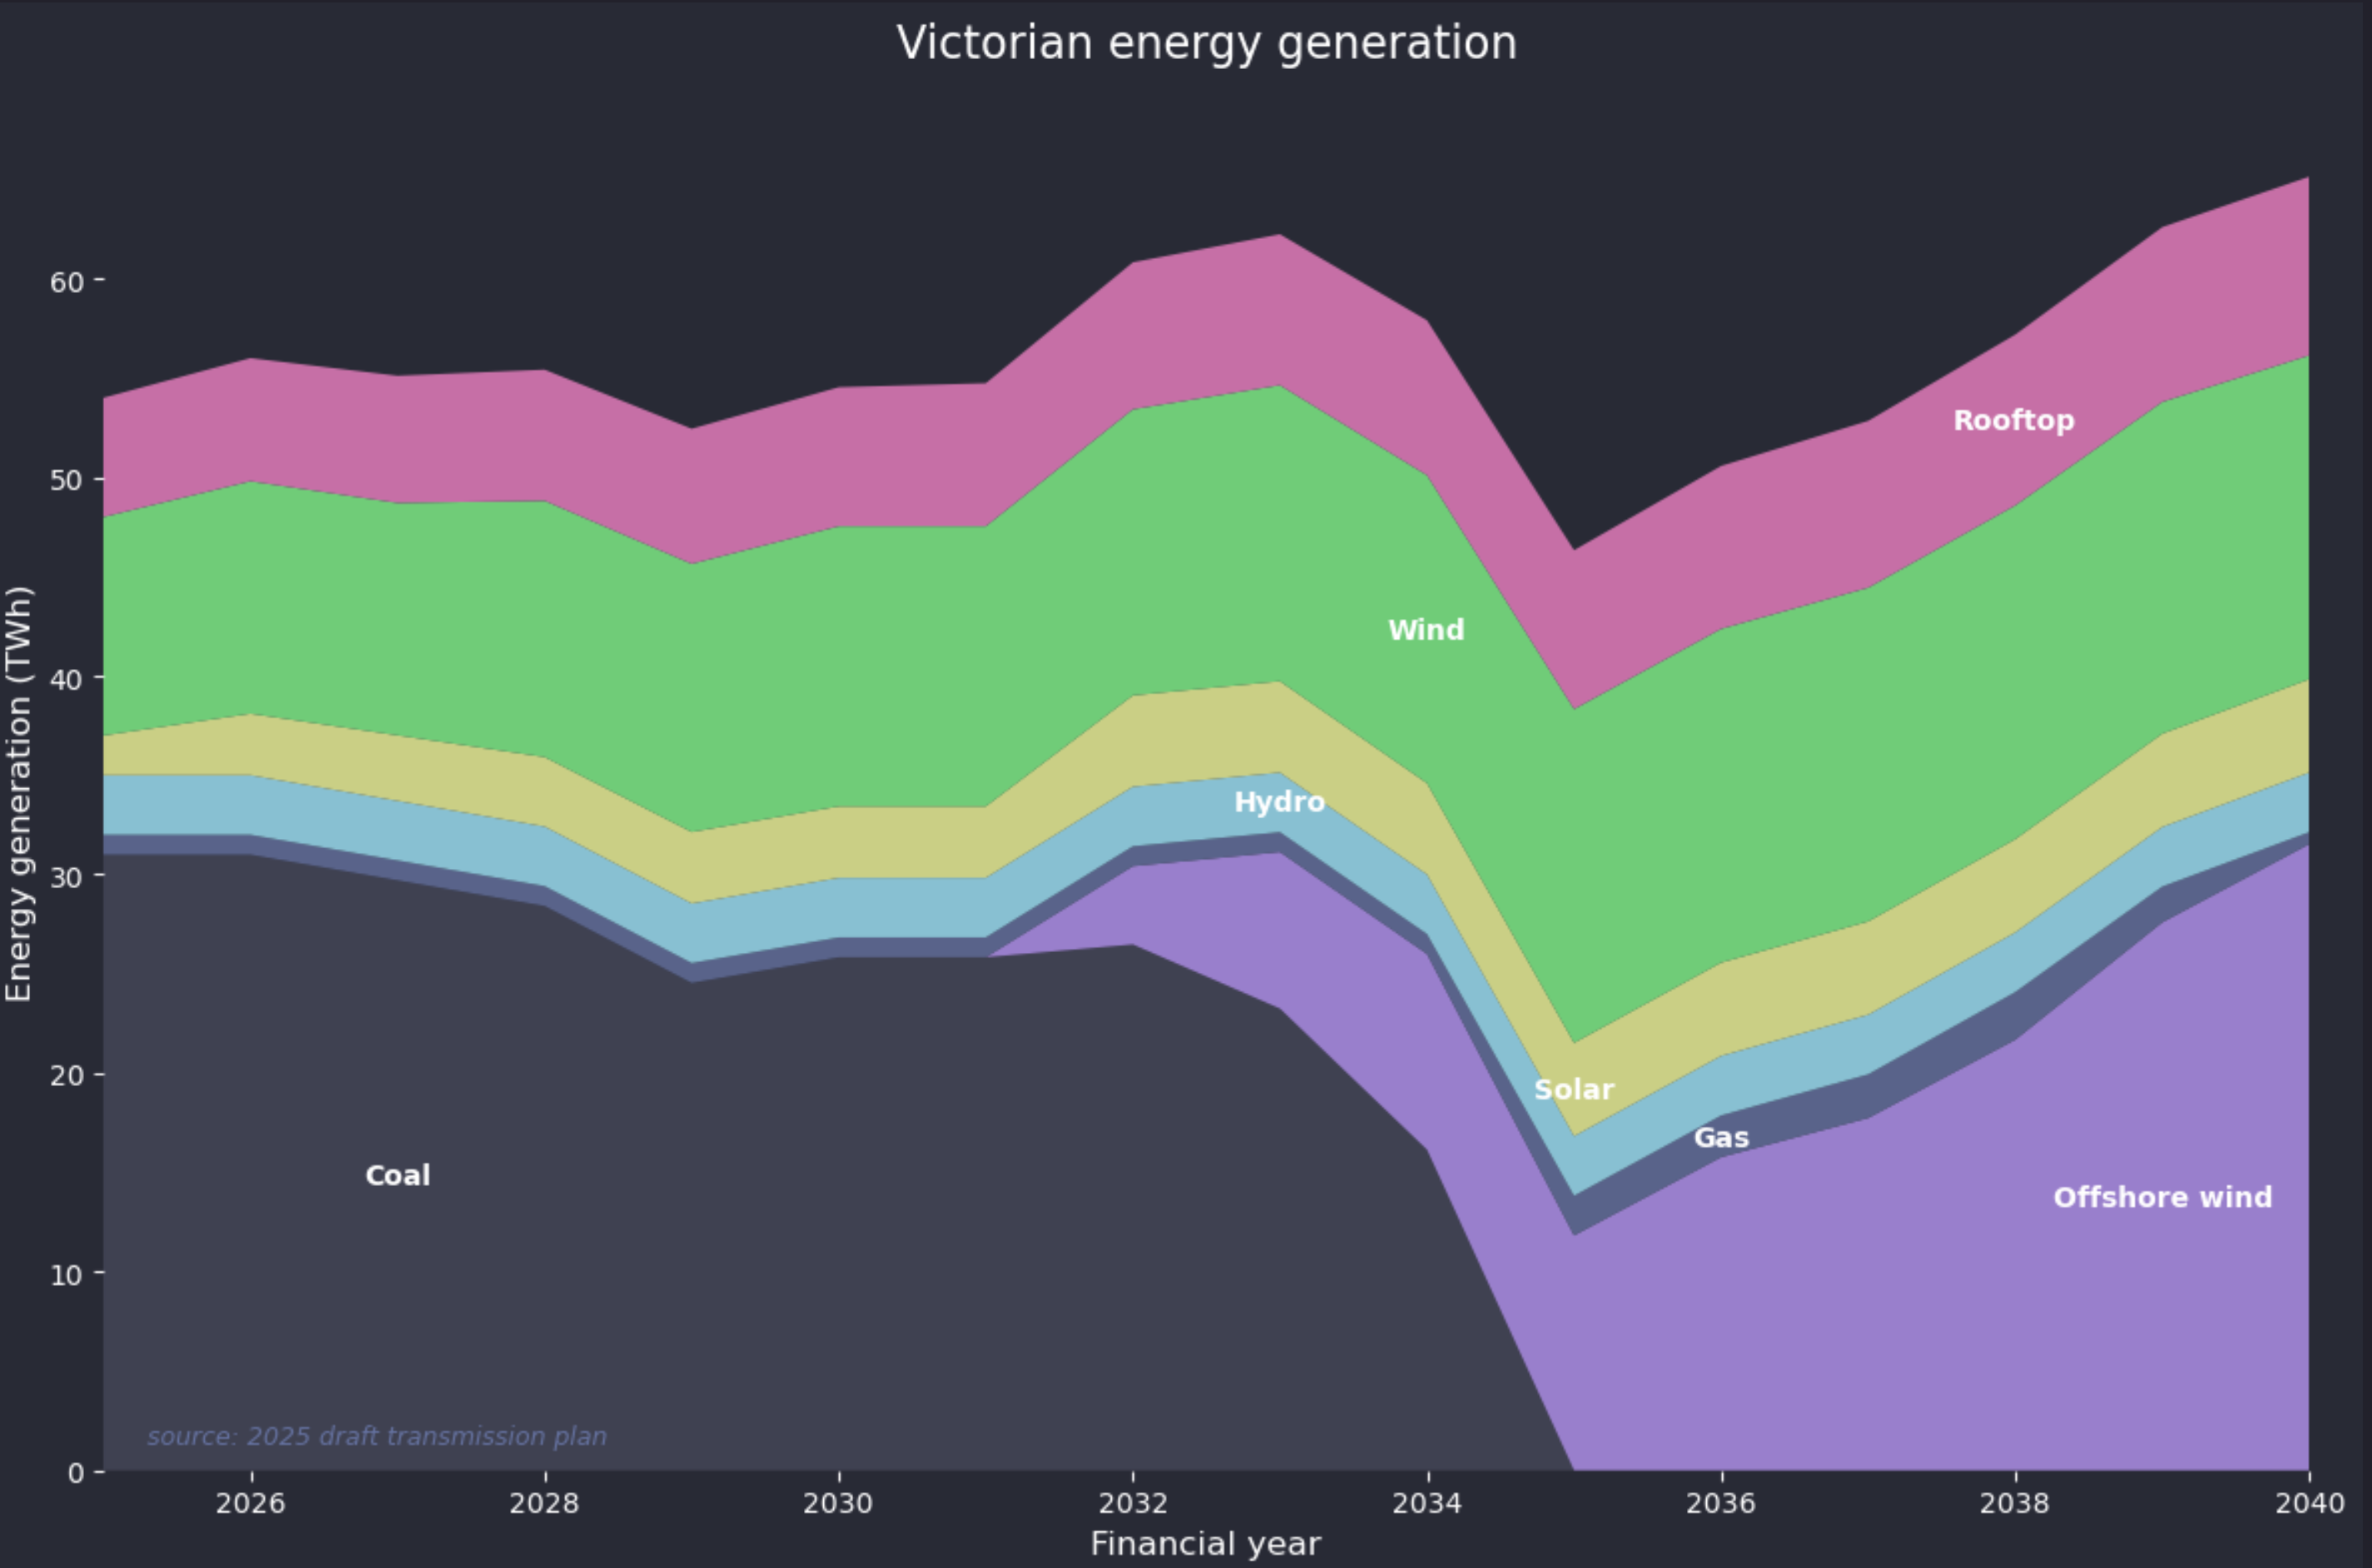
At first glance overall consumption growth looks a bit under cooked but to some extent depends on how you think about the impact of electrification, transport electrification and the future of Alcoa’s Portland smelter. Broadly though offshore wind more or less directly replaces brown coal and everything else carries on as normal. Really onshore wind plays hardly a bigger role in this plan in 2040 than it does today. Some may argue that gas will have a bigger capacity factor but (1) where is the gas coming from and (2) in terms of energy as opposed to firming power the role of gas is largely irrelevant.
Offshore wind Victoria
Victoria’s current stated explanation for offshore wind is:
“Victoria’s coastline offers some of the world’s strongest and most consistent offshore wind resources, combined with relatively shallow waters—ideal conditions for offshore wind energy. This makes Victoria ideal for offshore wind energy, which is an important part of our renewable energy transition.
Our new offshore wind industry will:
- create new jobs and career pathways
- boost Victoria’s manufacturing and supply chain development
- increase regional investment
- support our climate action goal of net-zero emissions by 2045.”
Which boils down to, it’s a good resource, provides economic activity and decarbonises electricity generation in the State. These policies and goals are consistently with those announced in March 2022 in the Offshore Wind Policy Directions Paper, however that paper has been removed from the Govt website.
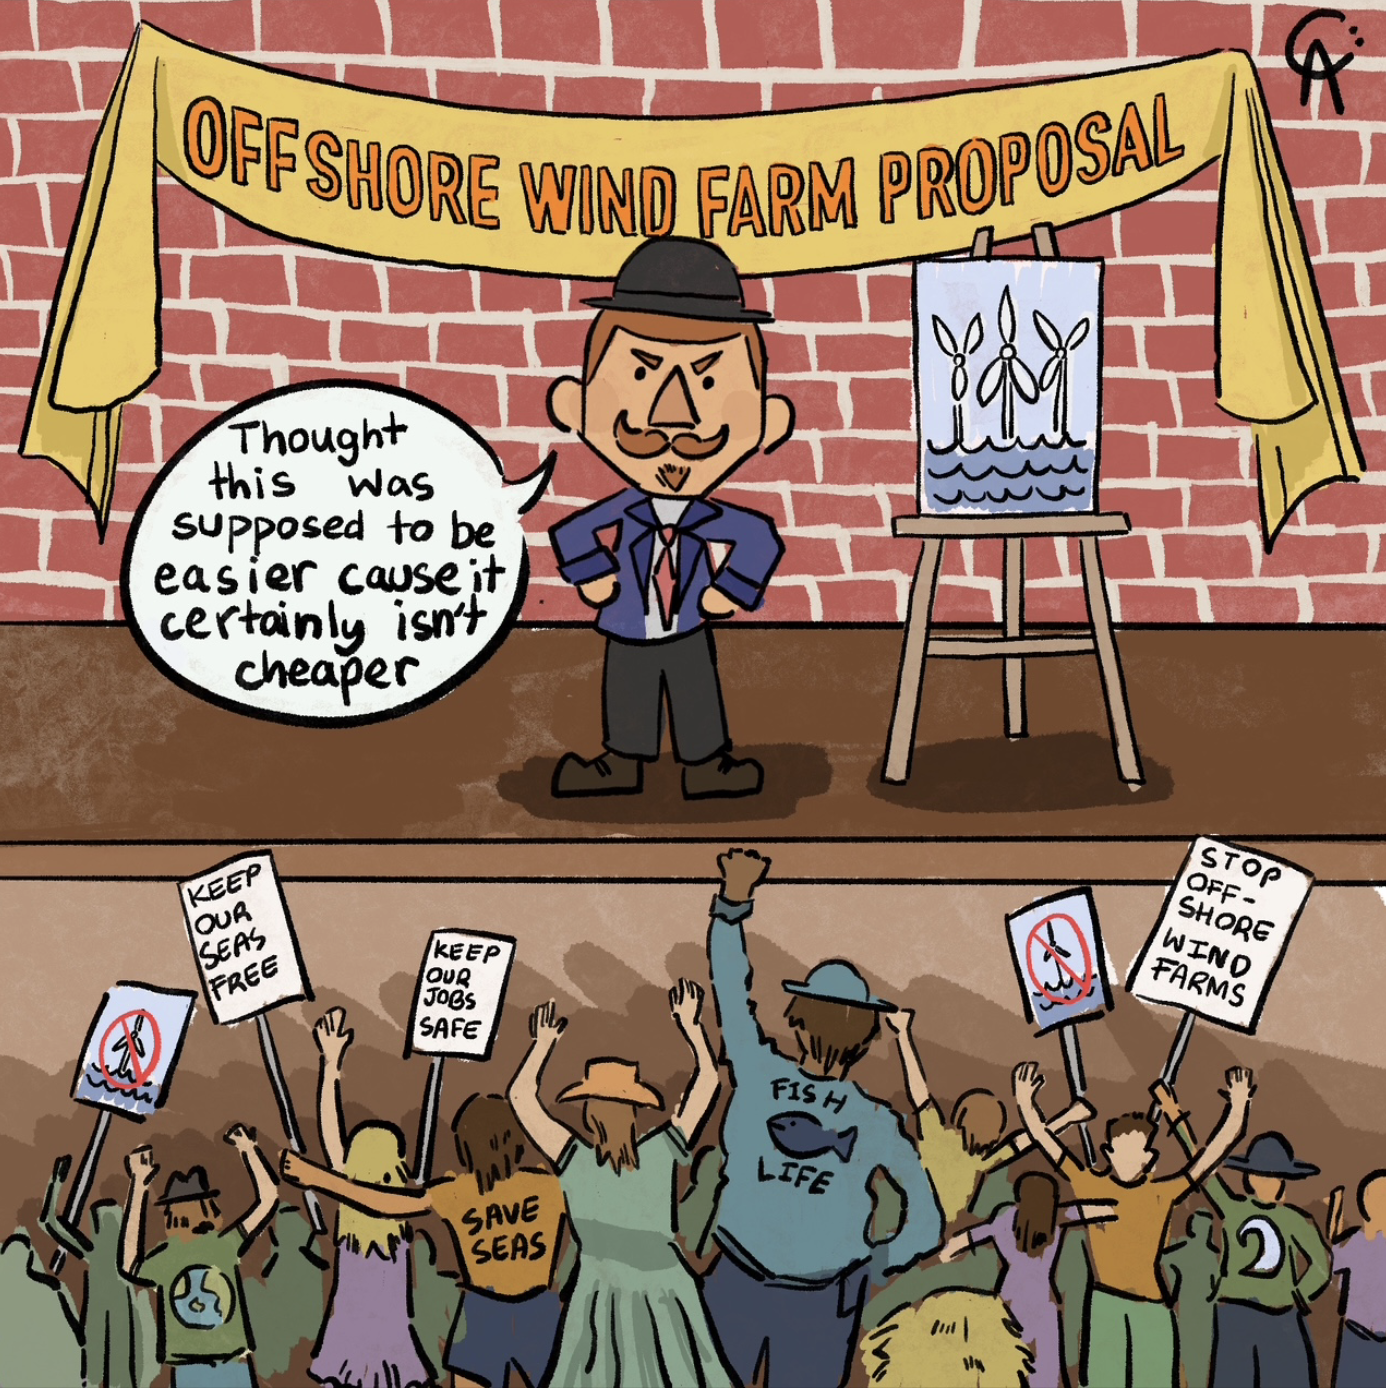
ITK believes that as well as the economic activity the Victorian Govt faced continuing opposition to onshore wind development the in the State.
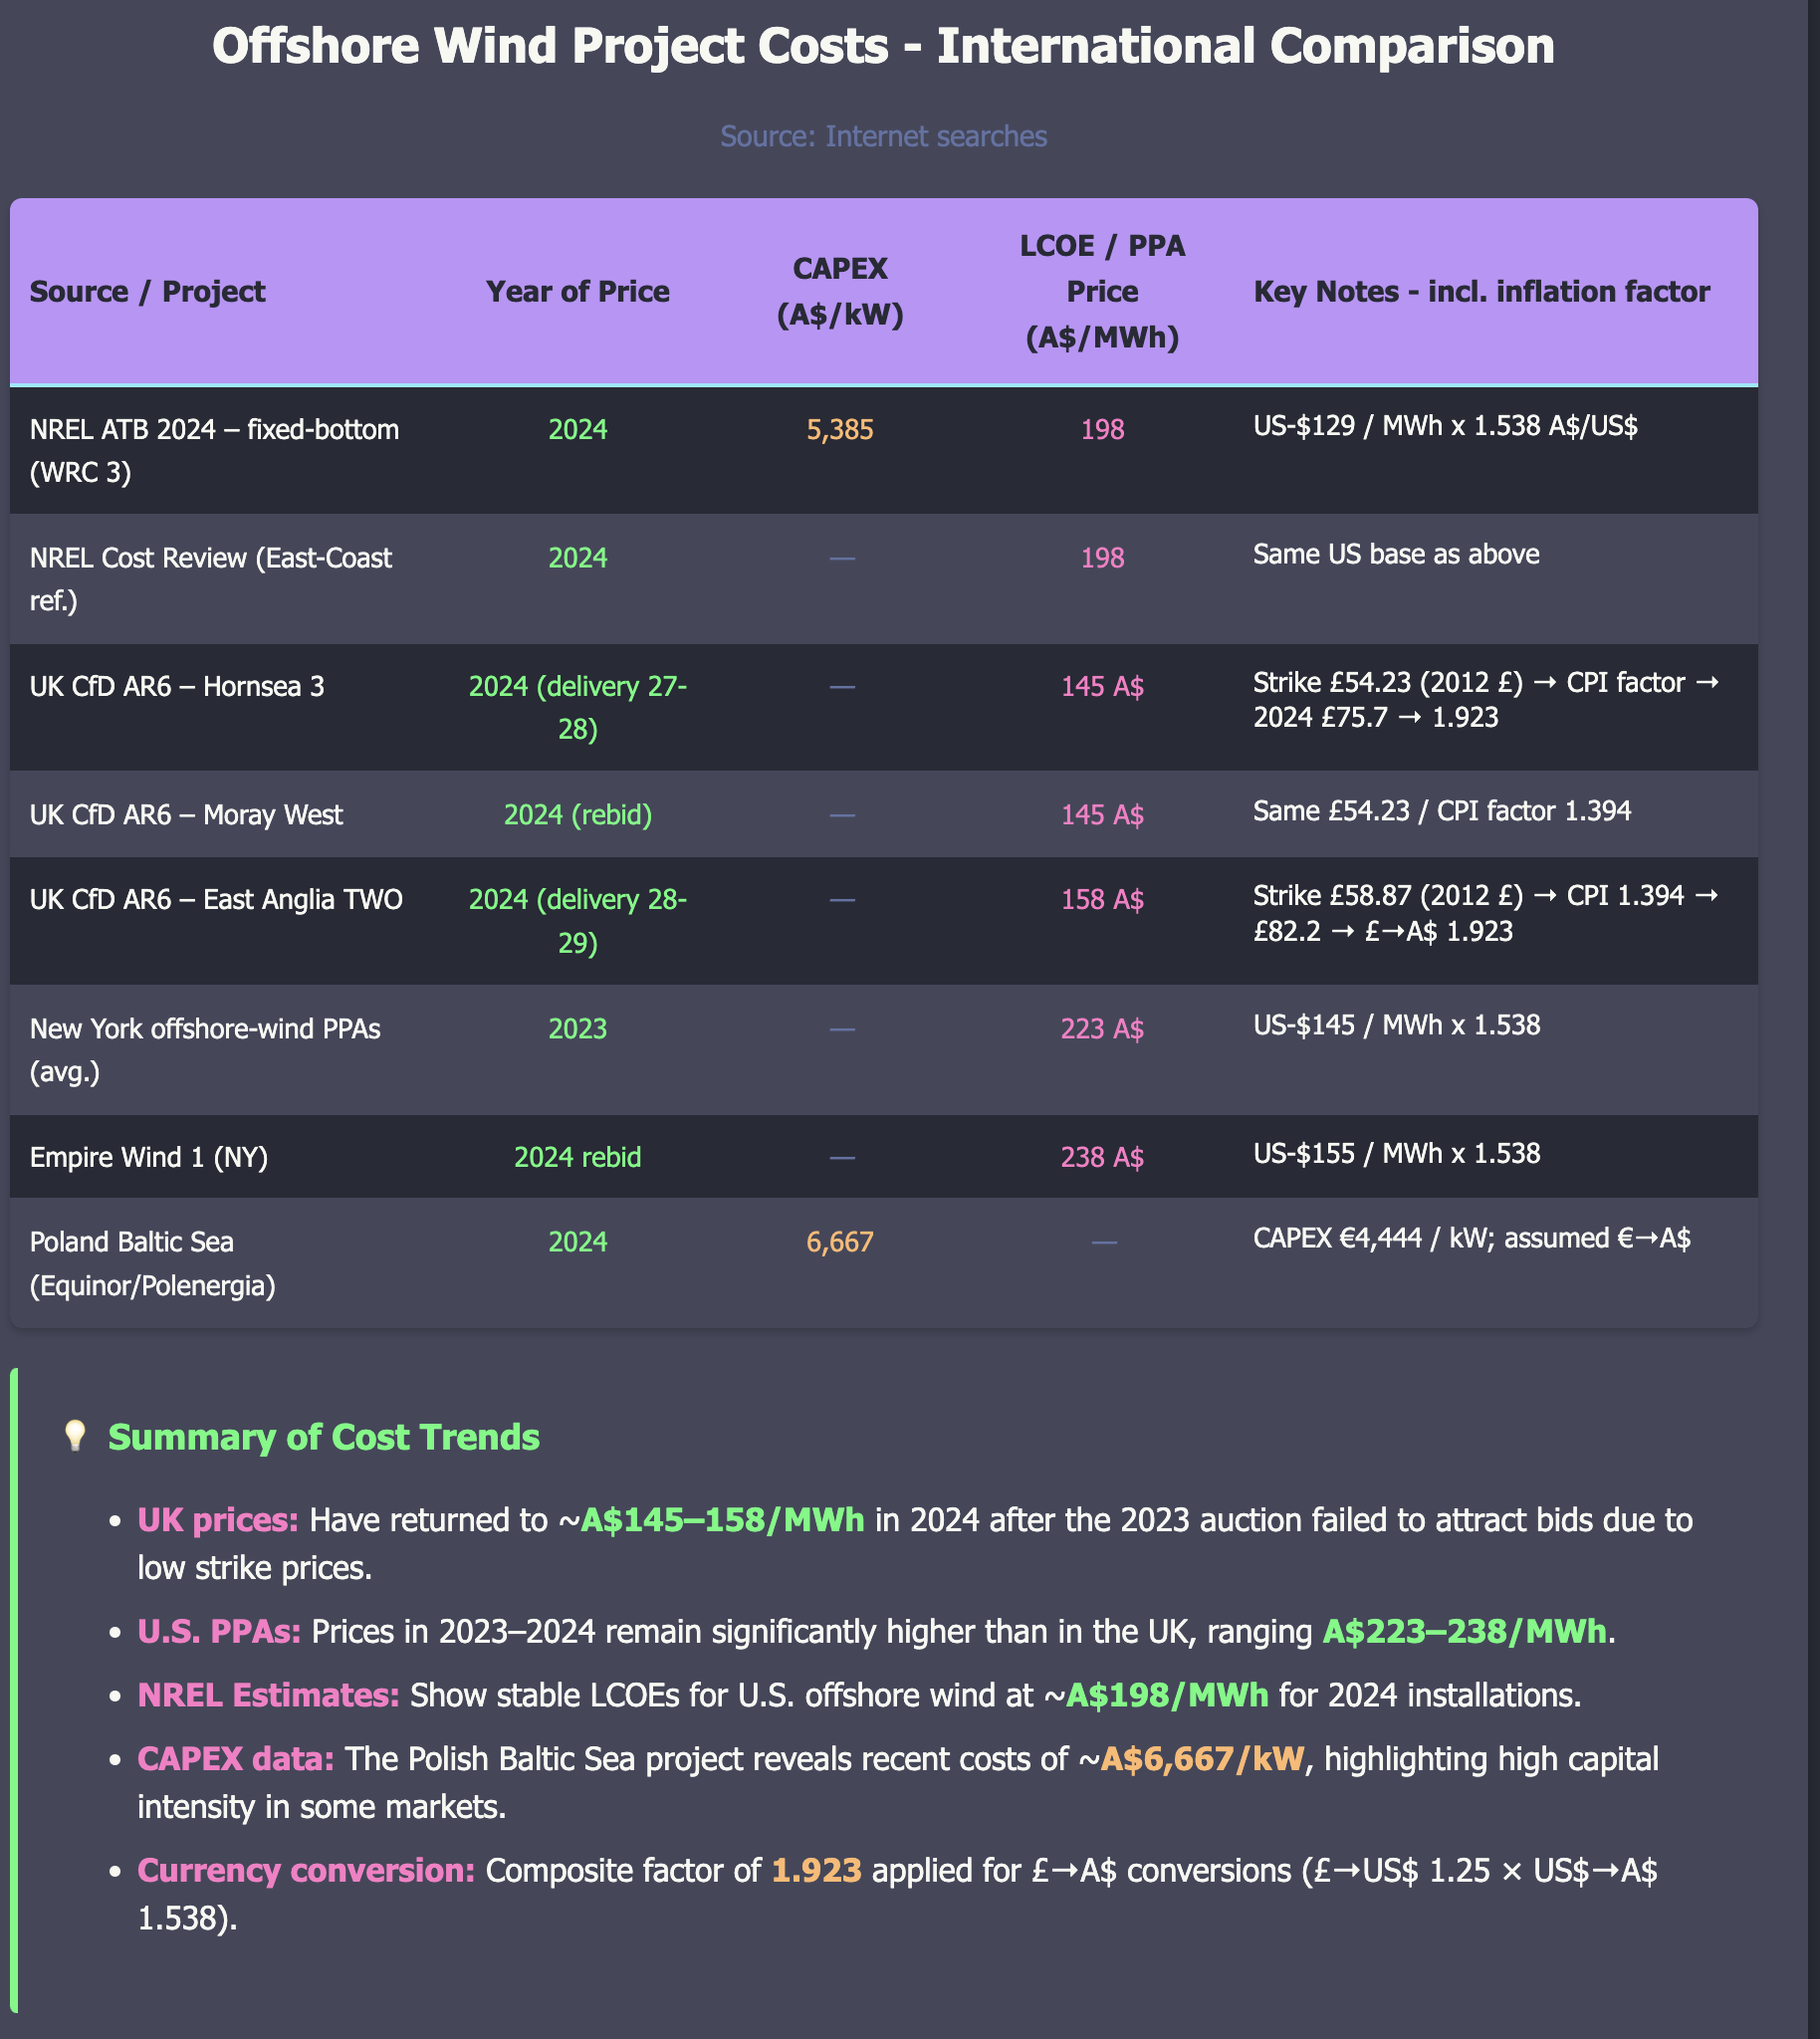
Offshore wind seems to cost around A$200/MWh
There is a wide range of cost estimates for offshore wind. Generally speaking UK costs are lower than USA costs on a headline basis. The following is a summary of data without too much examination of the underlying documentation.
You might ask why I haven’t included the CSIRO Gencost estimates. The main reason is that I think the CSIRO data is poorly presented making it hard to find the LCOE data. In addition I am not a fan of CSIRO doing some system modelling but not all of it to get their VRE fraction results. Nevertheless CSIRO uses capex of $4,6662/kW for an LCOE including its “integration” of $146-$190/MWh. CSIRO expect the number to fall a bit, but not much by 2030. The quoted range for 2030 is $90-$178 so effectively useless for decision making purposes even if it is a good estimate of the range which based on the offshore data I have me doots aboot.
The available and limited data for offshore wind in China suggests its a lot cheaper (sub A$100/MWh LCOE) than Europe or the USA but I know which region Australia is more likely to follow on a cost basis and it ain’t China. Also so far China offshore wind is in very shallow water, and uses lower WACC and so on.
In comparing USA and UK differences apparent in the above table In general UK related water depths are sub 30 metres those in the USA might be double that. The UK supply chain is well developed and there are financing and policy differences specifically policy in the USA is fairly uncertain.
I did some web searching for Star of the South’s water depth and the best estimate I can get is 35-45 metres noting that every 10 metres adds about 5-10% to cost due to longer piles and heavier steel and larger installation vessels. In ChatGPT’s opinion its a “midrange” fixed foundation offshore water project.
Taking all those factors into account I am still inclined to think closer to A$200/MWh for LCOE, perhaps with more experience we might come down the cost curve. Victoria has never been a low cost State, its highly unionised and I’ve never met a company executive yet who rather develop in the Bass Basin than say onshore QLD.
Consumers won’t see the LCOE
No consumer or retailer in Victoria is going to sign a PPA at say A$180-$200/MWh that job will fall to the Victorian Govt. Broadly speaking I estimate that the net cost difference v onshore development is going to be between $50 and $100/MWh and I think closer to $100. Let’s call it $75/MWh. For that you get apparently 6000 jobs, and if that’s true I’ve probably underestimated the costs, and perhaps a happier regional population. You also get less firming need and better seasonality. ITK can and does model out the firming for different supply mixes but its beyond the scope of this article.
Regional landowners will miss out on their economy getting developed and some farmers are going to lose out big time with turbine site rentals at say $50k each per year. As climate change makes droughts and floods more frequent the loss of regional income as opposed to fly in fly out workers in Bass Strait is not necessarily a social positive in my view but hey I am just a keyboard apparatchik.
Overall though using the $75/MWh and with say 30 TWh f offshore wind that’s an annual cost to Victorian finances of about $2.2 bn a year. In the grander scheme of things where Victorian budget debt was last seen dropped overboard as a $195 bn lead anchor another $2 bn a year may not seem all that significant. NPV about say $22 bn at 7.5% discount rate from the day commissioned.
Nor do I think something like the CIS will actually work for offshore wind, because its not the debt cost that needs covering so much as the equity return and why would you sign up for offshore wind if you could write a PPA with an onshore provider at a significantly lower cost? So that in the end I suspect the PPAs will be rather vanilla CFDs whereby the Govt pays to the developer a price that recovers LCOE. The developer sells the output in the market at the much lower marginal cost.
Impact on pool prices - they will go up, maybe quite a lot.
Offshore wind will sell into the NEM on whatever basis the NEM is running post the Nelson Review, but let’s assume its an energy based market similar to today.
Generally speaking offshore wind is a price taker much as onshore wind and solar and will likely face curtailment for negative prices and at least other economic causes, although I don’t know what the latter might be.
As in the present regime prices in Victoria will be driven by solar in the day and by firming at night. ITK thinks that firming will set the price a bit less often given the total quantity of wind and offshores known portfolio benefits when added into onshore wind and taking demand into account. Still if we look at NSW, QLD and SA achieved firming prices today are quite high typically in the $200-$300/MWh range. Let’s say $250 for Victoria post the offshore wind development and closure of coal.
I want to suggest that if solar sets the price close to zero during the day time and that at best the price is around $250 the rest of the time that (1) Victorian average prices will be materially higher when compared to this year and (2) Economic curtailment will drive down the offshore wind revenue.
Dont forget when I write such things I am huge fan of renewable energy and strongly believe a decarbonised electricity grid will be able to undercut both gas and coal based grids such as are found in the USA and China respectively. But at the moment the evidence for offshore wind being the preferred economic choice is minimal.
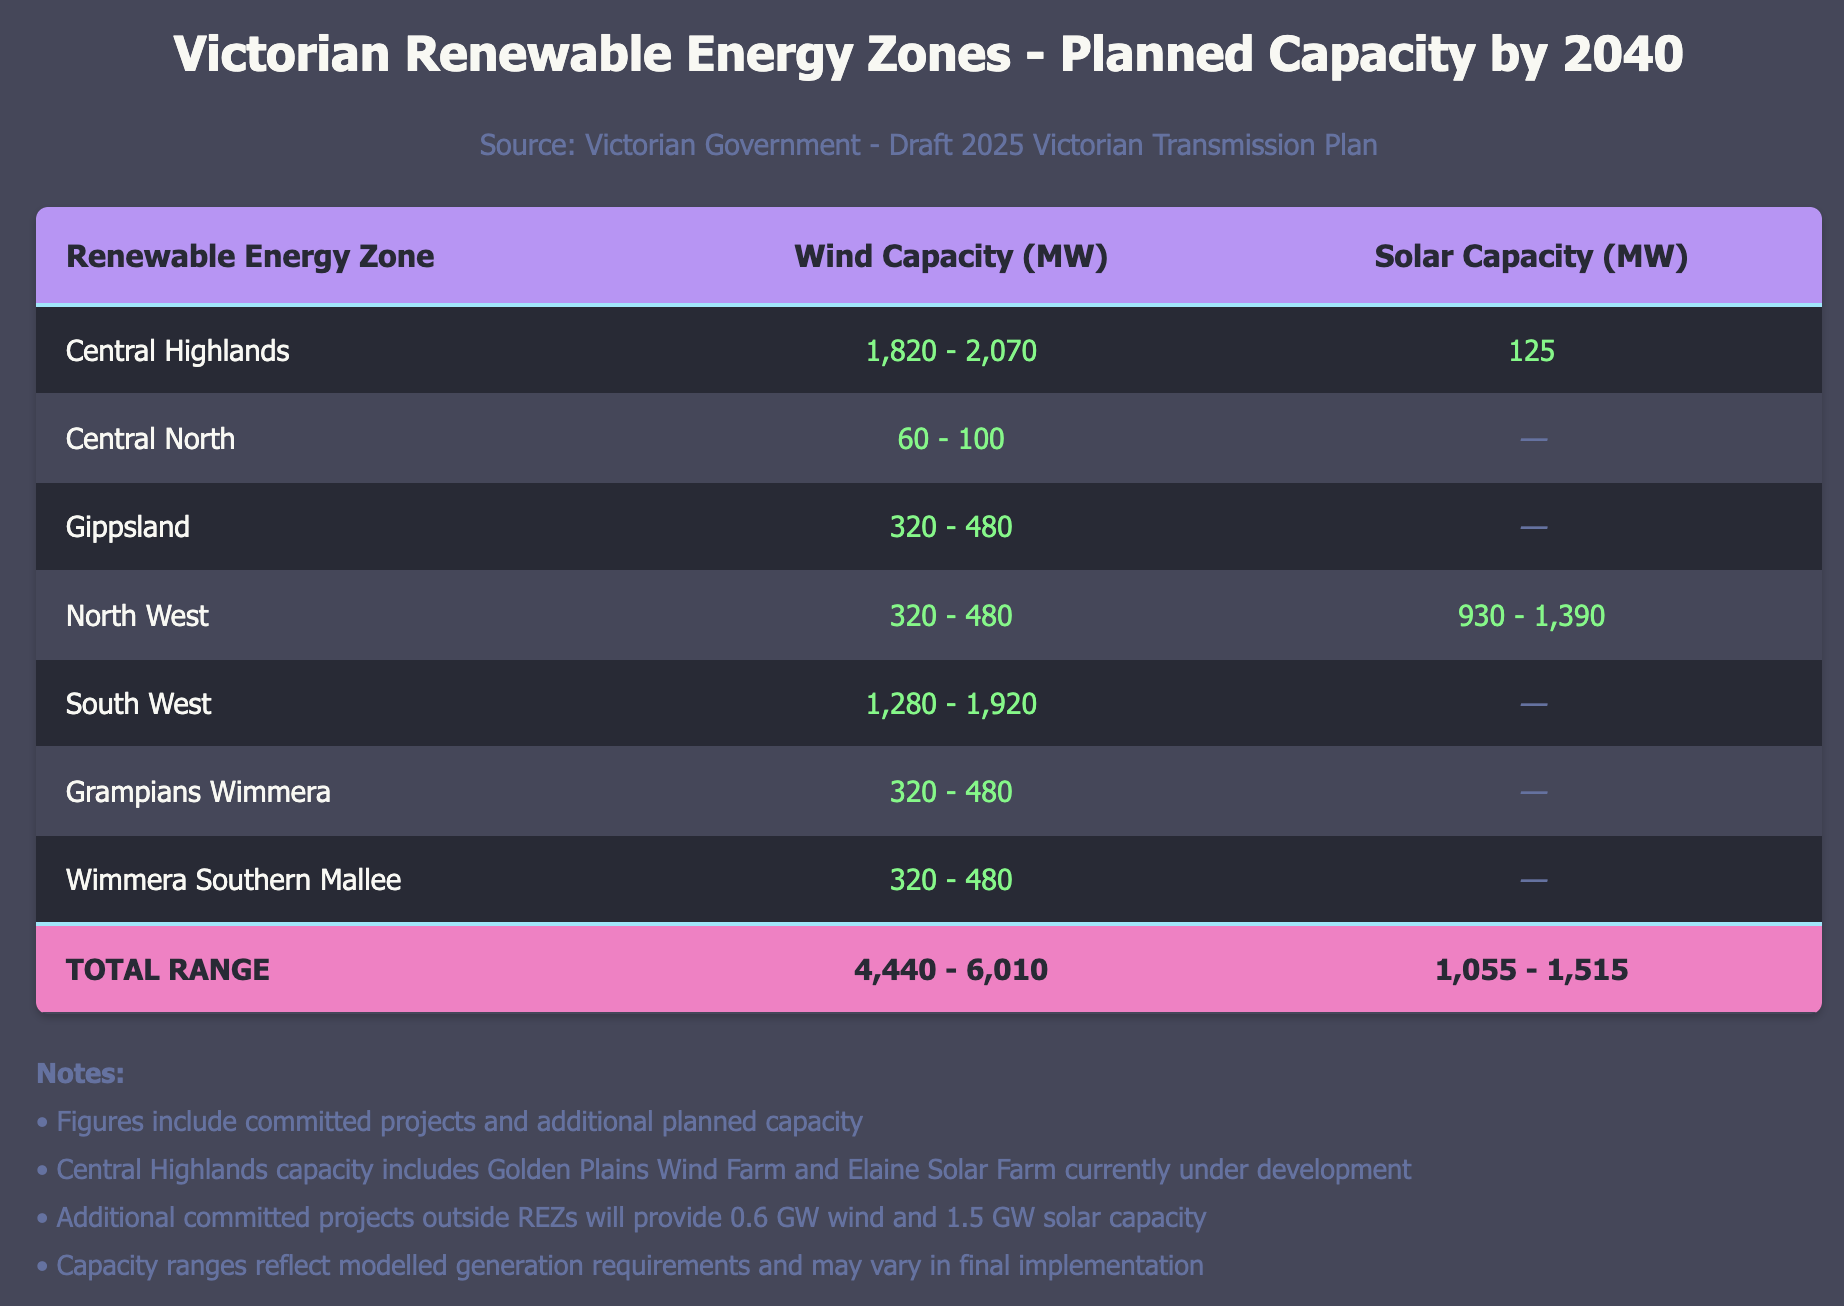
Victoria’s REZs much reduced compared to the ISP
In my opinion the Victorian REZ plan is entirely inadequate for the development of onshore resource. The potential hosting capacity for new projects is potentially about 5 GW or even less once allowance is made for Golden Plains (stage 1 commissioning, stage 2 under construction) being included in the plans. The Orana Zone alone in NSW will provide as much capacity as the entire Victorian proposal.
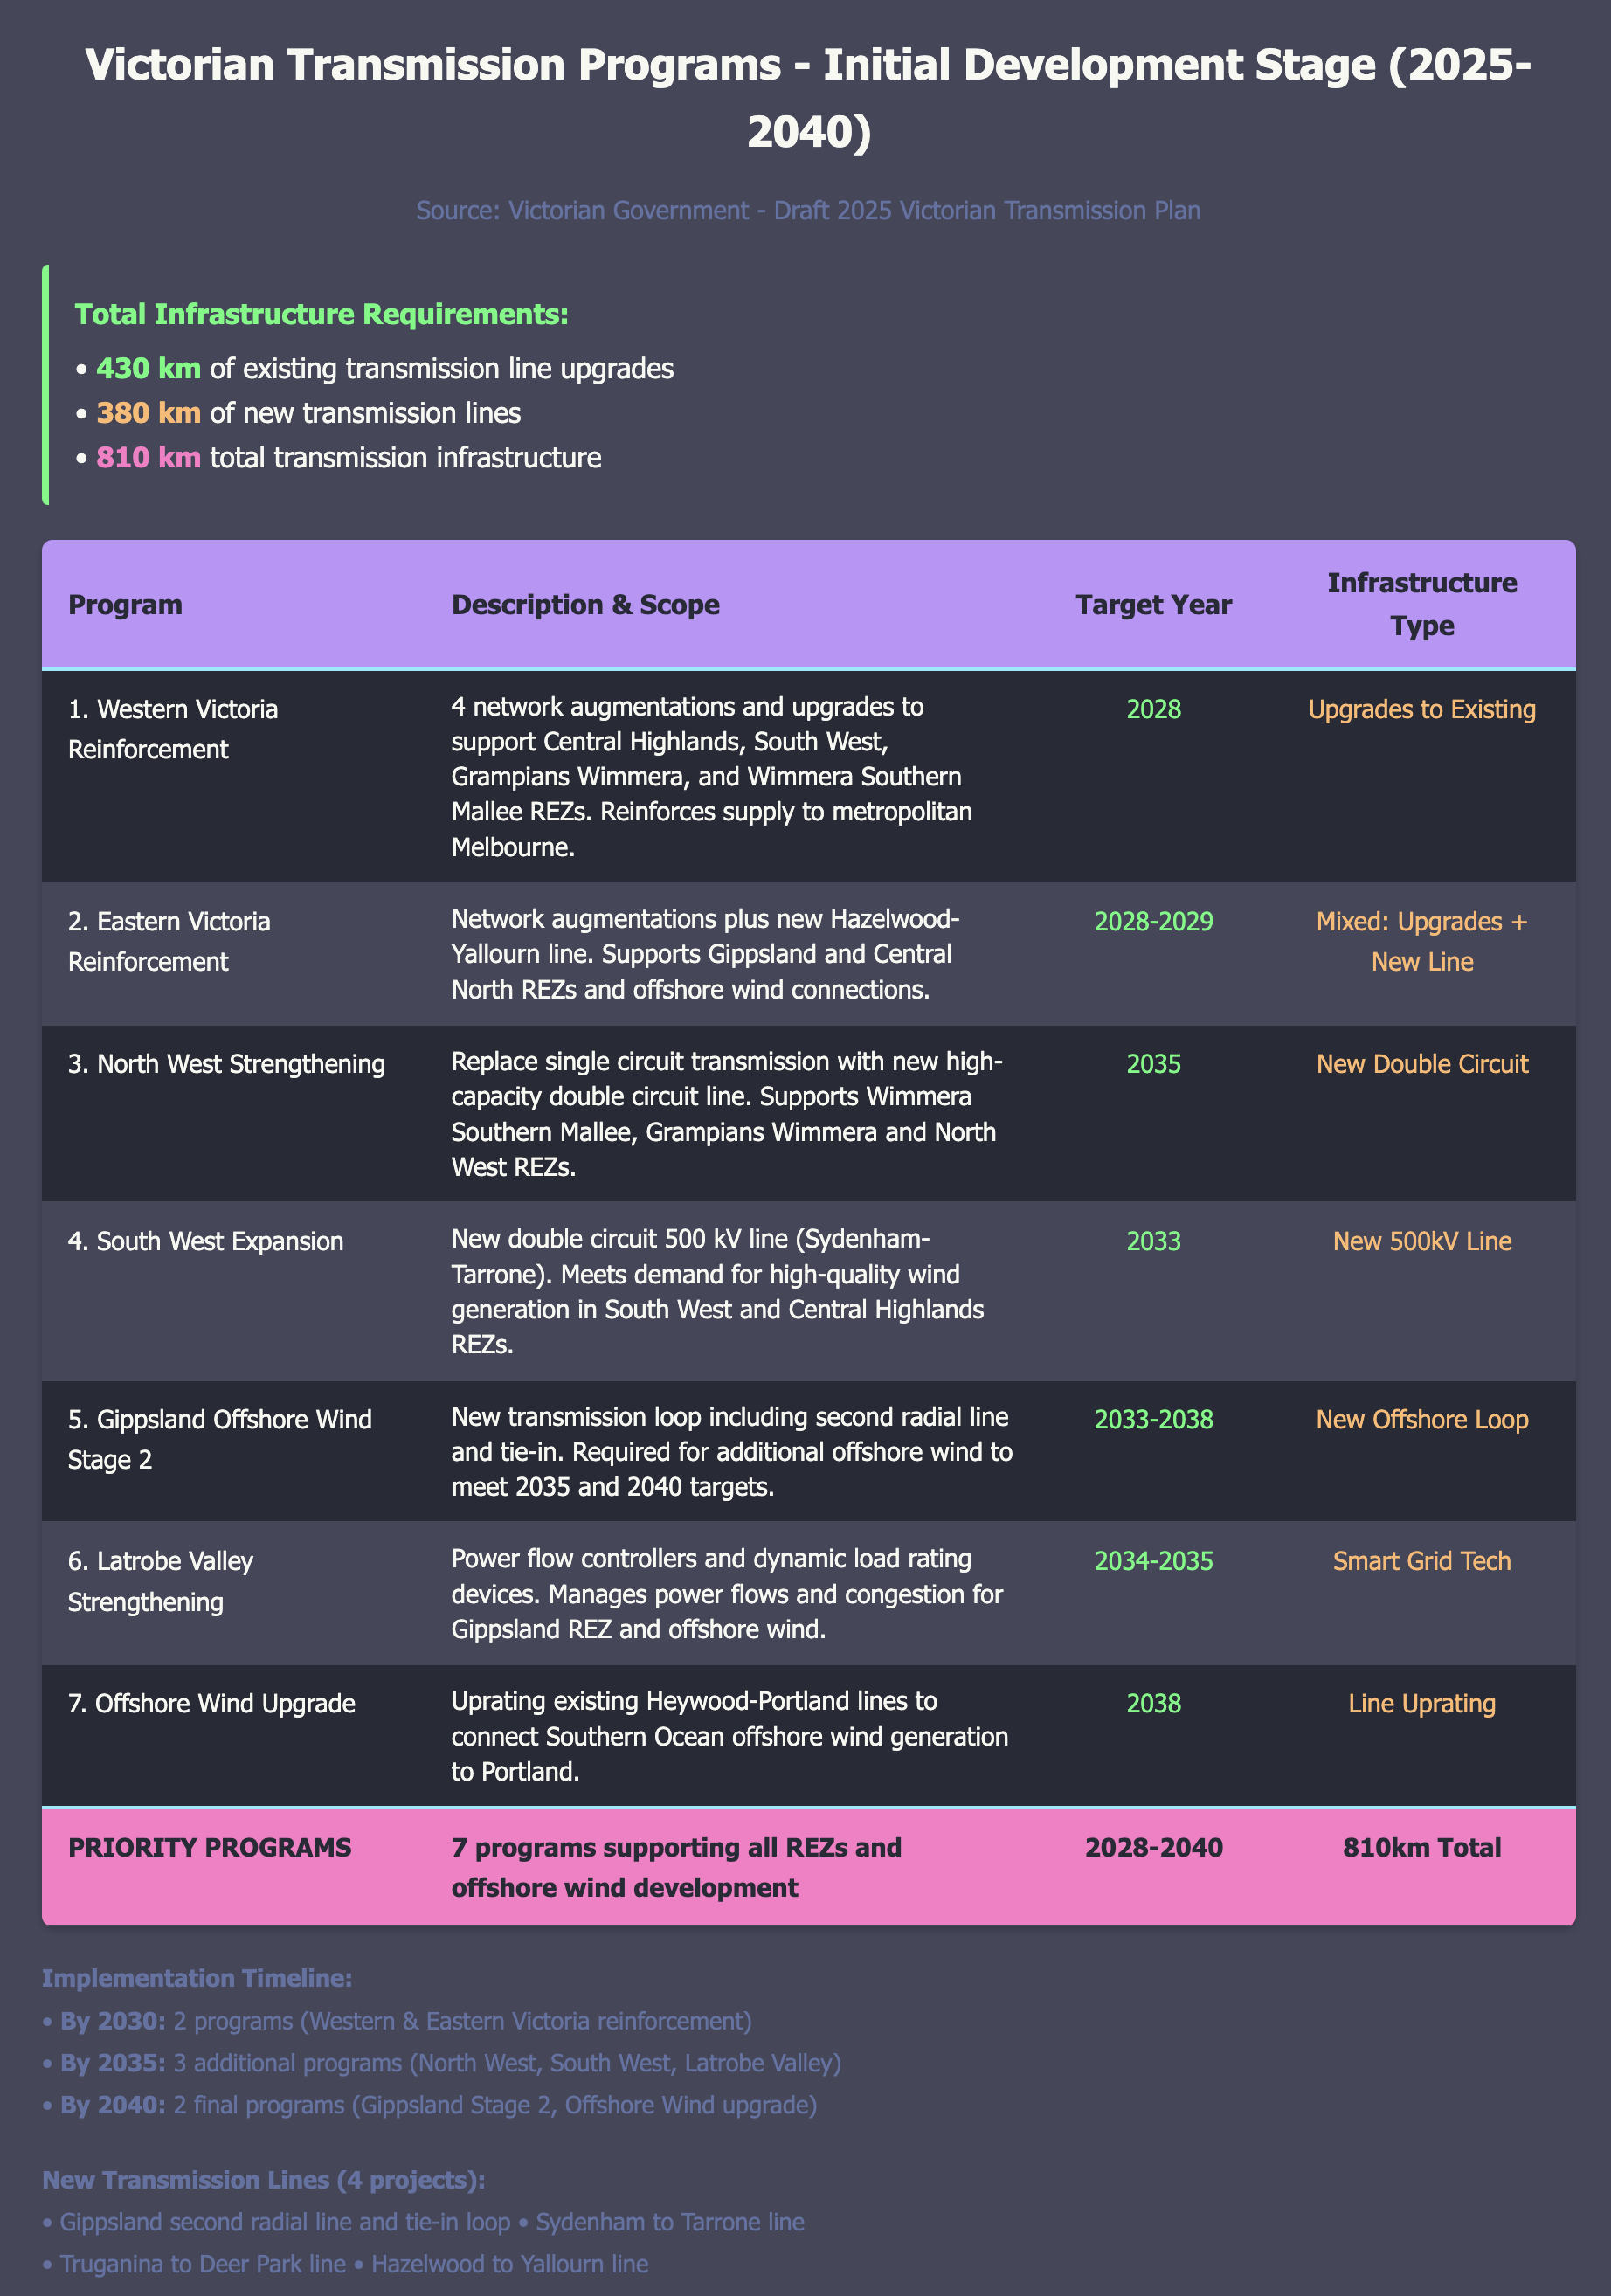
In addition the scope of transmission works is for the most part fairly minor in stage 1 virtually all of the 380 km of new transmission is deferred to stage 2. And in general the timeline for the transmission is lagging.
## By inference the Victorian Government is concerned about land use from onshore renewables
The Victorian Government itself has just released data showing how much land area is required for wind generation.
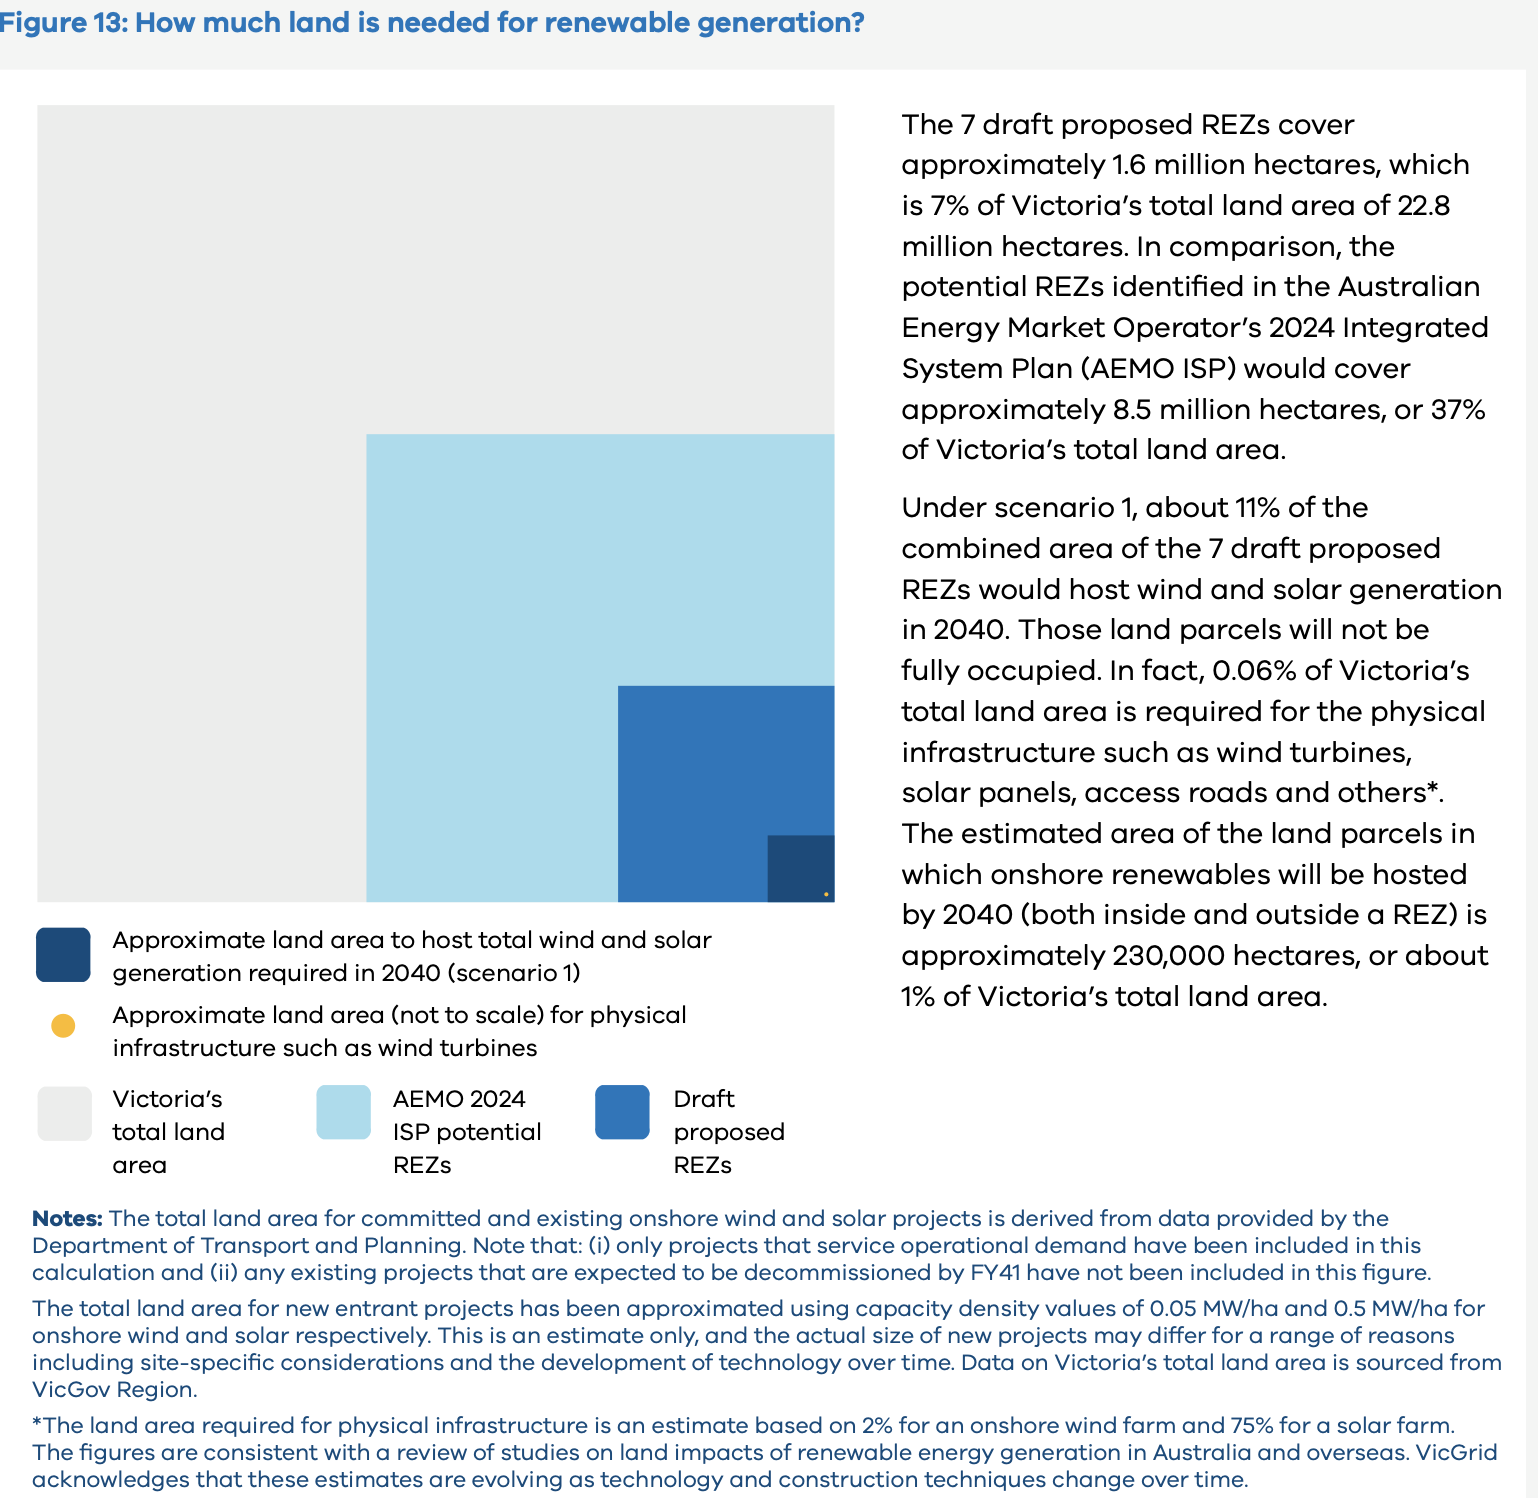
Note that the Government has made a point of saying that these REZs take up a lot less land than those proposed in the ISP.
I’m not sure what to make about this, the actual infrastructure takes up only about 1% of the land per 10 GW of wind including the access roads. For the most part normal agriculture can take place on wind farms and I think as the industry develops further the cooperation between existing land use and wind farm enhanced land use (my phrase) can continue to be improved. To me it smells of the Victorian Govt not prepared to do the work required to bring the regional community along.
Wind modelling based on AEMO ISP wind traces
On the one hand AEMO is to be heartily congratulated on providing half hourly wind and solar traces for all the REZs identified in the ISP. We here at ITK make very extensive use of those traces. However like any tool the more you use it the more you understand its strengths and weaknesses.
I have heard views from well informed industry folk that wind capacity factors in QLD are not always as good as indicated in the ISP but equally that AEMO has totally underestimated the wind resource in the Riverina and to a lesser extent for offshore wind.
ITK can see the list of credible wind projects in the Riverina. Although that is partly because the social value in building there is well recognised it also has to be because the developers see a good wind resource. So its observed evidence.
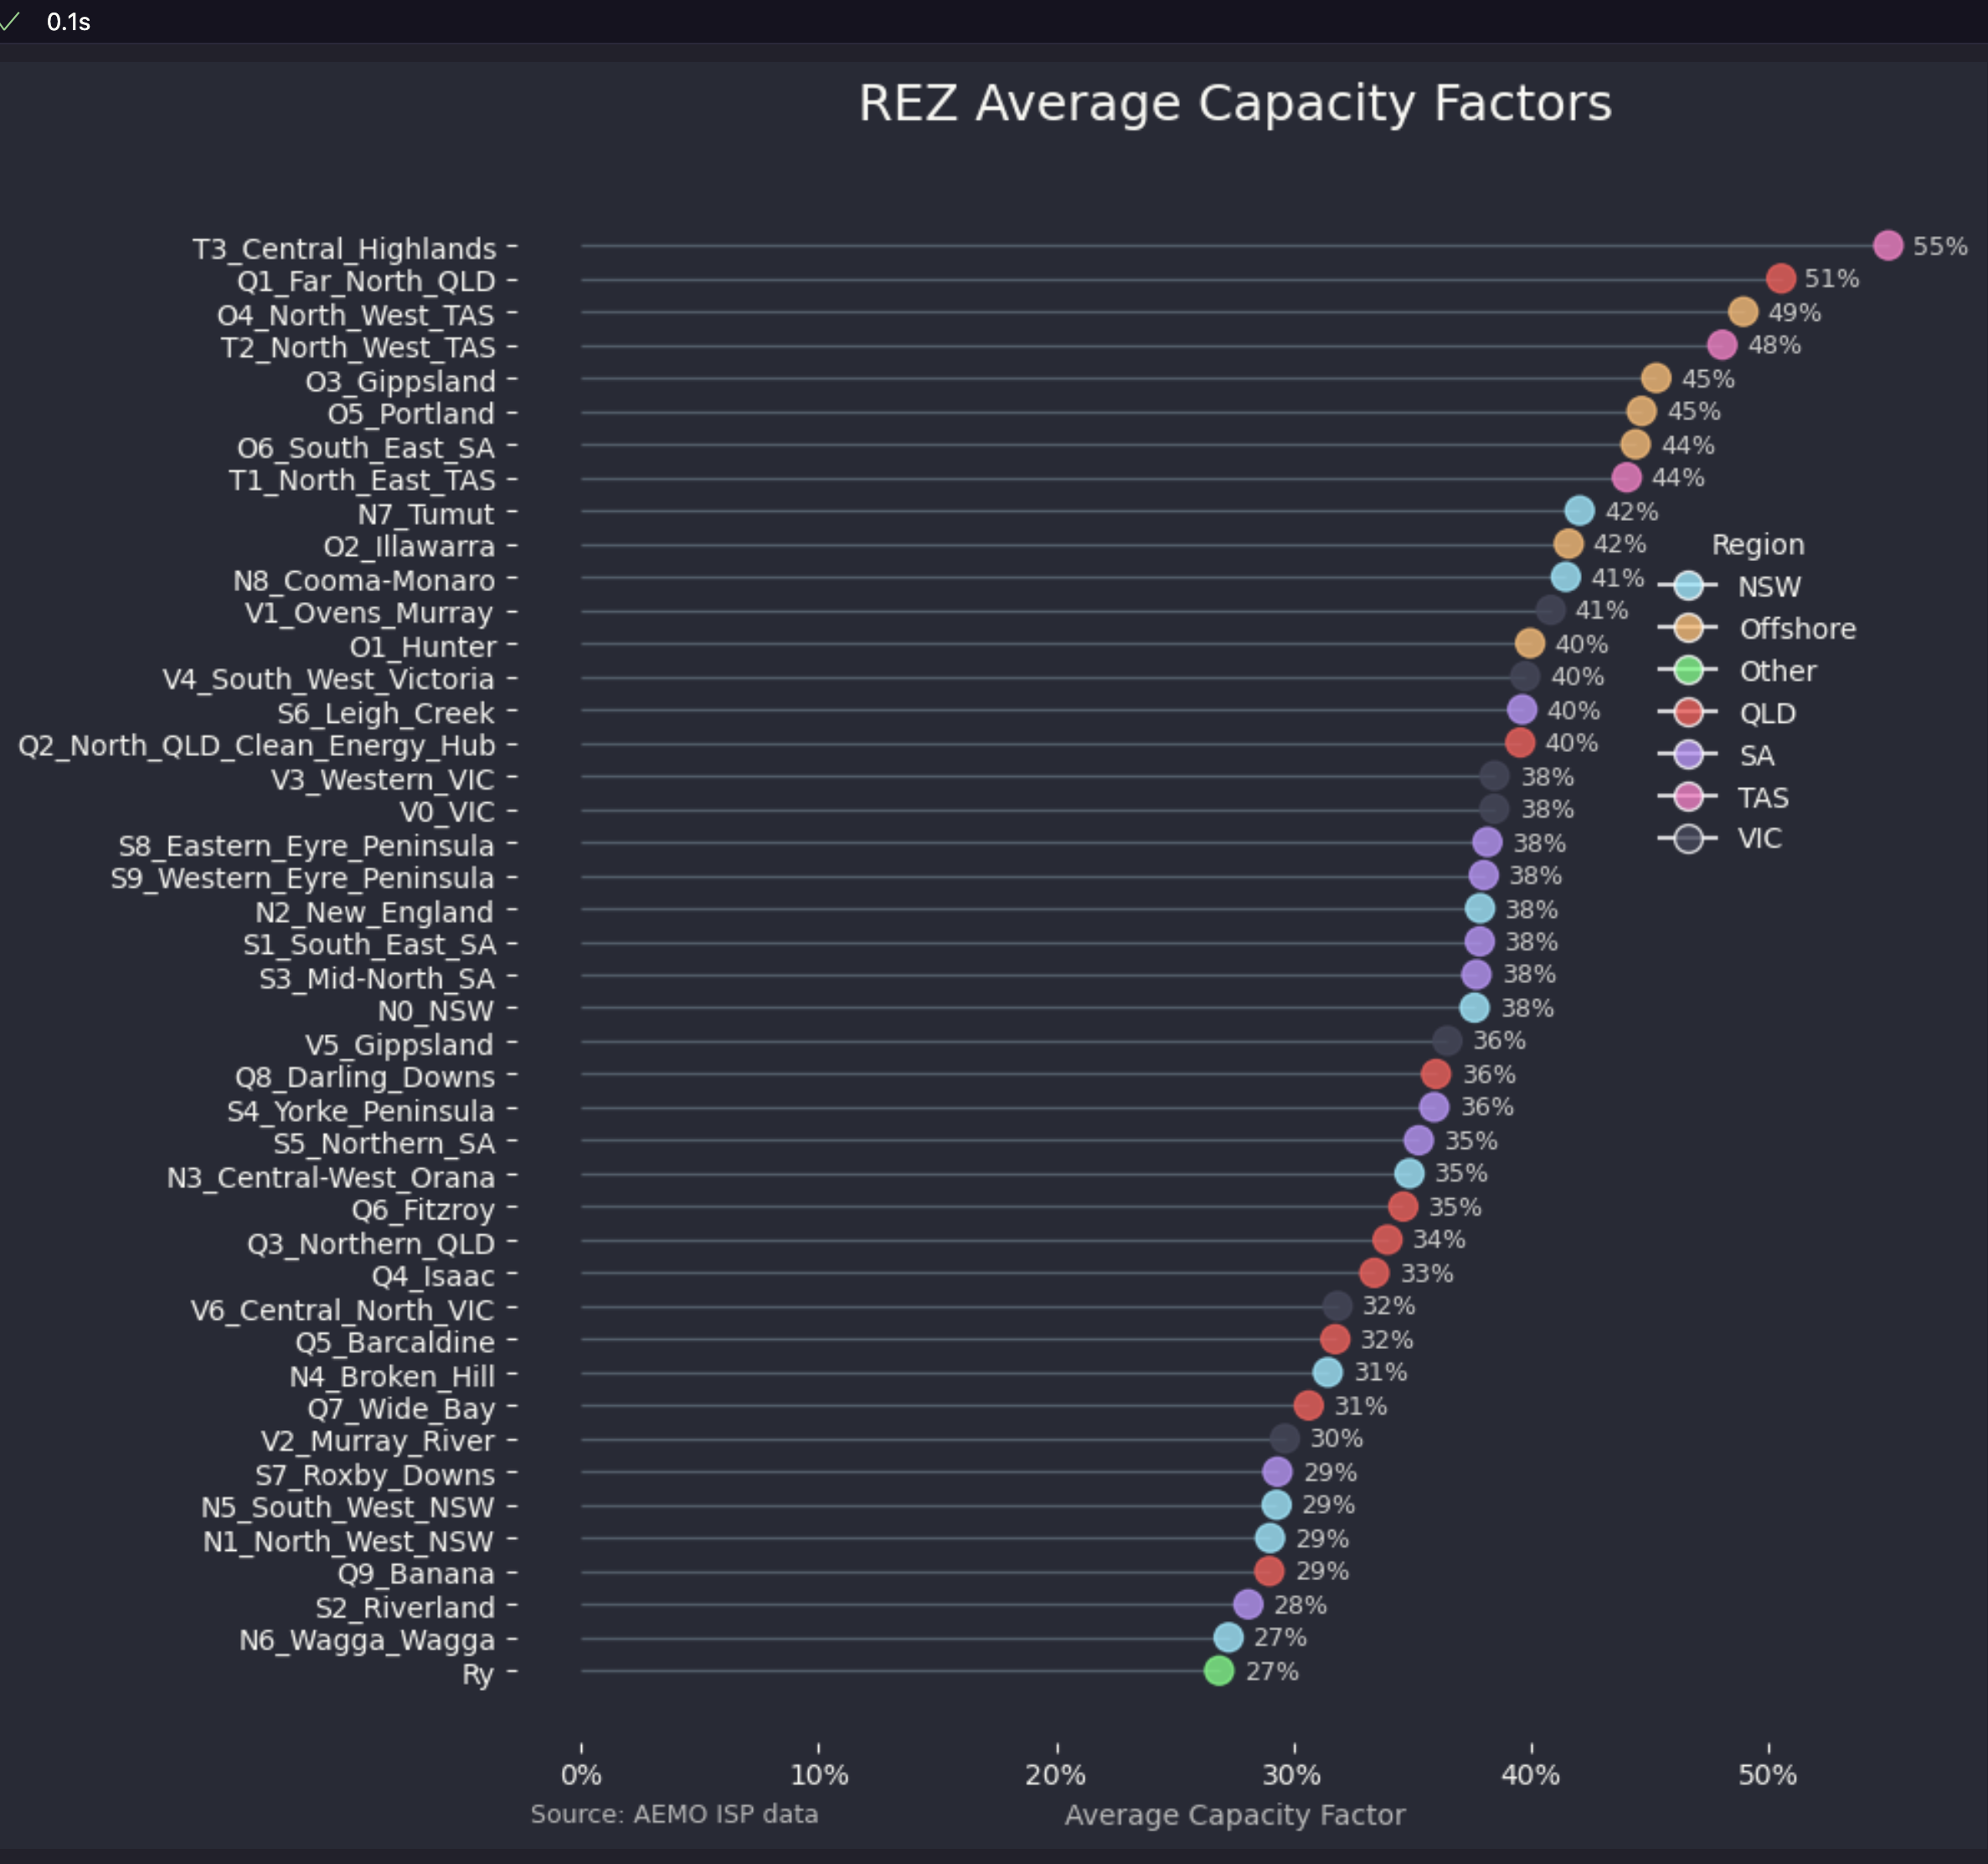
For what its worth the average capacity factors for the best wind REZs as ITK has identified them from the ISP data are shown below. Leaving aside covariance and time of day issues offshore wind on these numbers has about 45% capacity factor compare to say 38%-40% for other onshore sectors in the top half of the figure. That’s good but, in my opinion, not decisive. In the real world economic and other curtailment and transmission loss issues means that the observed capacity factors typically fall below the theoretical numbers.
Again using the AEMO wind traces as the source for some selected wind farms we can plot the estimated 2025-2050 output by time of day.
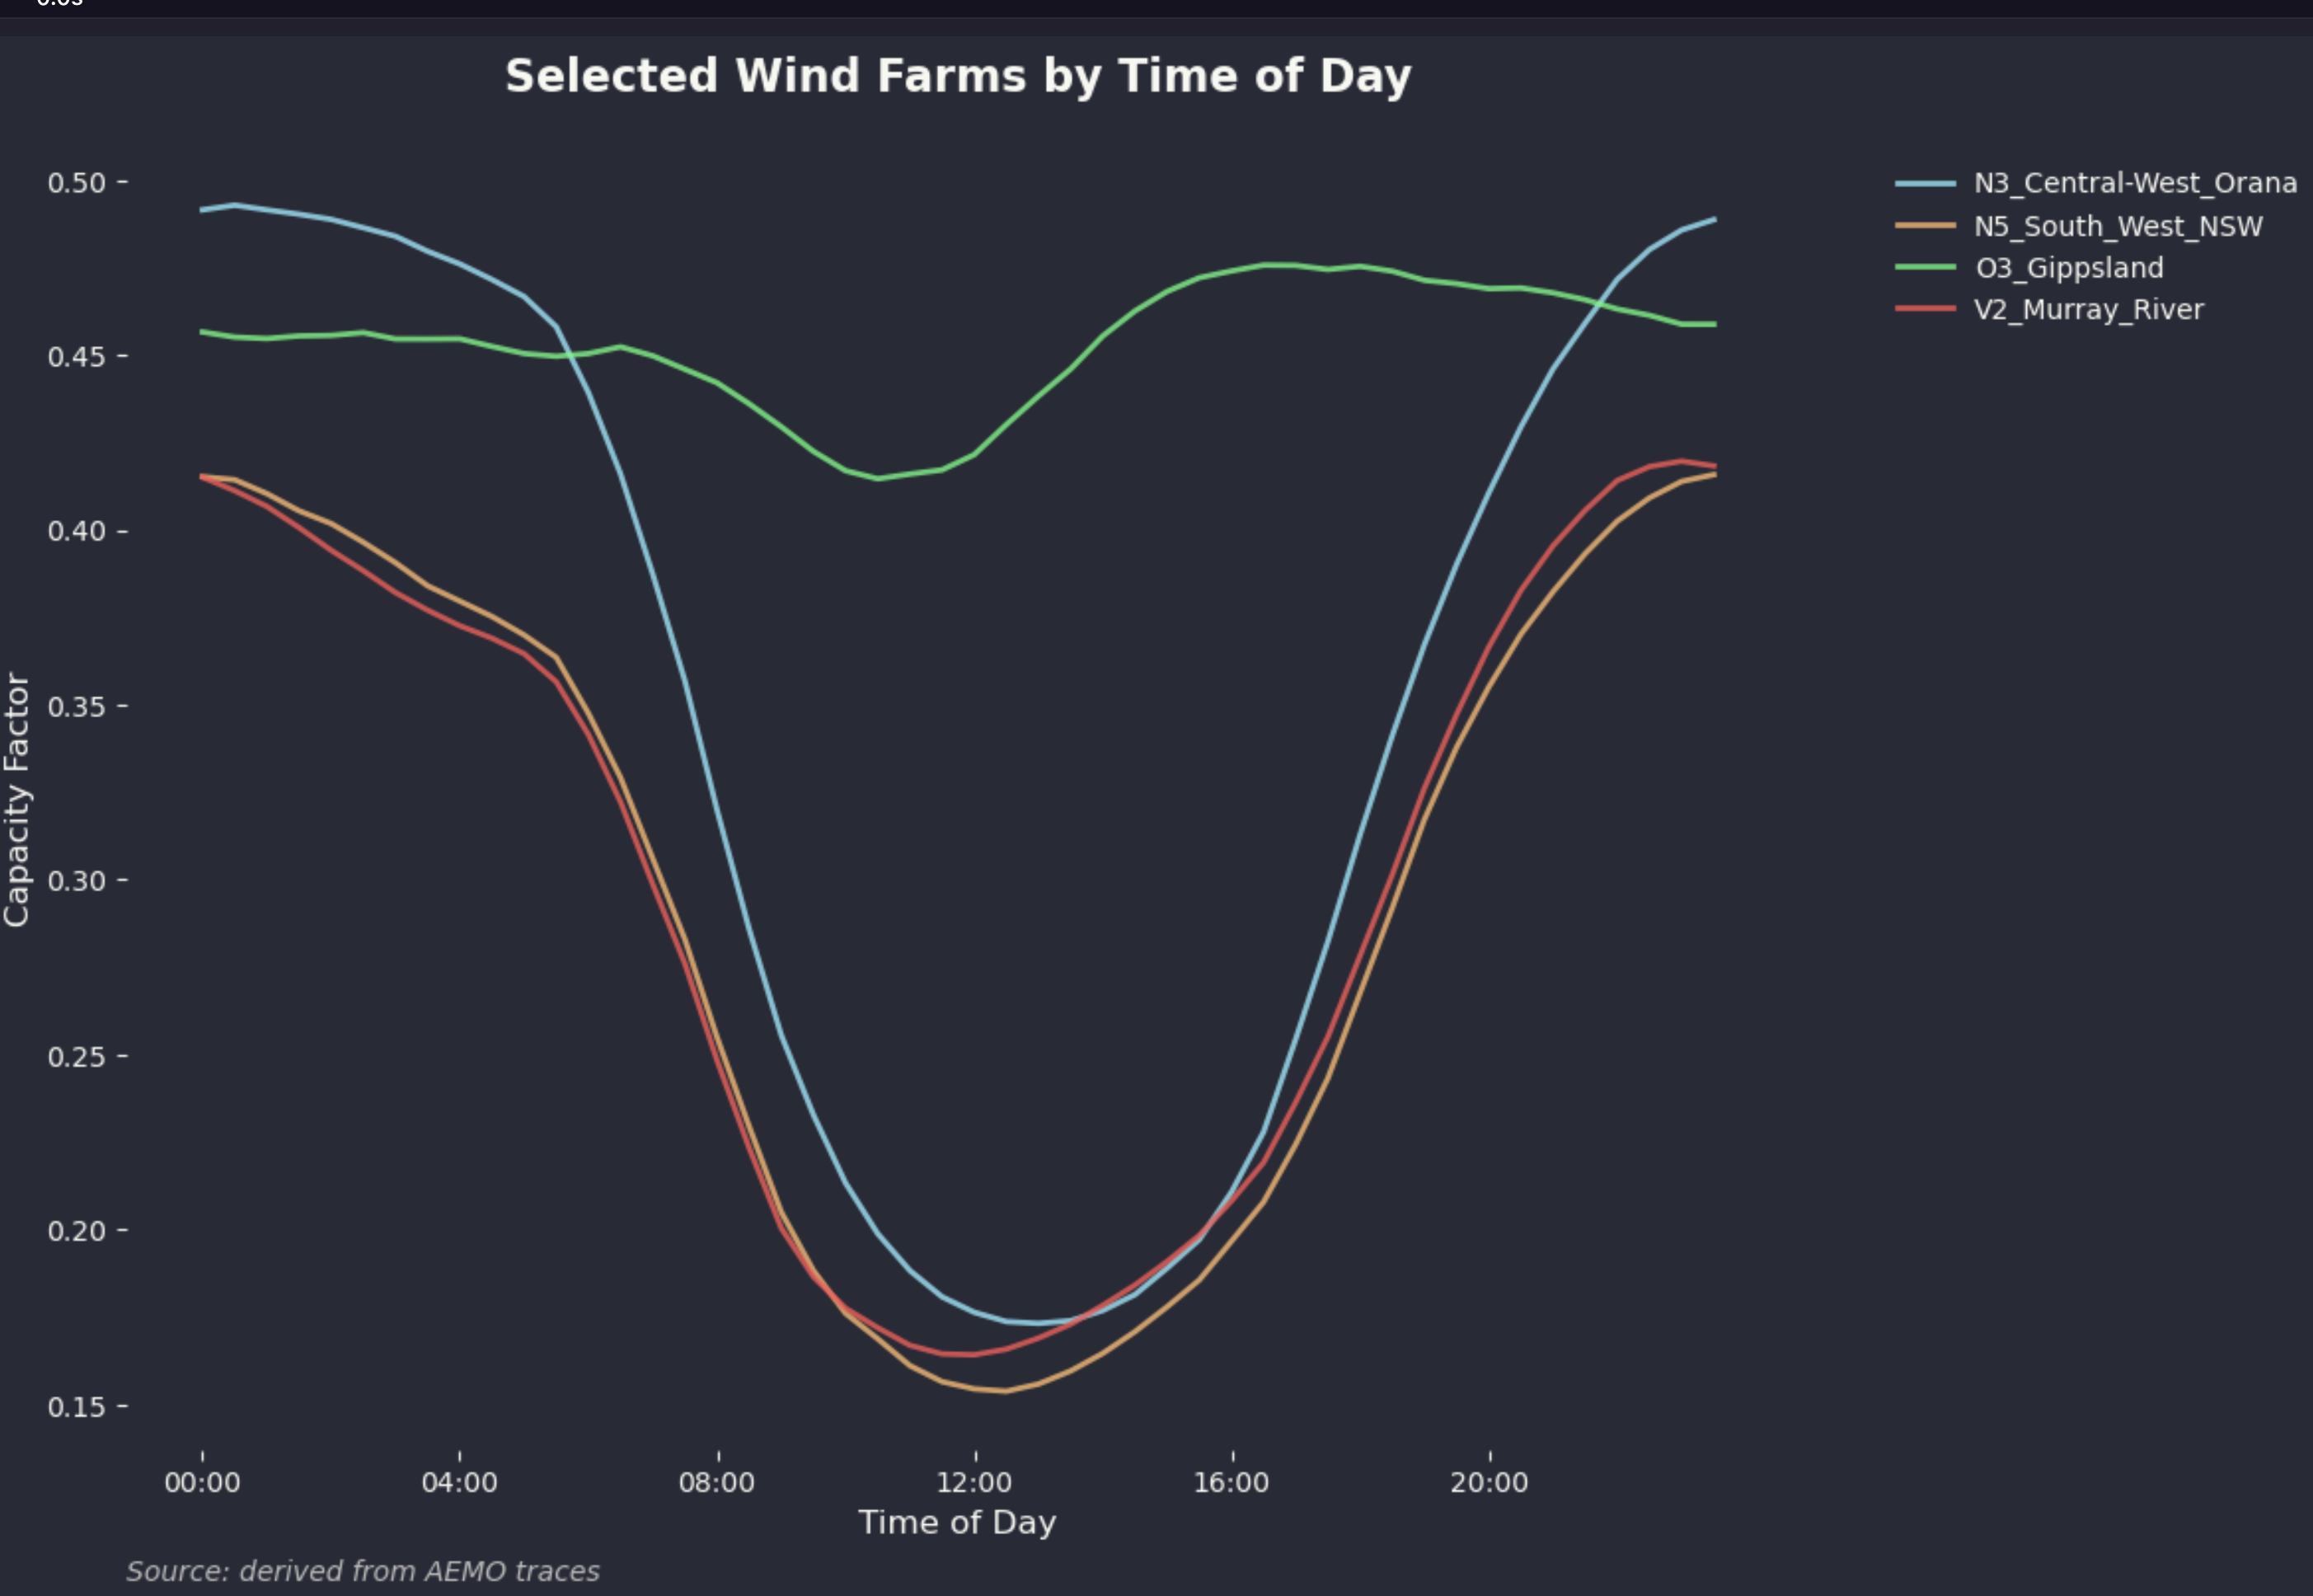
Quite clearly the average output for the Gippsland zone is much steadier than for the onshore zones. Almost definitionally that means the variance of the offshore zone is going to be lower than that for the onshore so firming will be needed less often.
However when you add in a bunch of solar the fact that wind output drops sharply in the middle of the day, on average, for the onshore wind farms makes them a good fit. ITK has done a lot of modelling around this borrowing from equity portfolio theory to look for maximum Sharpe Ratio portfolios. In fact such portfolios always emphasise QLD and big transmission links between NSW and QLD. You can read that work here
ITK’s modelling is no substitute for the ISP or, no doubt, the work the Victorian Govt has done, but we have done our homework and understand both the tradeoffs and limitations that such modelling entails. And in fact our preferred model had no offshore wind but variations did.
Time of day is one thing but seasonality is also very important. At the risk of trying to hard in the plotting approach this radar chart shows offshore wind does a great job in Winter and could expect to access better prices as a result. Note that this seasonality is shown with the year long average output for each wind farm expressed as 100 and the month average relative to the yearlong average.
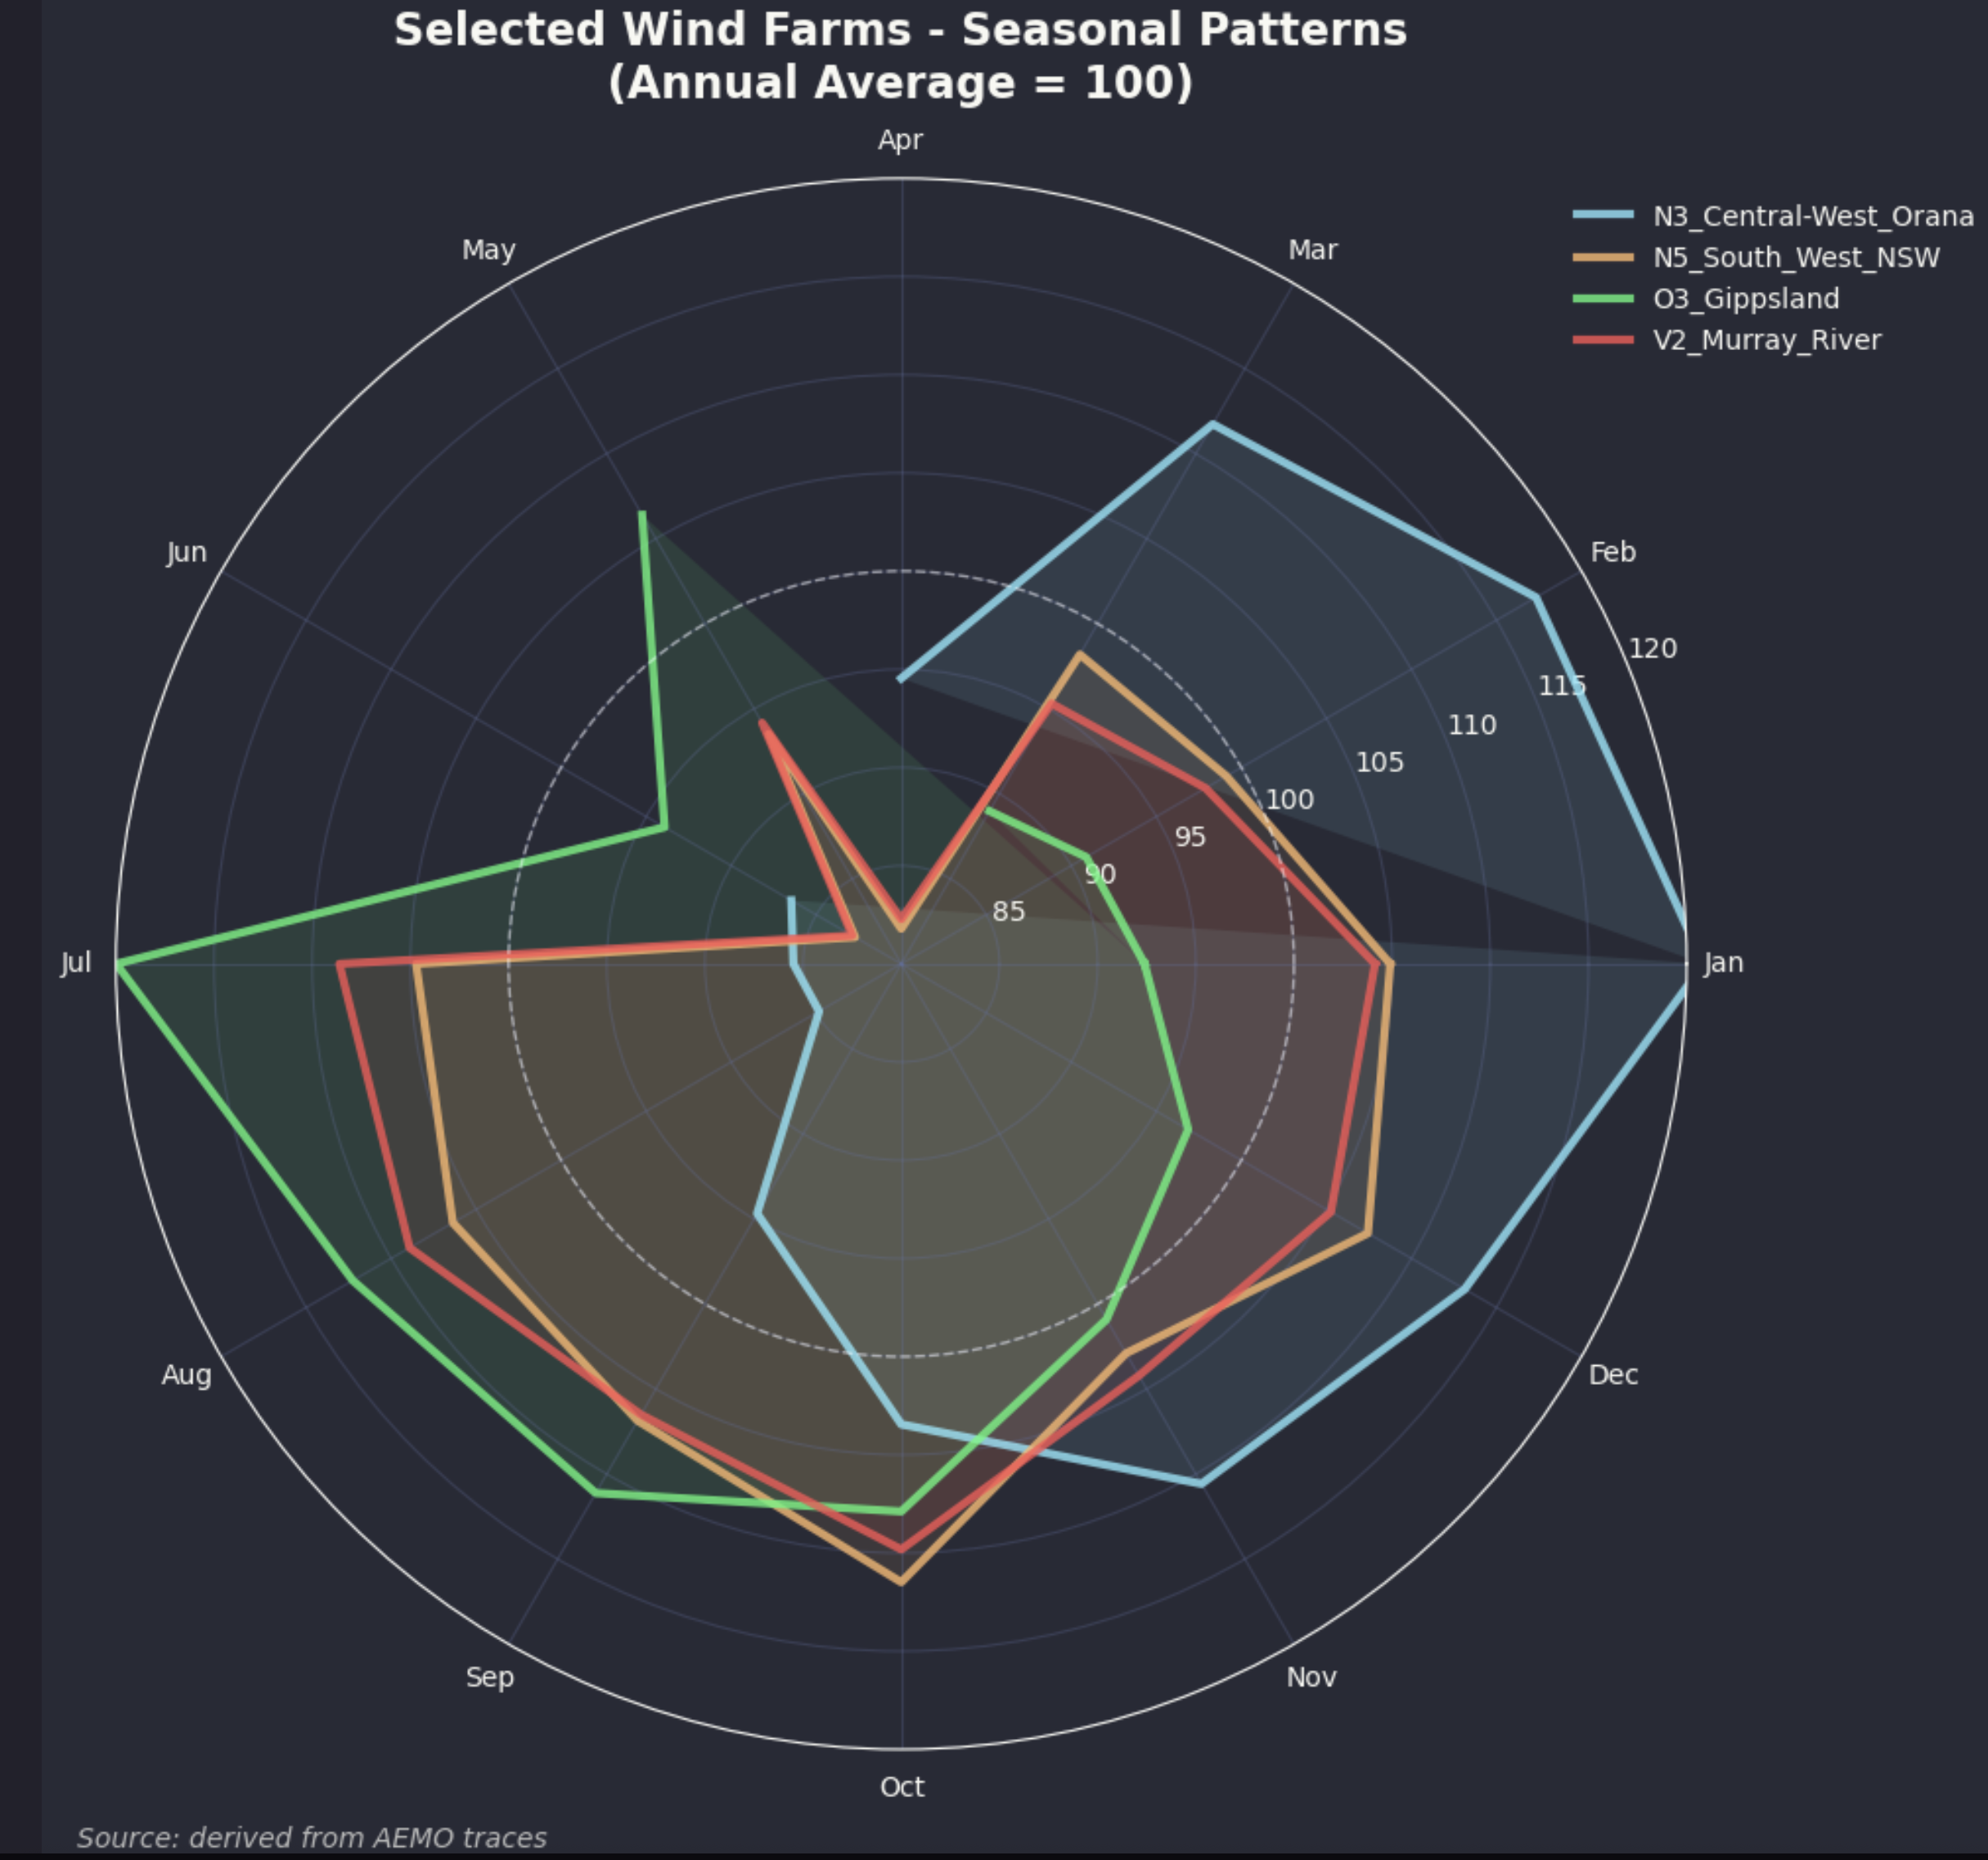
If wind alone was the only consideration you can see on this data that a combination of Orana and Gippsland offshore would work well and that in general offshore is oriented to the winter months. Still the main point is that Gippsland wind is particularly strong in Winter, as I think would likely be West Coast onshore Tasmanian wind.
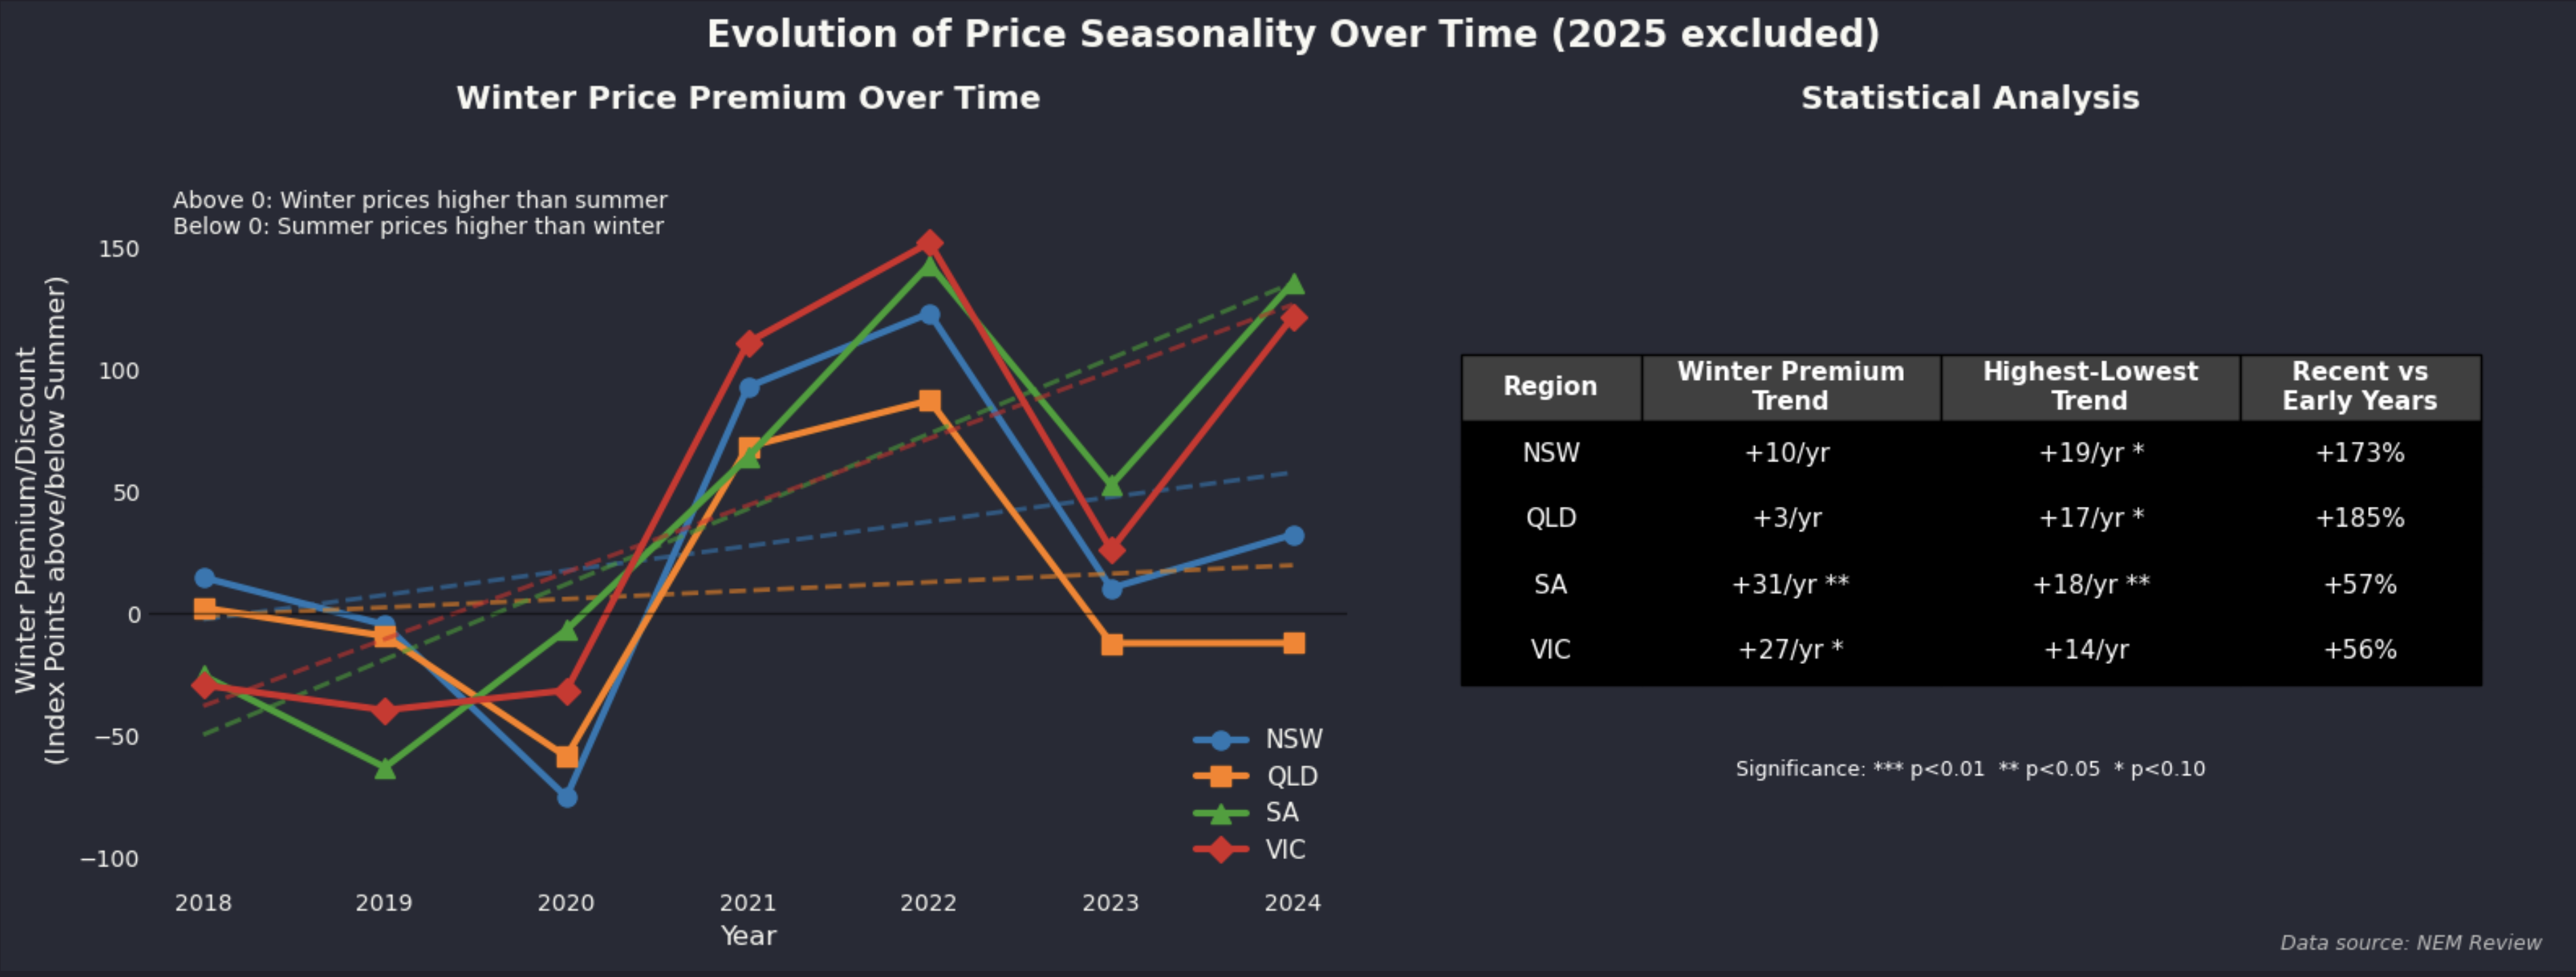
Seasonality is becoming more important as reflected in electricity prices.
The following figure is as simple as I can make a complex subject. It tries to show what’s been happening to the seasonality of prices across regions and across time all in one visualisation. Those with longer memories might remember that before we had lots of wind and solar prices used to be a lot higher in Summer. That was because demand was higher in Summer and coal generators and transmission tended to underperform in hot weather. Now though firstly solar takes the load off generation in Summer and reduces operational demand quite significantly secondly both solar and wind generation tend to drop off sharply in Autumn and Winter.
The visualisation shows the evolution of the difference between Winter and Summer prices and also between the highest price month and the lowest price month. In order to abstract the data from stuff like Ukraine invasion for each year and region the average price for the year is set to 100 and then the monthly average is expressed relative to that. So the movements are in index points not $.
I can see looking across the data that as wind and solar penetration goes up that seasonal variation increases. Batteries are generally the answer to volatility and so we have yet to see what happens once we have lots of batteries. However ITK anticipates that there will still be some issues finding enough energy to charge the batteries in winter months on some occasions. And that is indeed where offshore wind can make a difference. Of course we don’t really have enough data to be sure of the trends as there has been lots of external events. And the market structure means that participants exploit opportunities to the max, thereby creating the head room for new entrants.