China - “There is a tide when which taken at the flood”
The following plots show China’s electricity consumption by fuel since 2016 and over the past 12 months
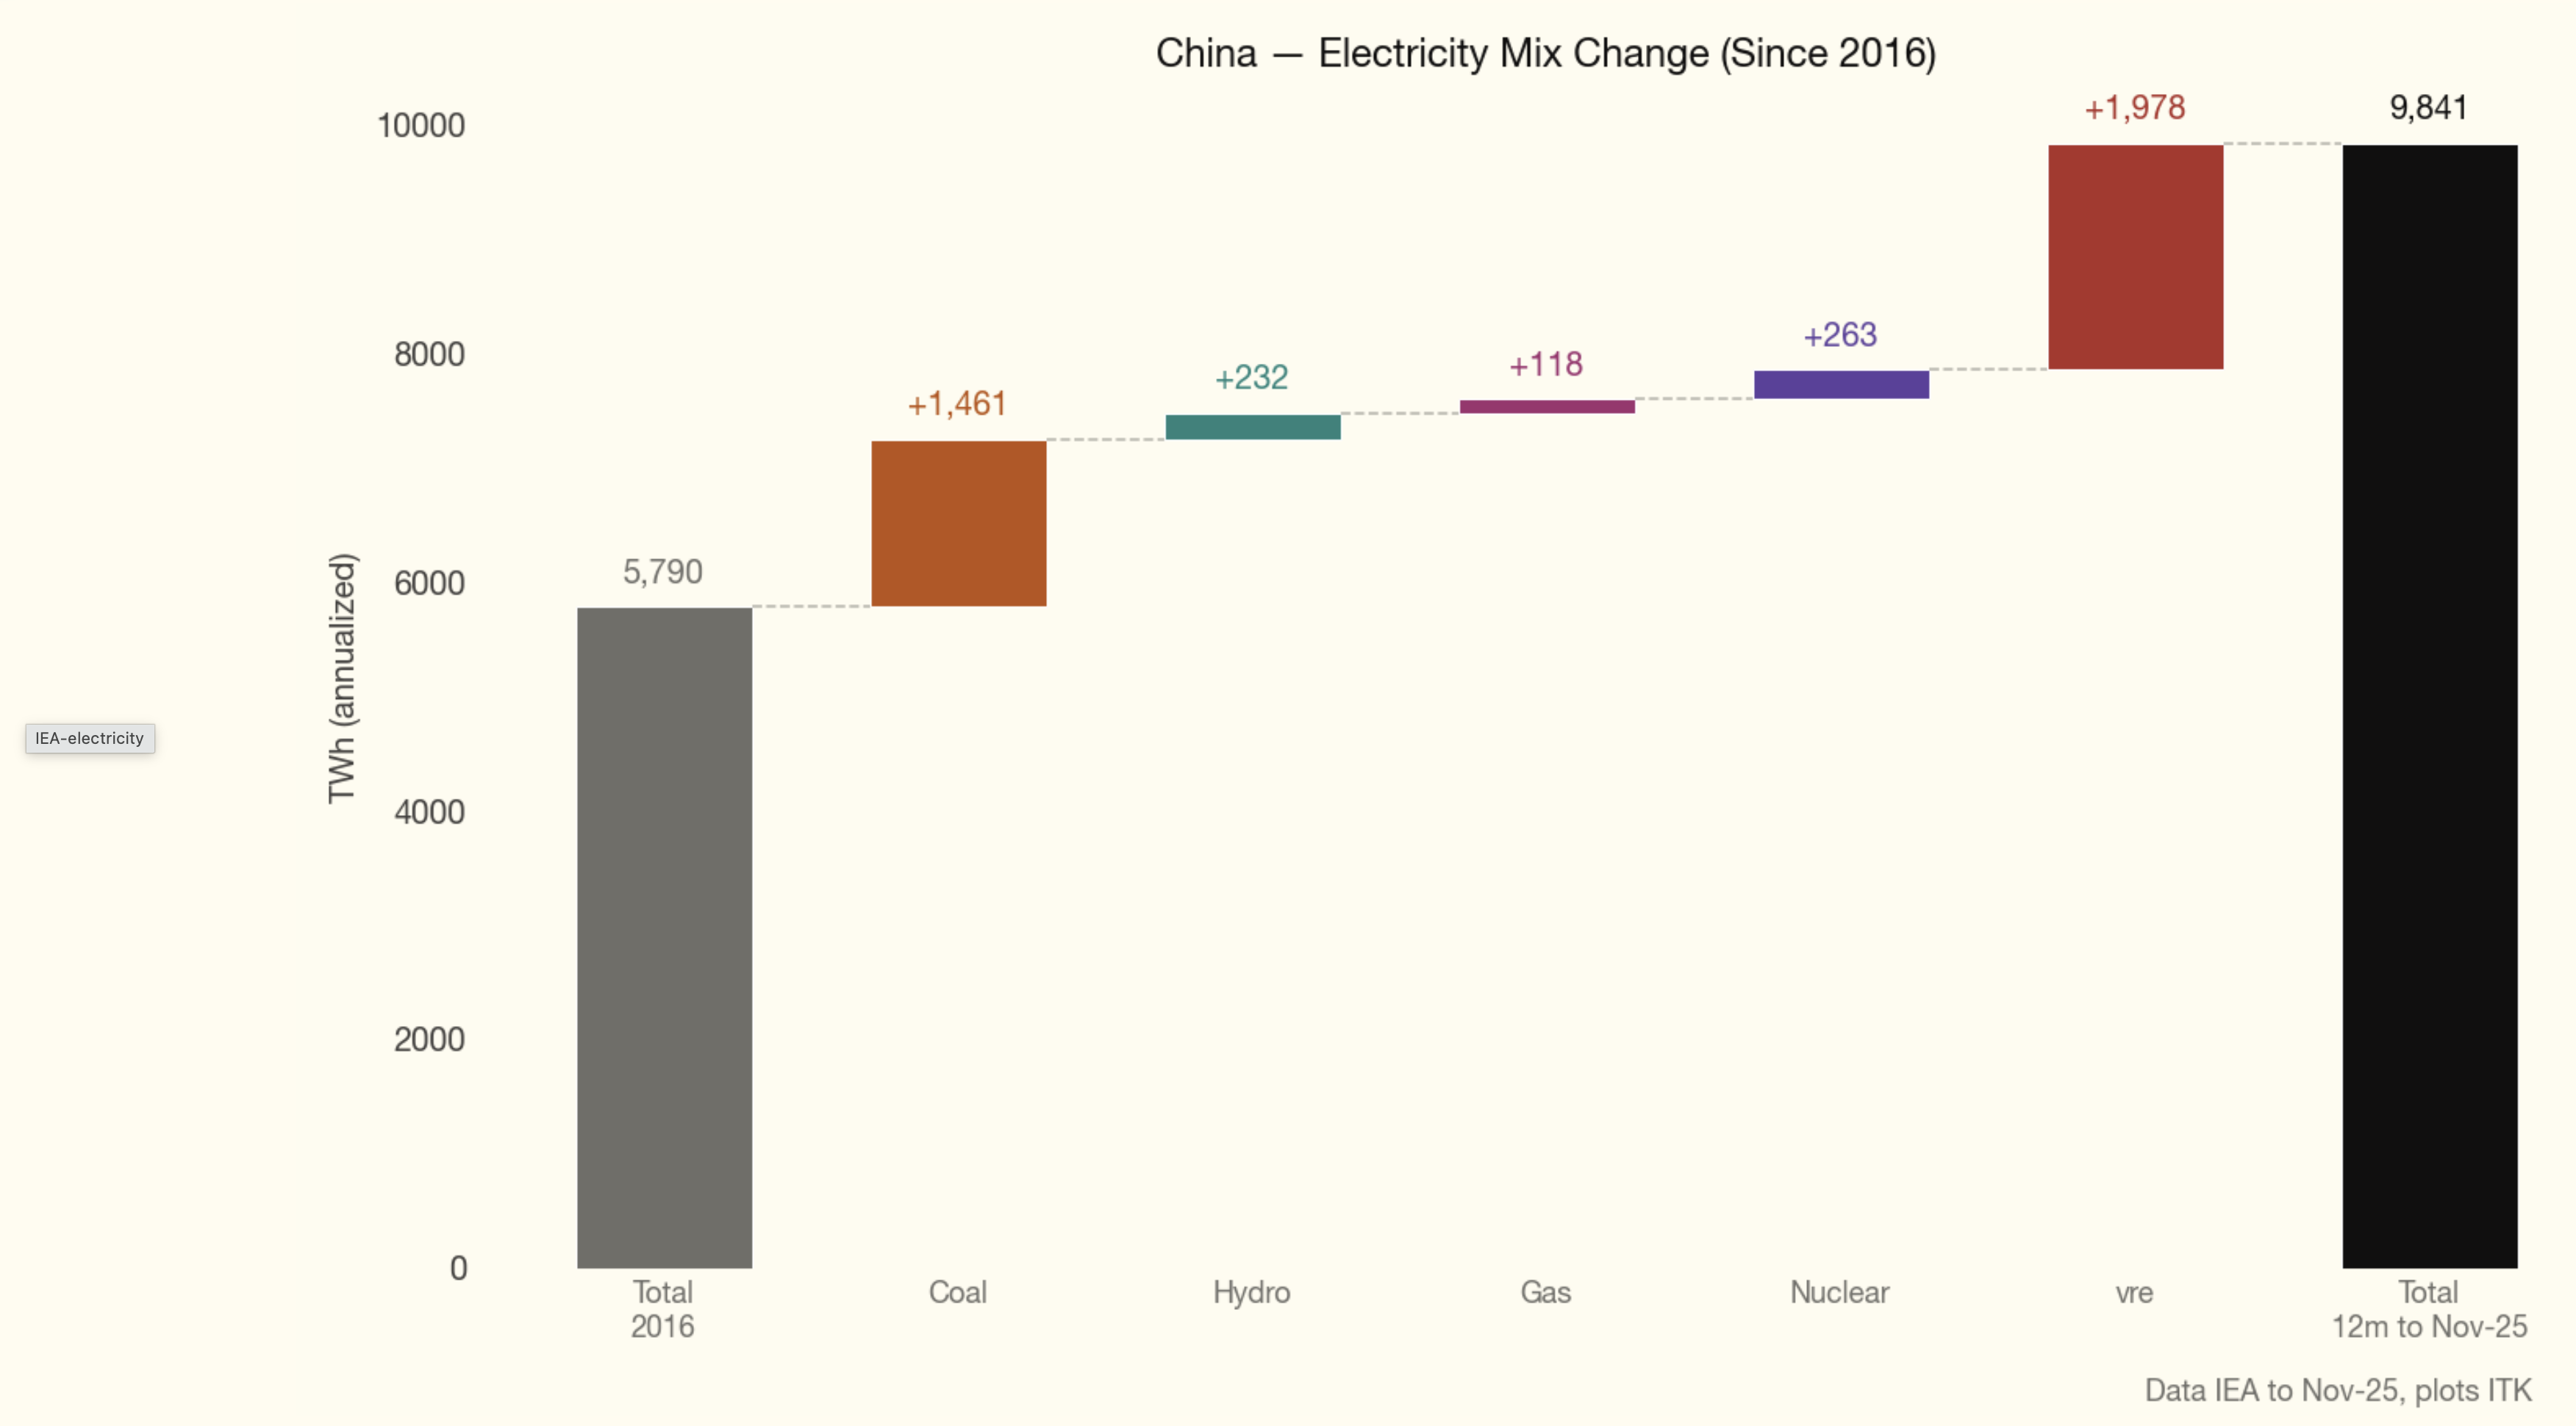
Over the past 9 years China’s coal-fuelled electricity generation has INCREASED by about 6X Australia’s total electricity consumption. Wind and solar have increased by about 9X.
And Australia is not that small a country in the global stakes.
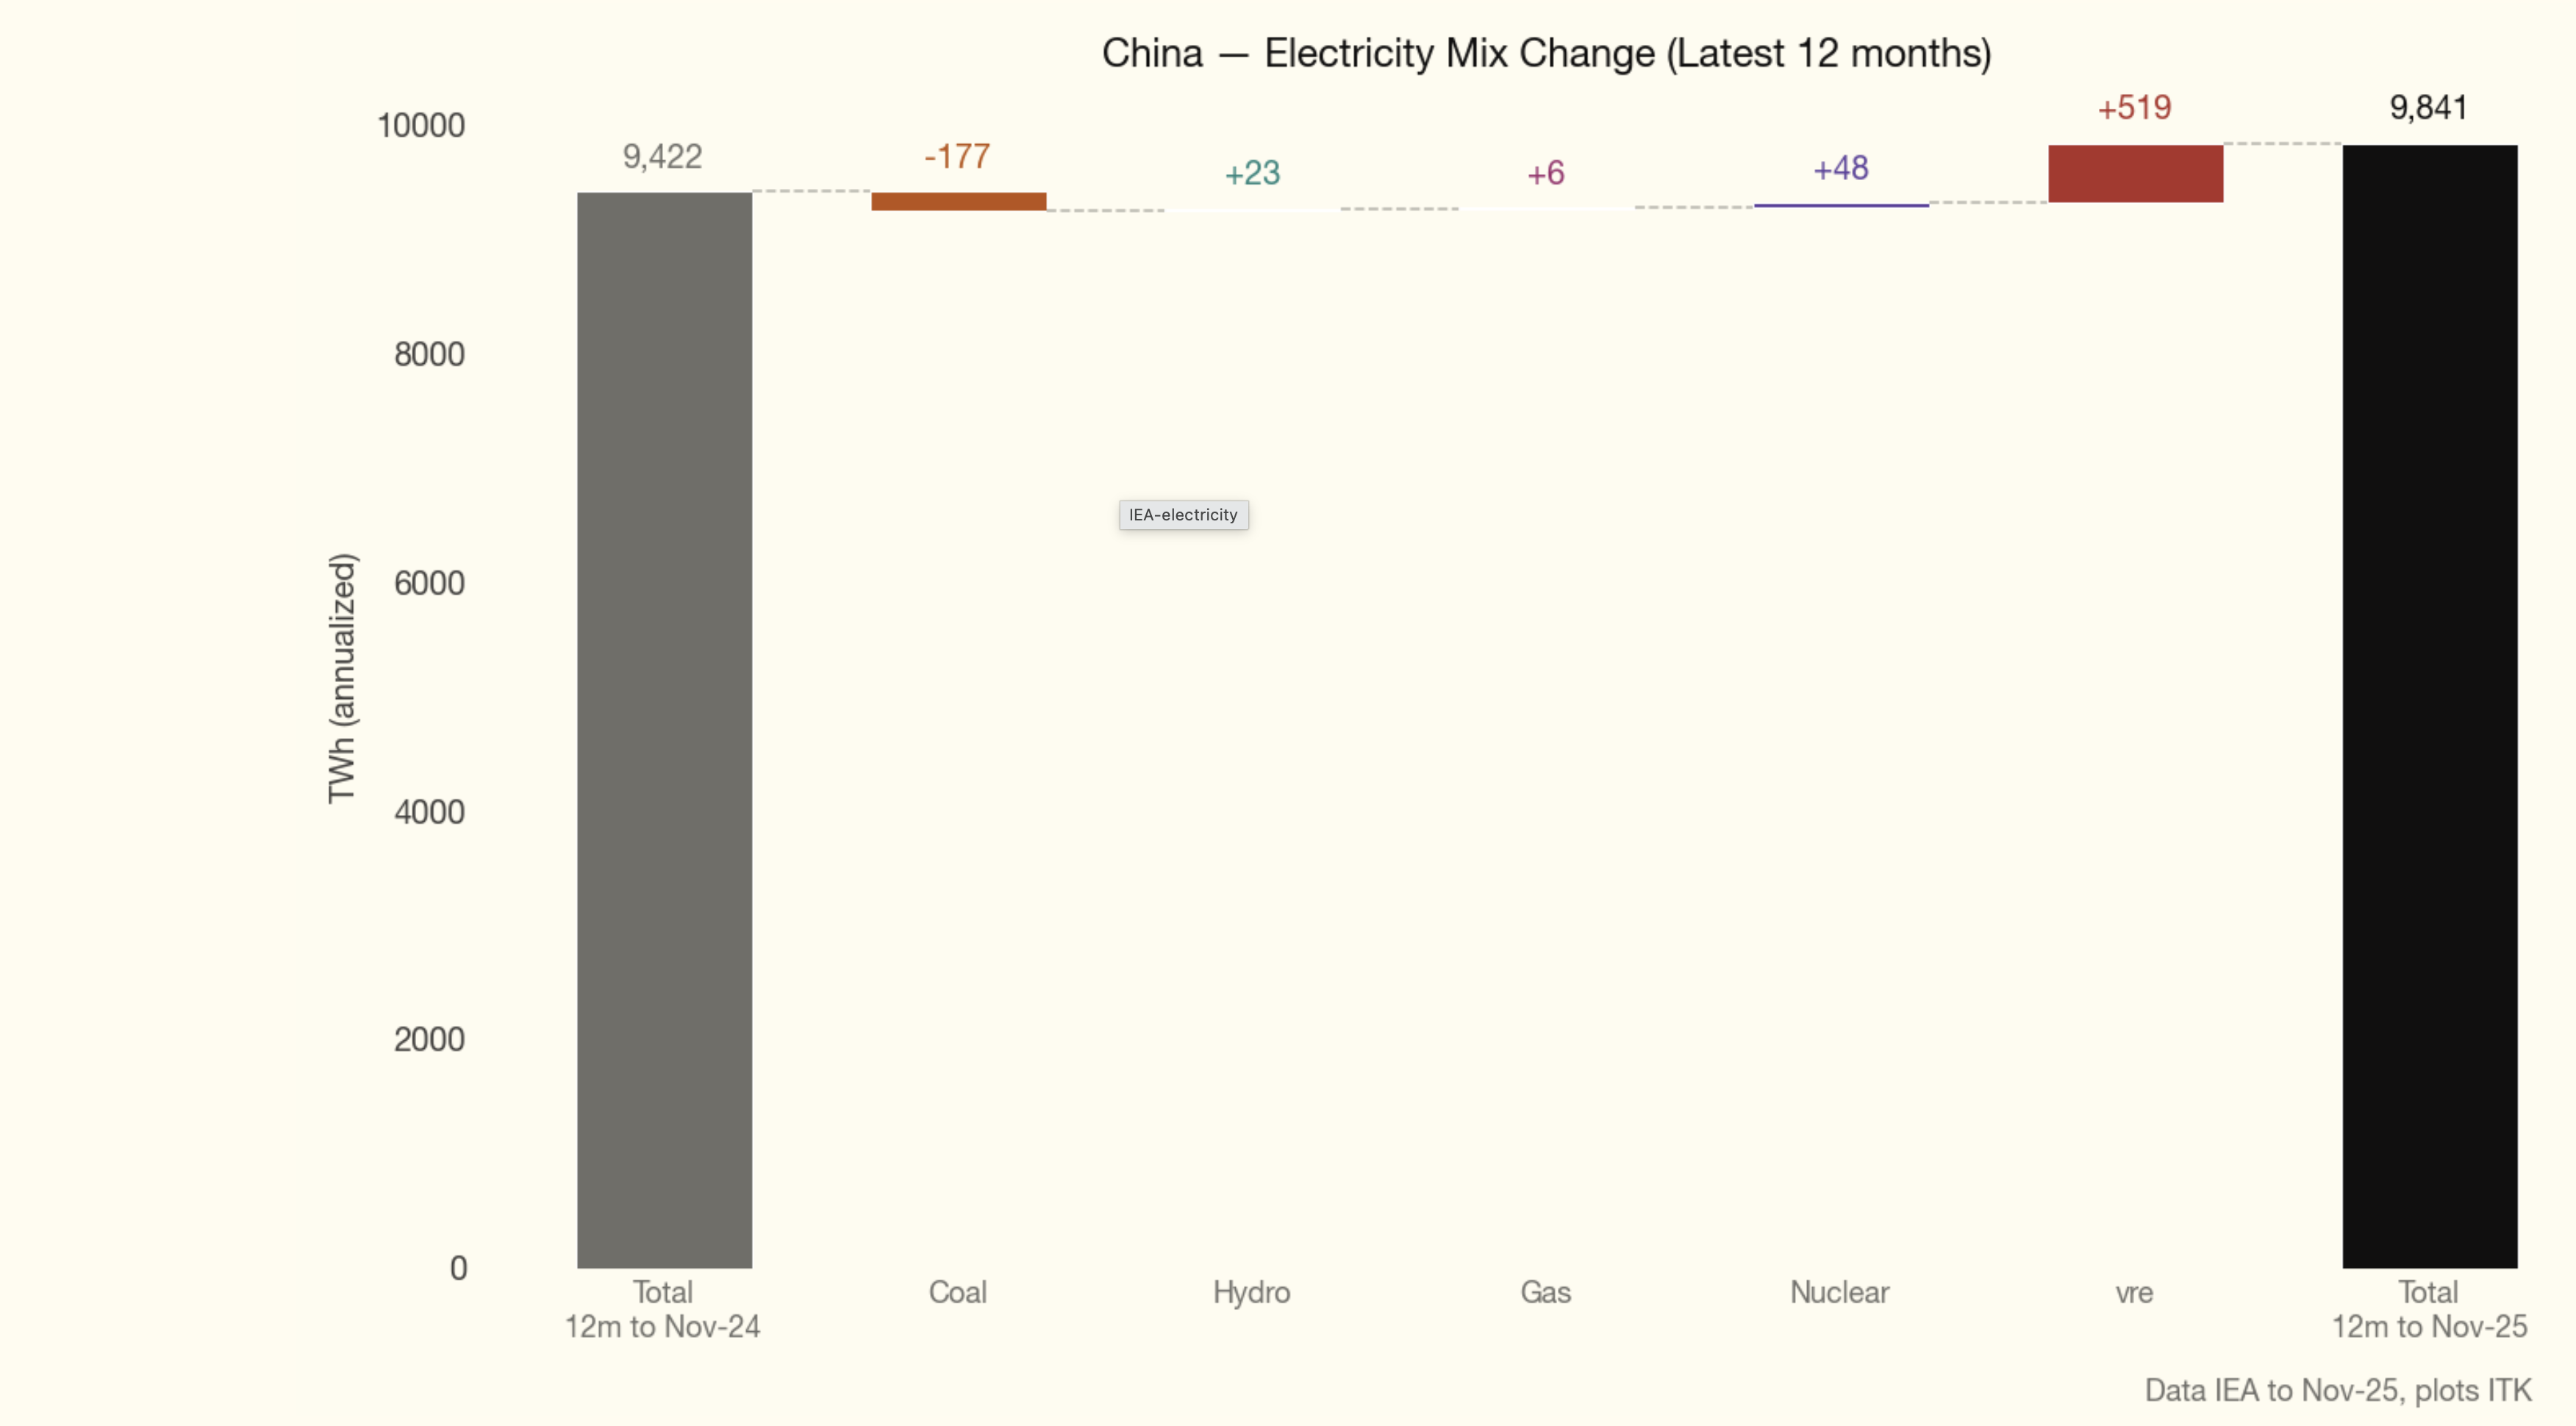
Over the past 12 months though China’s coal-fuelled electricity consumption actually fell ever so modestly despite relatively strong growth in overall consumption.
I like the waterfall view but the standard line plot is also helpful 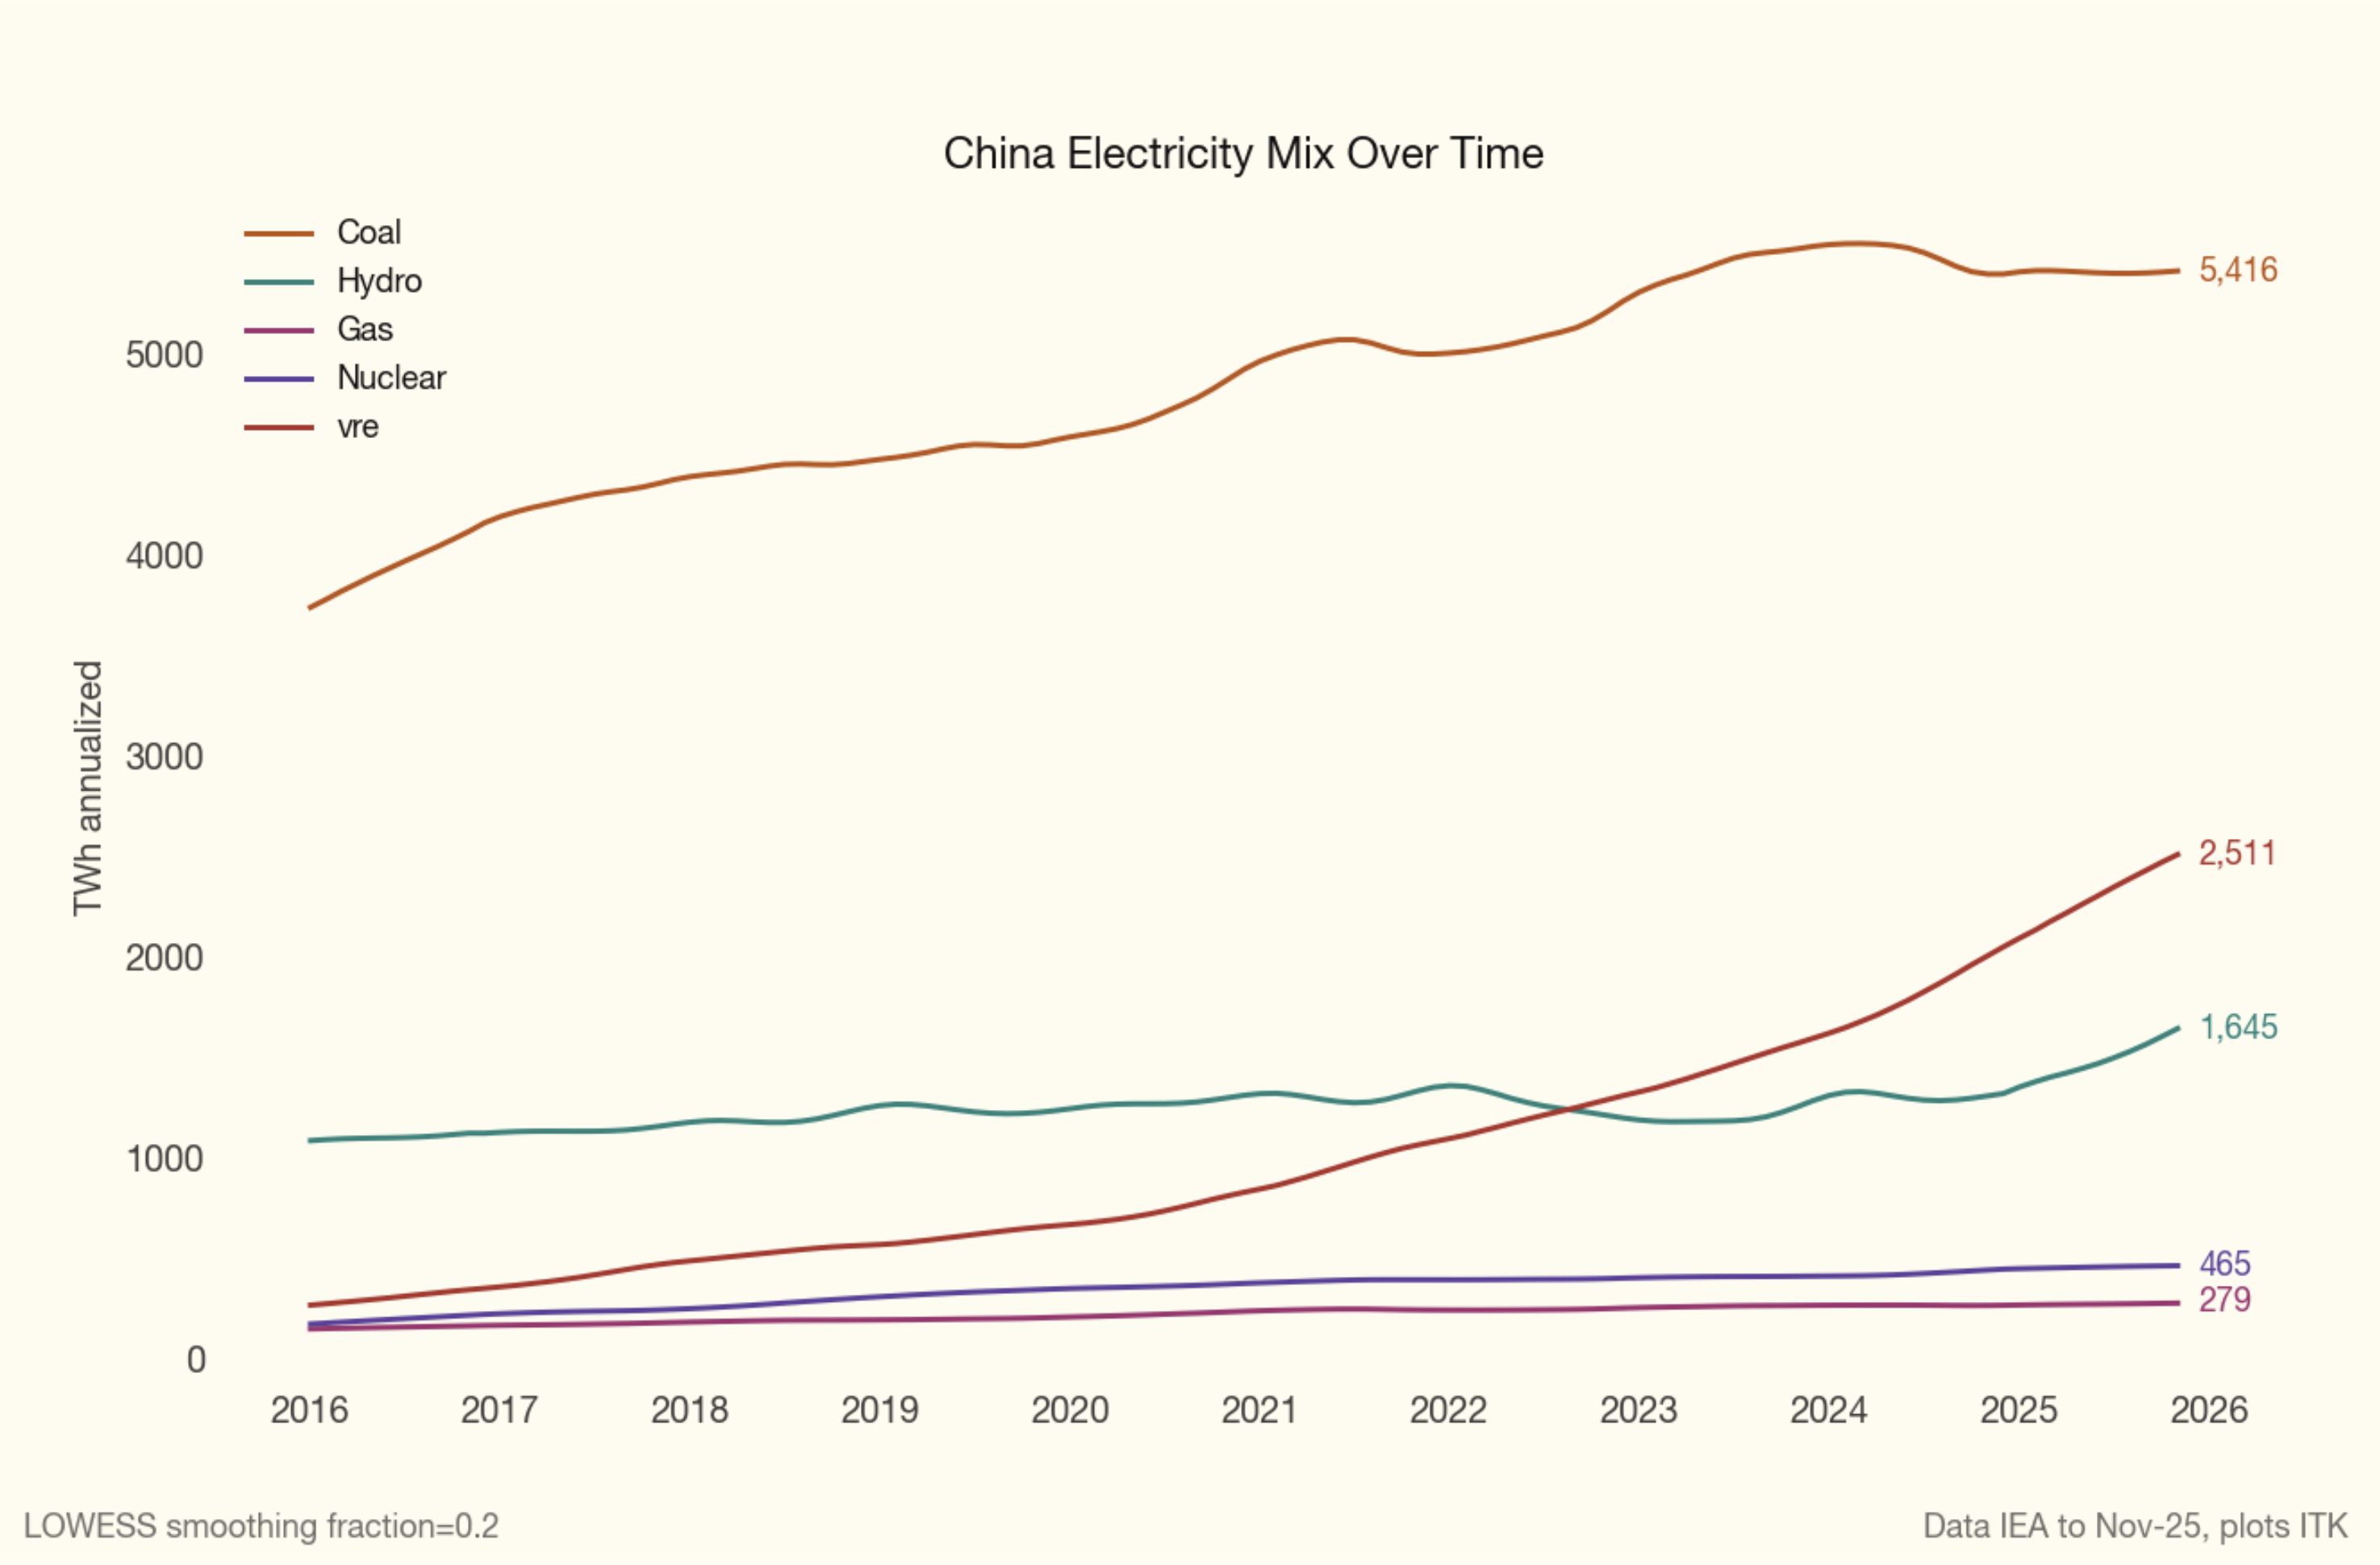
The 1.4 PWh increase in coal-fuelled electricity represents about 1.1 billion additional tonnes of CO2 emitted every year compared to nine years ago. There is no doubt that China, and other countries, need to do something for the world’s future generations.
And so it’s very encouraging to see the decline, however small, and perhaps more broadly a clear flattening in the trend.
Because China is the world’s export powerhouse, it is only doing emissions that someone else would if the manufacturing occurred elsewhere and that other country also had the same share of coal-fuelled electricity.
Equally, when it comes to capacity increases, which are the number one indicator of where things are going, there is still an excessive amount of new coal generation being built.
In 2025 China added 315 GW of solar and an astonishing 119 GW of wind. However, that was 2025. New pricing policies and the outcome of the 2025 plan, and by outcome I mean not just the notional targets but what the Government actively strives for, may mean some pullback, but maybe not.
There are also at least 30 GW of nuclear power under construction, obviously with high capacity factors.
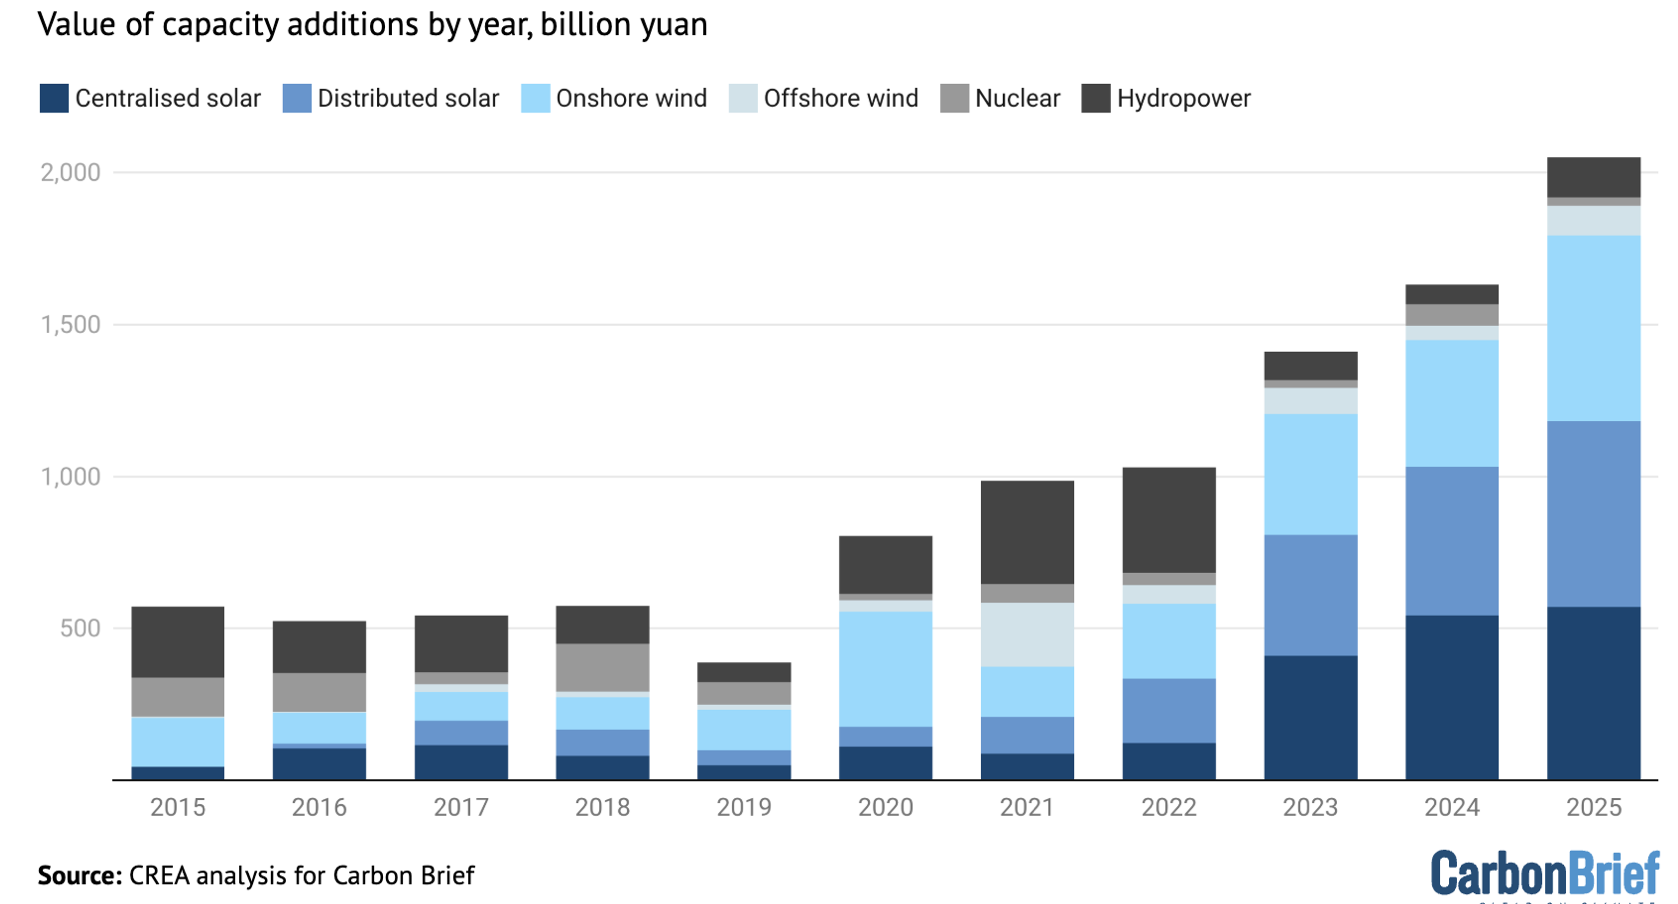
The overall investment in clean power generation is shown below — about US$300 billion in 2025. That’s still only about a third of what is going to be spent globally on AI compute this year, but that’s another story.
But the real question is coal, and we have been here before. For reasons of energy security and in response to previous electricity shortages, China went on a coal generation building spree. Back in about 2014 it looked like coal-fuelled generation was slowing right down, but then it reaccelerated. So this time, even though I think the change is more permanent, I’m not rushing in.
I can summarise 2025 electricity generation investment by main fuel class very broadly. 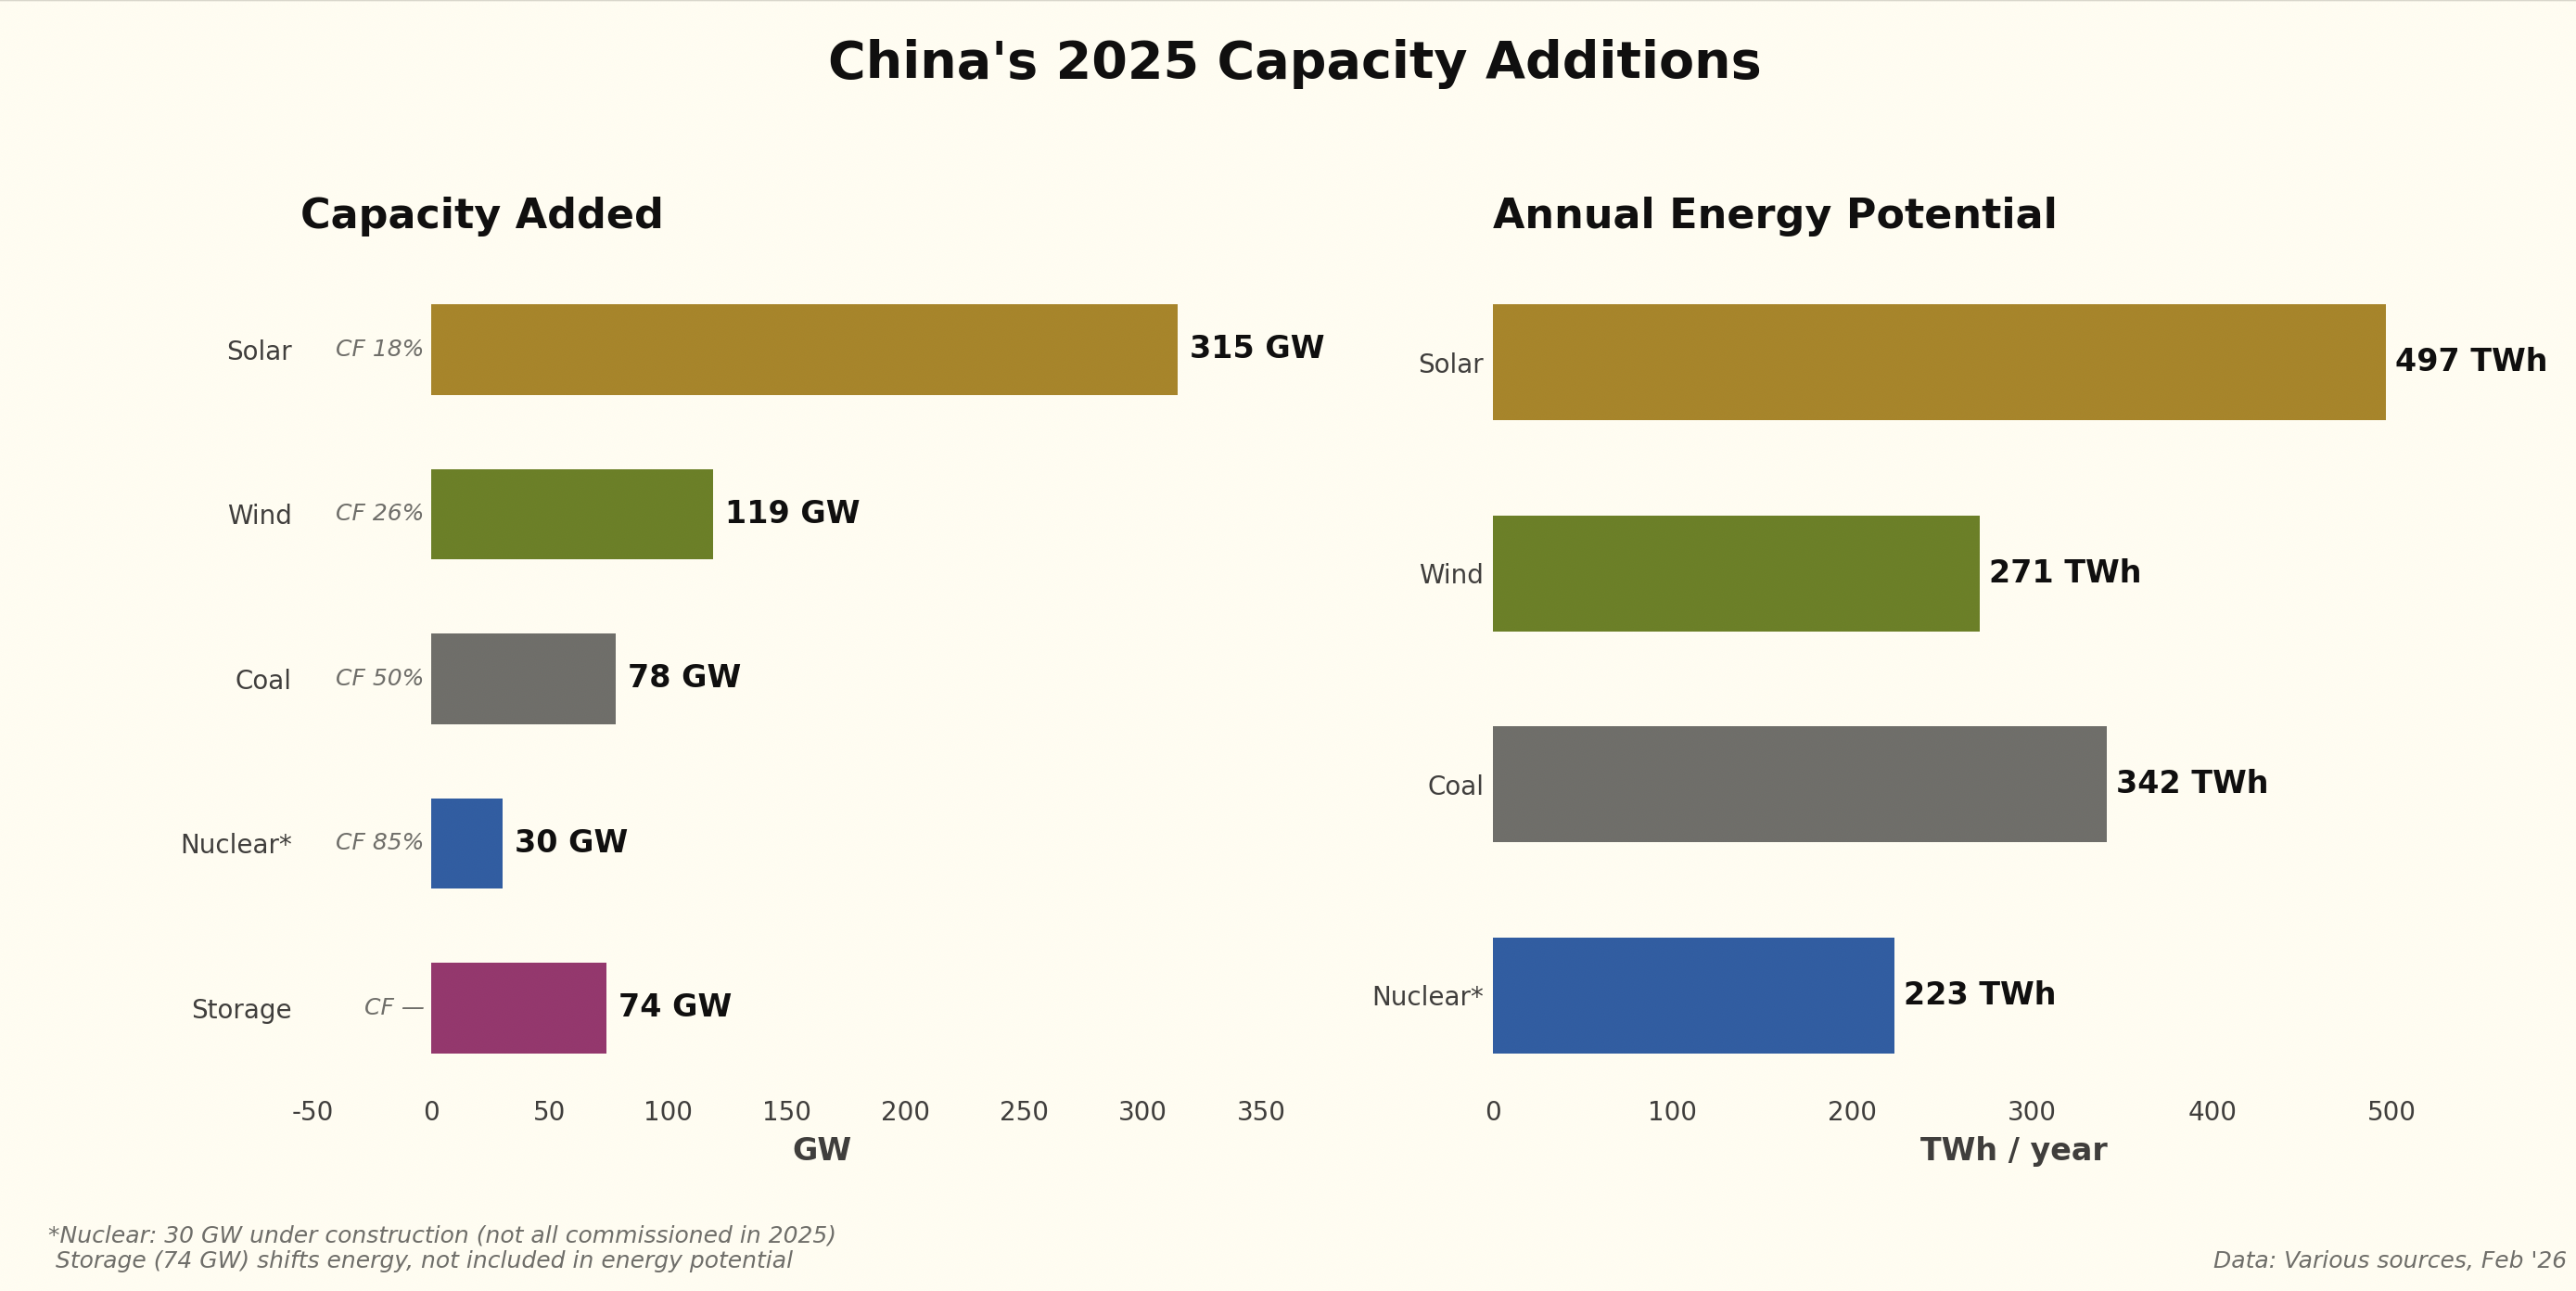
Roughly 1,300 TWh of potential generation was added or started in 2025 in a market where only 400 TWh of increased supply was needed. There is going to be a fight over who gets dispatched.
ITK’s view is that coal generation operating hours, already at pretty much all-time lows of around 50% across the fleet, will continue to fall. One of the reasons is the cost and quality of coal, which we return to below.
Not just electricity - Transport
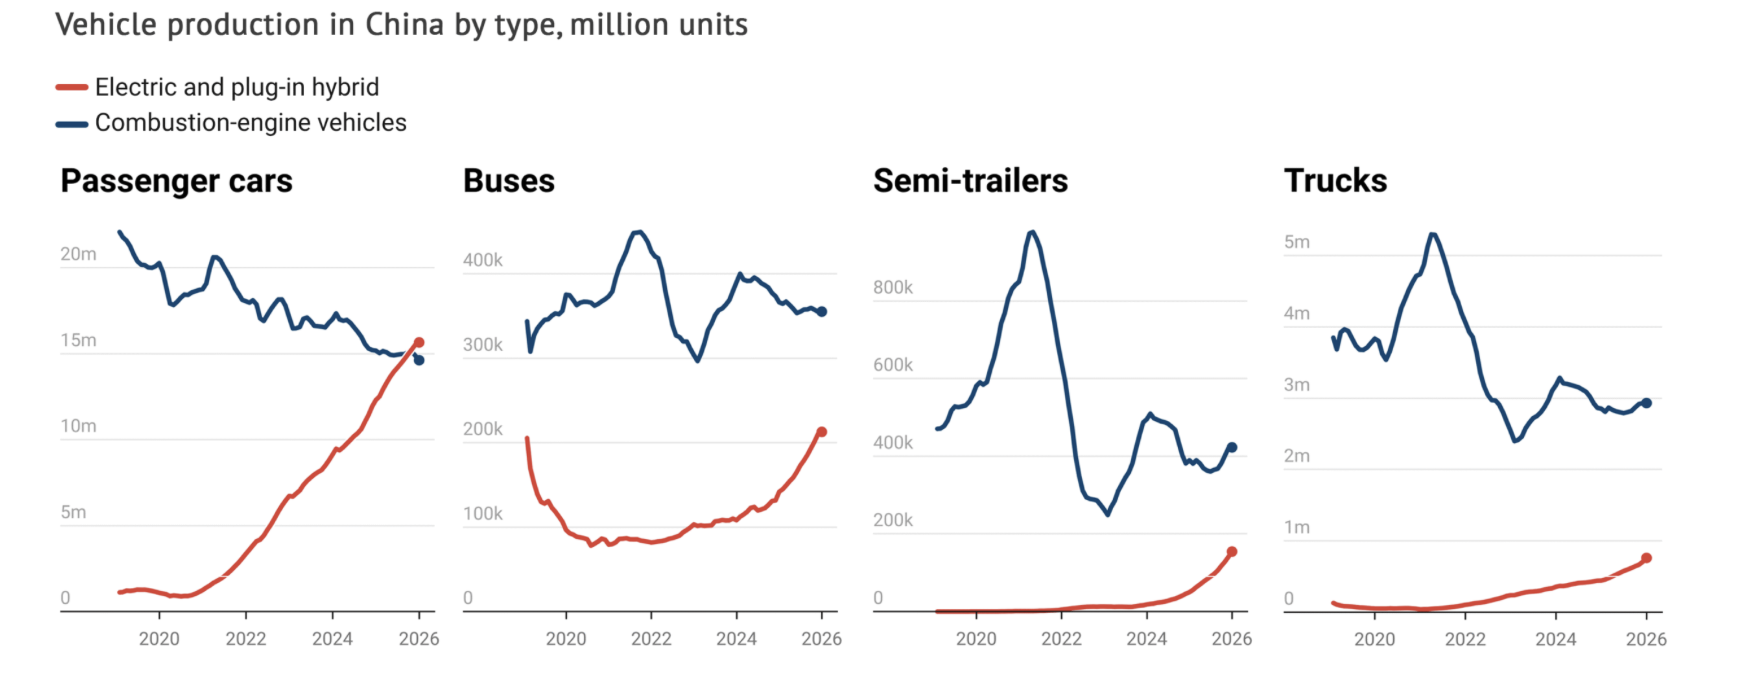
and that extends to trains. Look at the buses, semis and trucks.
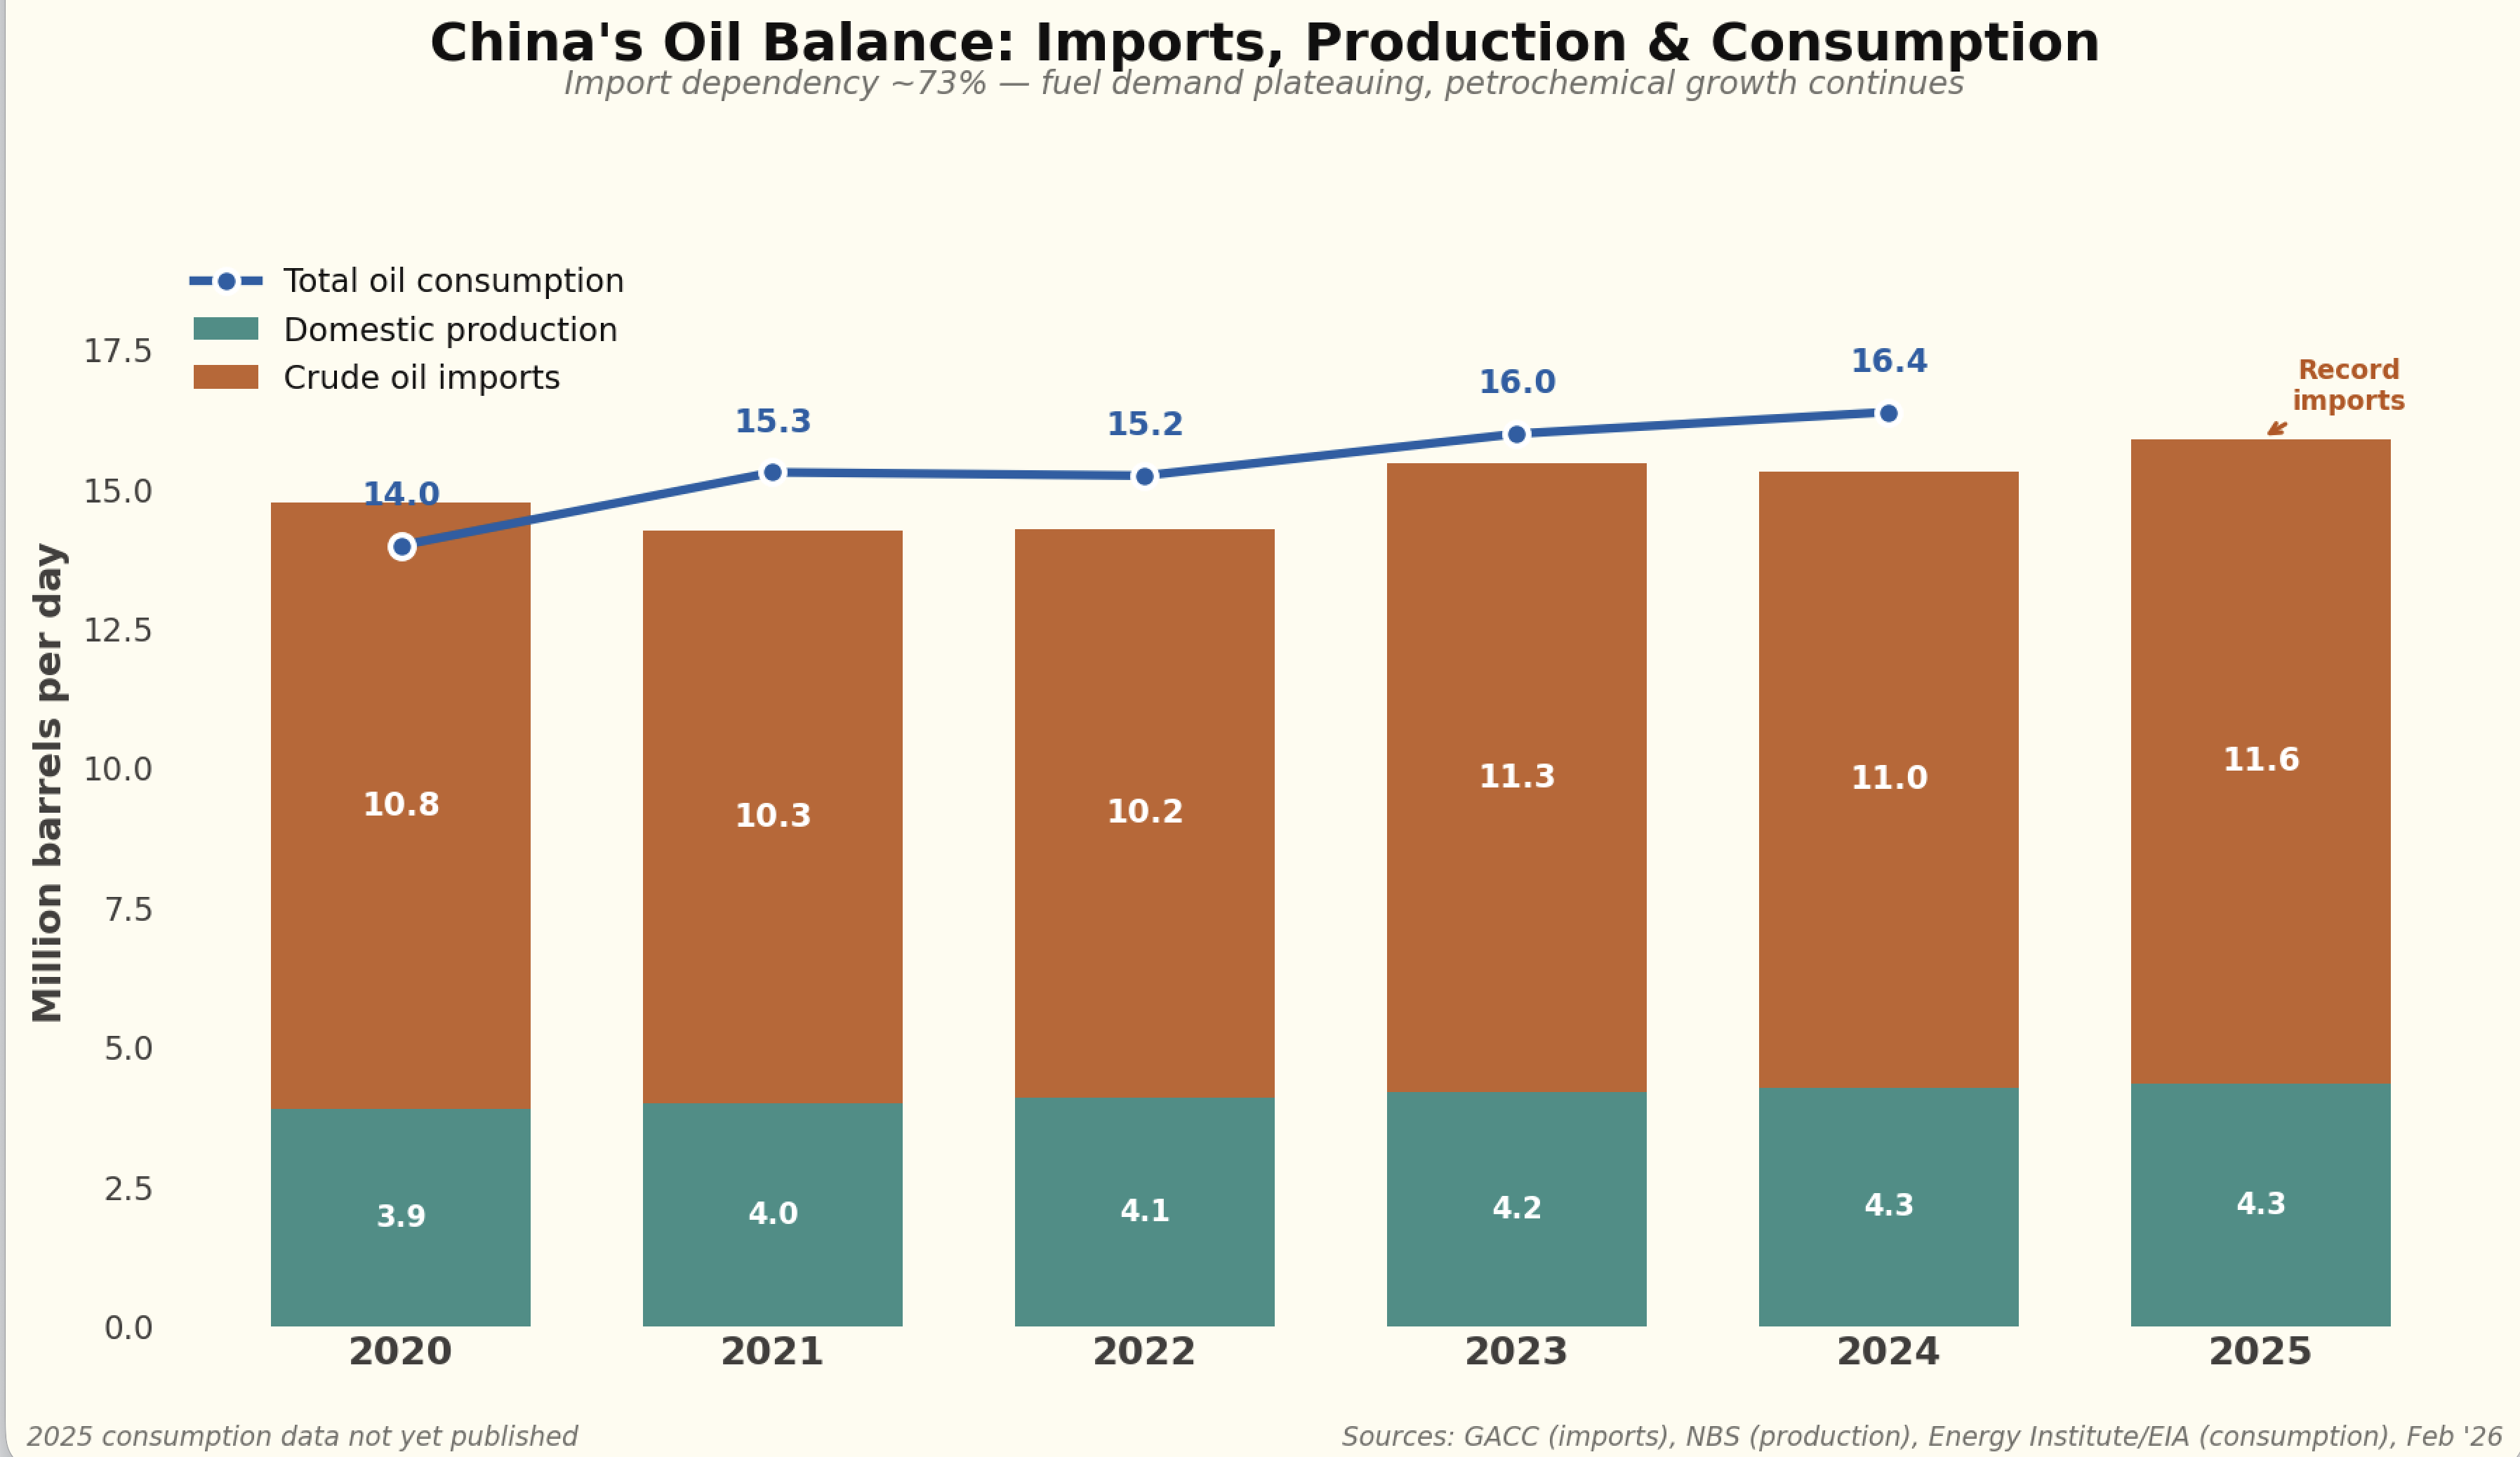
However, on the apparent figures it’s not really showing up in oil consumption. The reason is that petrochemical consumption, itself a big consumer of electricity, is still growing well in China.
But for the electricity sector, coal remains the central story.
Coal: another look behind the numbers
China produces approximately 4.9 billion tonnes (Bt) of raw coal annually, making it the world’s largest coal producer and consumer by a wide margin. When imports of around 0.5 Bt are added, total supply reaches approximately 5.4 Bt — roughly half of global coal consumption.
- Coal quality is declining. Average calorific value is falling as premium seams are exhausted and coal washing rates have dropped from their 2020 peak. More tonnes are needed per unit of useful energy.
- Production costs are rising structurally at approximately US$1.3/t per year, driven by deeper mining, safety regulation and labour costs. The industry-average mine-mouth cost reached 286 yuan/t (US$40/t) in 2024.
- Production costs are probably comparable in $/GJ to Australia and the Australian coal industry isn’t doing all that brilliantly. Globally Indonesia seems to be winning the marginal thermal coal contract for the time being.
Price increases happen in China too. The Qinhuangdao (QHD) 5,500 kcal FOB price is China’s most-watched domestic thermal coal benchmark, published weekly via the BSPI (Bohai-Rim Steam-Coal Price Index).
QHD 5,500 kcal spot price, annual representative levels
| Year | RMB/t | US$/t | A$/t | Phase |
|---|---|---|---|---|
| 2015 | ~385 | 55 | 86 | Overcapacity trough |
| 2016 | ~480 | 70 | 107 | Supply-side reform recovery |
| 2017 | ~630 | 93 | 140 | Post-reform plateau |
| 2018 | ~640 | 97 | 142 | Stable, NDRC “green zone” |
| 2019 | ~590 | 85 | 131 | Mild easing |
| 2020 | ~560 | 83 | 124 | COVID disruption |
| 2021 | ~1,050 avg; 2,600 peak | 163 | 233 | Energy crisis |
| 2022 | ~1,150 avg | 171 | 256 | Price cap + Ukraine shock |
| 2023 | 966 | 137 | 215 | Normalisation |
| 2024 | 863 | 120 | 192 | Decline, oversupply |
| 2025 | 699 (Jan–Nov avg) | 97 | 155 | Trough / recovery |
Source: CEIC QHD 5500 data; SunSirs (2026); Sxcoal (2025). USD/AUD conversions at approximate annual average exchange rates. 2025 full-year: Jan–Nov average 699, Dec settled ~738.
When I had AI review the research, its summary was as follows, and I broadly agree based on my 20 years’ experience following the industry:
the government is deliberately expanding low-cost supply, opening the market to cheap imports, administratively capping contract prices, and allowing renewables to erode coal demand at the margin. The cost of this policy is borne by coal miners through margin compression. Total coal industry profits fell 22% in 2024 (Sxcoal, 2025).
This is sustainable for now because the large state miners remain profitable — China Shenhua’s mine-mouth cost of 179 RMB/t leaves ample margin even at 675 RMB contract prices (Futunn, 2024). But the high-cost tail of small mines is being slowly killed, which is arguably the policy intent. China’s mine count has consolidated from 64,000 in 1997 to approximately 4,500 by 2024 (Global Energy Monitor, 2024). The government is effectively using price policy to accelerate this consolidation: squeeze margins, let the weakest exit, and concentrate production in fewer, larger, more efficient operations.
The binding constraint is visible in the data. At the June 2025 QHD low of 610 RMB, average Shanxi producers were at breakeven. The price bounced hard to 830 RMB within five months (SunSirs, 2026). The cost floor is real, and the NDRC’s 675 benchmark implicitly acknowledges where it sits. Prices can fall to the cost floor — but not through it for long.
Electricity at the generator level is comparable to Australia
I’ve known this for many years but try telling senior management in manufacturing. They don’t want to know. Despite all China’s low costs, despite whatever they do to control the market, despite how hard it is to decarbonise in Australia, the electricity prices are similar. Of course, when transmission and many other things are allowed for, the picture can be different. But the main message remains: Australia is competitive on electricity at the generation level, and if we get on with new supply we will be advantaged.
On-grid tariffs achieved (2024)
Average on-grid electricity tariff by company (2024)
| Company (listed arm) | 2024 tariff (RMB/MWh) | A$/MWh | YoY change |
|---|---|---|---|
| Huadian Power (600027) | 512 | 114 | -1.0% |
| Huaneng Power (600011) | 494 | 110 | -2.9% |
| Datang Power (601991) | 451 | 100 | -3.2% |
| Guodian Power (600795) | 430 | 96 | -6.8% |
| China Shenhua (601088) | 403 | 90 | -2.7% |
Source: 2024 annual reports and HKEX filings via TipRanks (2025d); TipRanks (2025b); TipRanks (2025c); China Power News Network (2025); TipRanks (2025a).
Tariffs declined 1–7% across the board as lower coal costs flowed through to market-based pricing. Approximately 87% of power is now traded on spot/contract markets rather than at administered benchmark tariffs (Sina Finance, 2025). Coal-fired on-grid tariffs can float up to 20% above or below provincial benchmarks — Huaneng reported its coal tariff was 13.25% above benchmark in 2024.
Tariffs by fuel type
Huaneng Power provides a useful breakdown (GuruFocus, 2024):
Huaneng Power on-grid tariff by fuel type (2024)
| Fuel type | RMB/MWh | A$/MWh |
|---|---|---|
| Biomass | 749 | 166 |
| Gas-fired | 712 | 158 |
| Wind | 519 | 115 |
| Coal-fired | 446 | 99 |
| Solar | 430 | 96 |
| Hydro | 361 | 80 |
Source: Huaneng Power Q3 2024 earnings call (GuruFocus, 2024).
China’s electricity generators end up paying say A$65/MWh for coal. The same number I recently calculated and published here, when looking at how batteries will take market share, not just price, from coal in Australia.
In short, there is something for everyone in China’s energy numbers. The bulls can point to a coal fleet still growing and utilisation that, while falling, remains enormous in absolute terms. The bears can point to the sheer scale of renewable additions, the first decline in coal-fuelled generation, and an industry where margins are being deliberately compressed. The direction of travel is clear; the pace remains the question.