AEMO is right again, demand is growing
Finally got around to adding consumption into my dashboard. There are various definitions of consumption and demand but the one that I am most interested in right now, is total consumption excluding consumption for utility battery charging. Battery charging shifts energy from one time to another in the process mostly using midday solar energy that would otherwise be wasted (spilled). So in this definition
\(consumption = operational demand (supply) + rooftop(supply) - utility battery charging\)
I downloaded the data from NEMWEB and may well have made mistakes but looking at the NEM in total for the past three years I get:
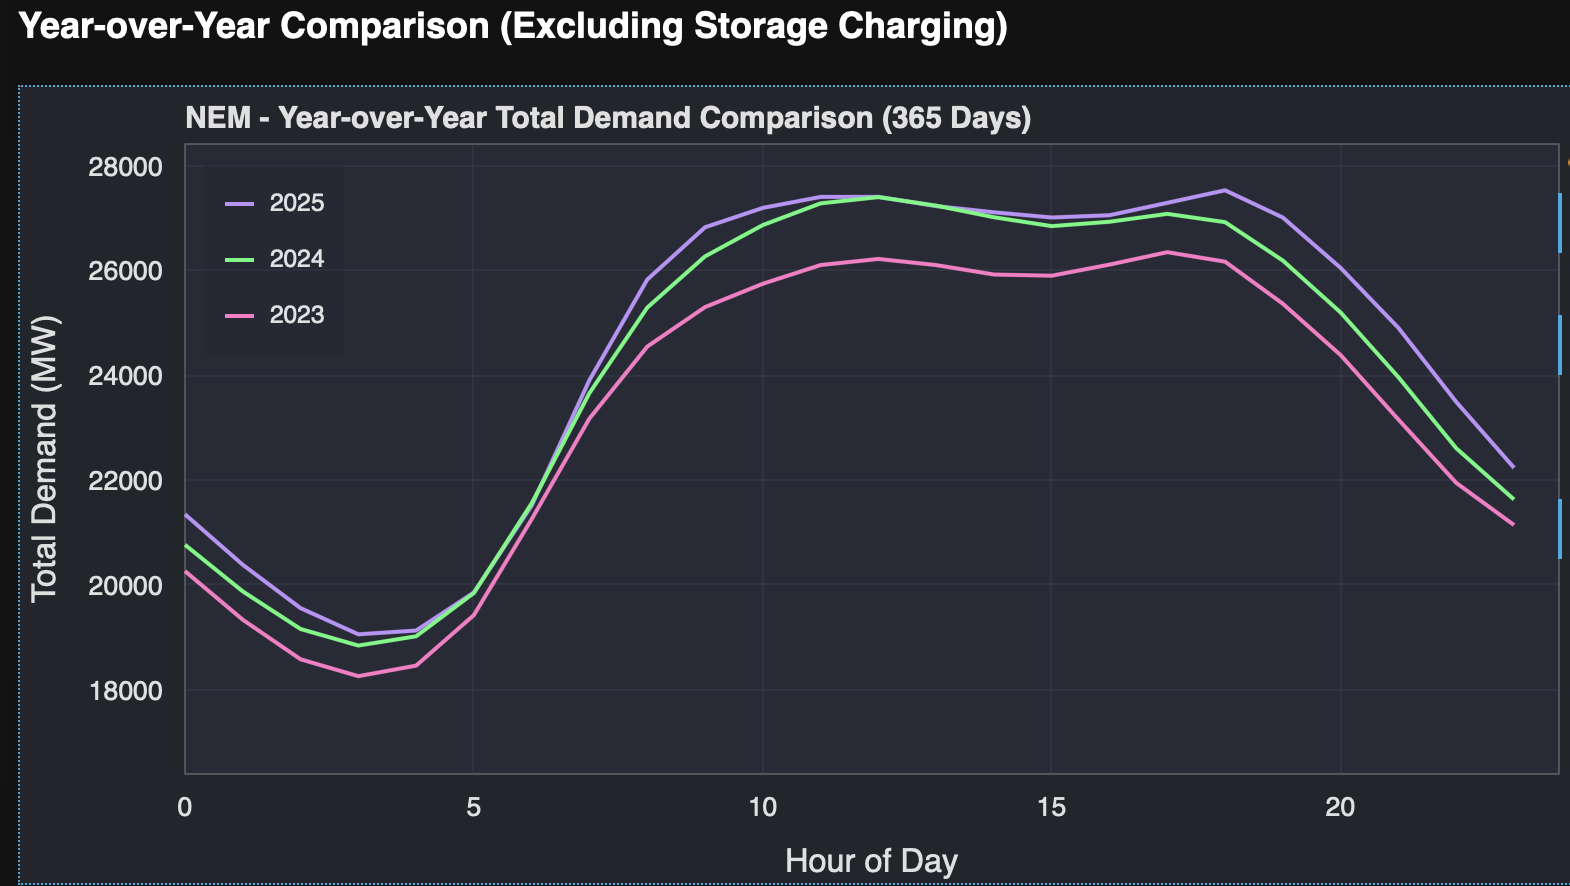
I suspect that population growth is the biggest driver of this increase, but you would need access to distributor data to really see what’s going on between the different segments. Thanks to the AER, distributors are required to publish lots of interesting data in their RIN statements but that is only on an annual basis.
State by State a summary for the past 365 days compared with the prior corresponding period is:
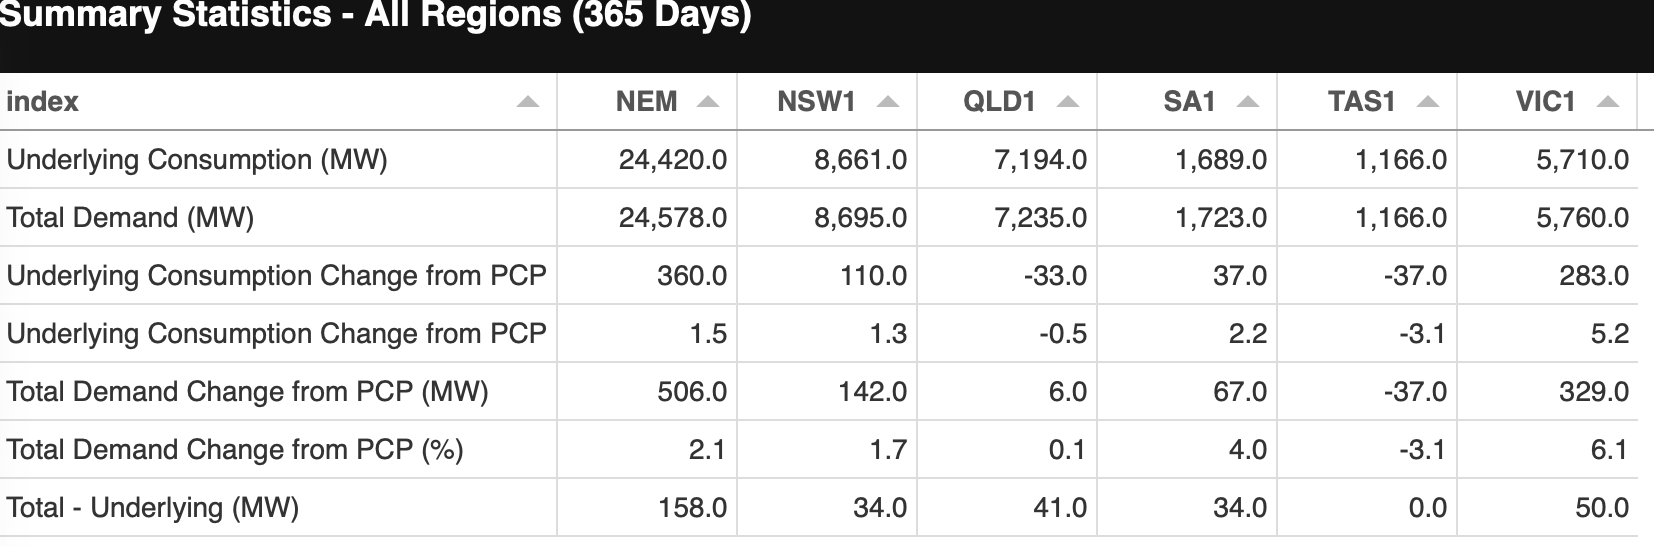
Underlying consumption is up 360 MW or 1.5% which is a very healthy rate of growth if I have done the sums correctly. Some due to EVs probably, some due to weather, maybe some due to data centres etc and probably the biggest part due to population growth. Total demand in the table includes utility battery and pumped hydro charging in the demand total.
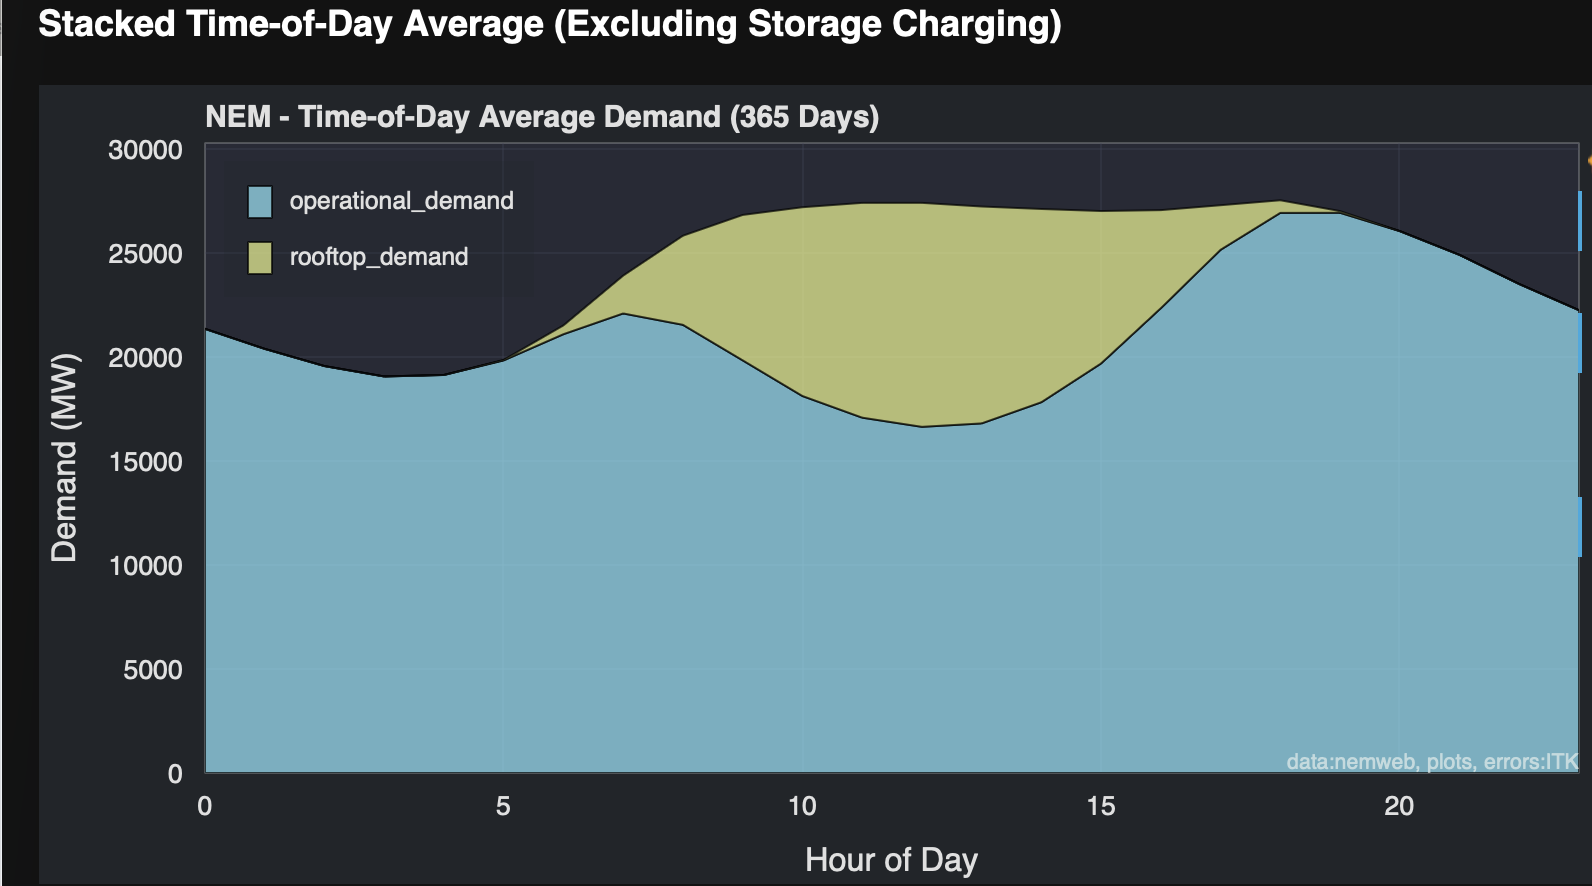
Not only is consumption increasing on this metric but the demand shape is changing as well. That can be seen a little more clearly in a 90 day view. I’ve used NSW and to be fair the daily pattern of consumption moves around from region to region
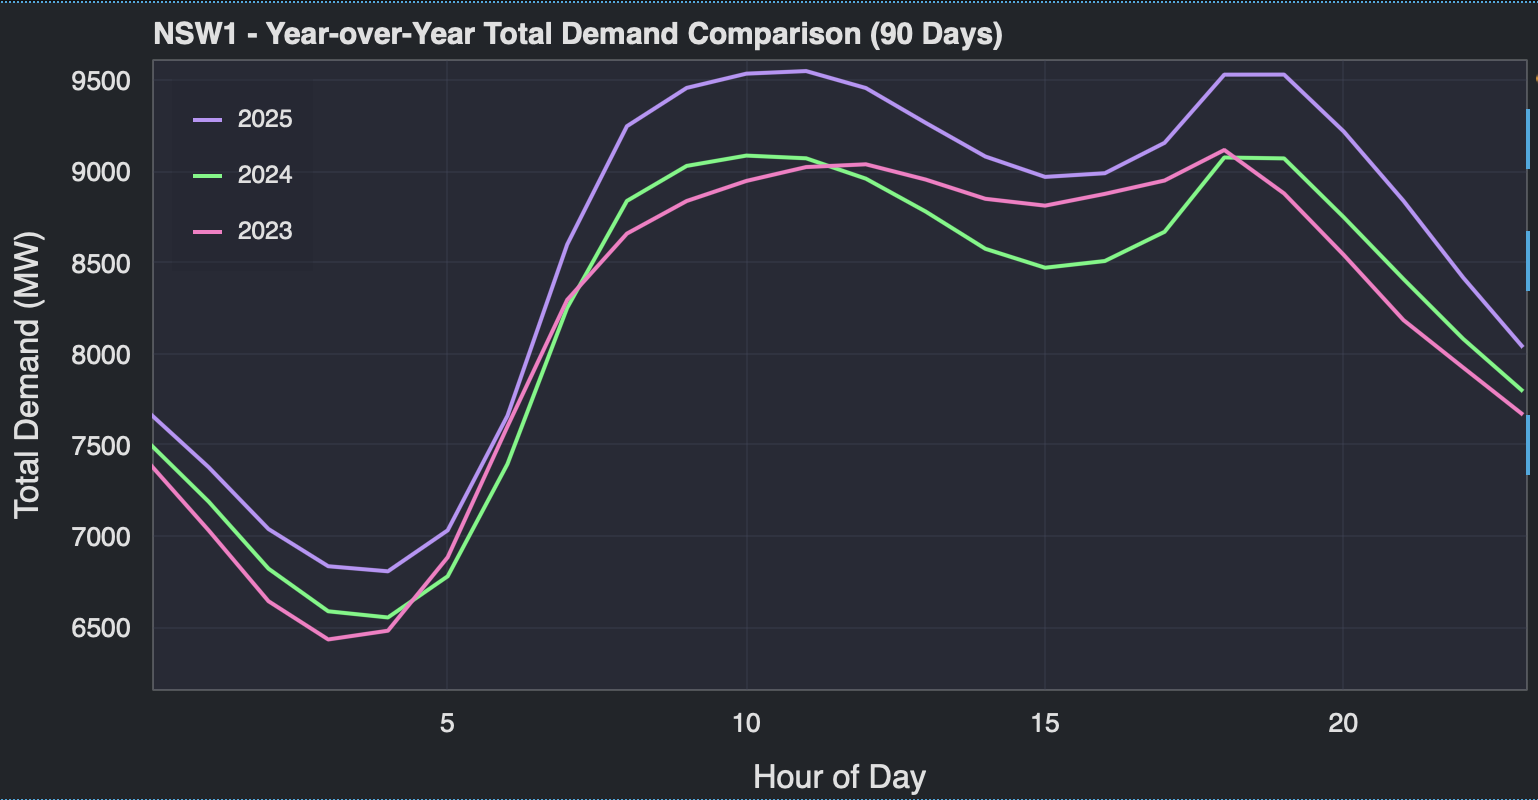
But the point here is that from an overall system perspective, the evening peak demand is not really that much above demand around 10 AM-11 AM. That may indicate some shifting of consumption patterns, or it may just be an artefact.
Of course at 10 AM (QLD time) solar is able to supply demand and prices are low. Solar can’t supply the evening peak so prices are much higher, as we all know.
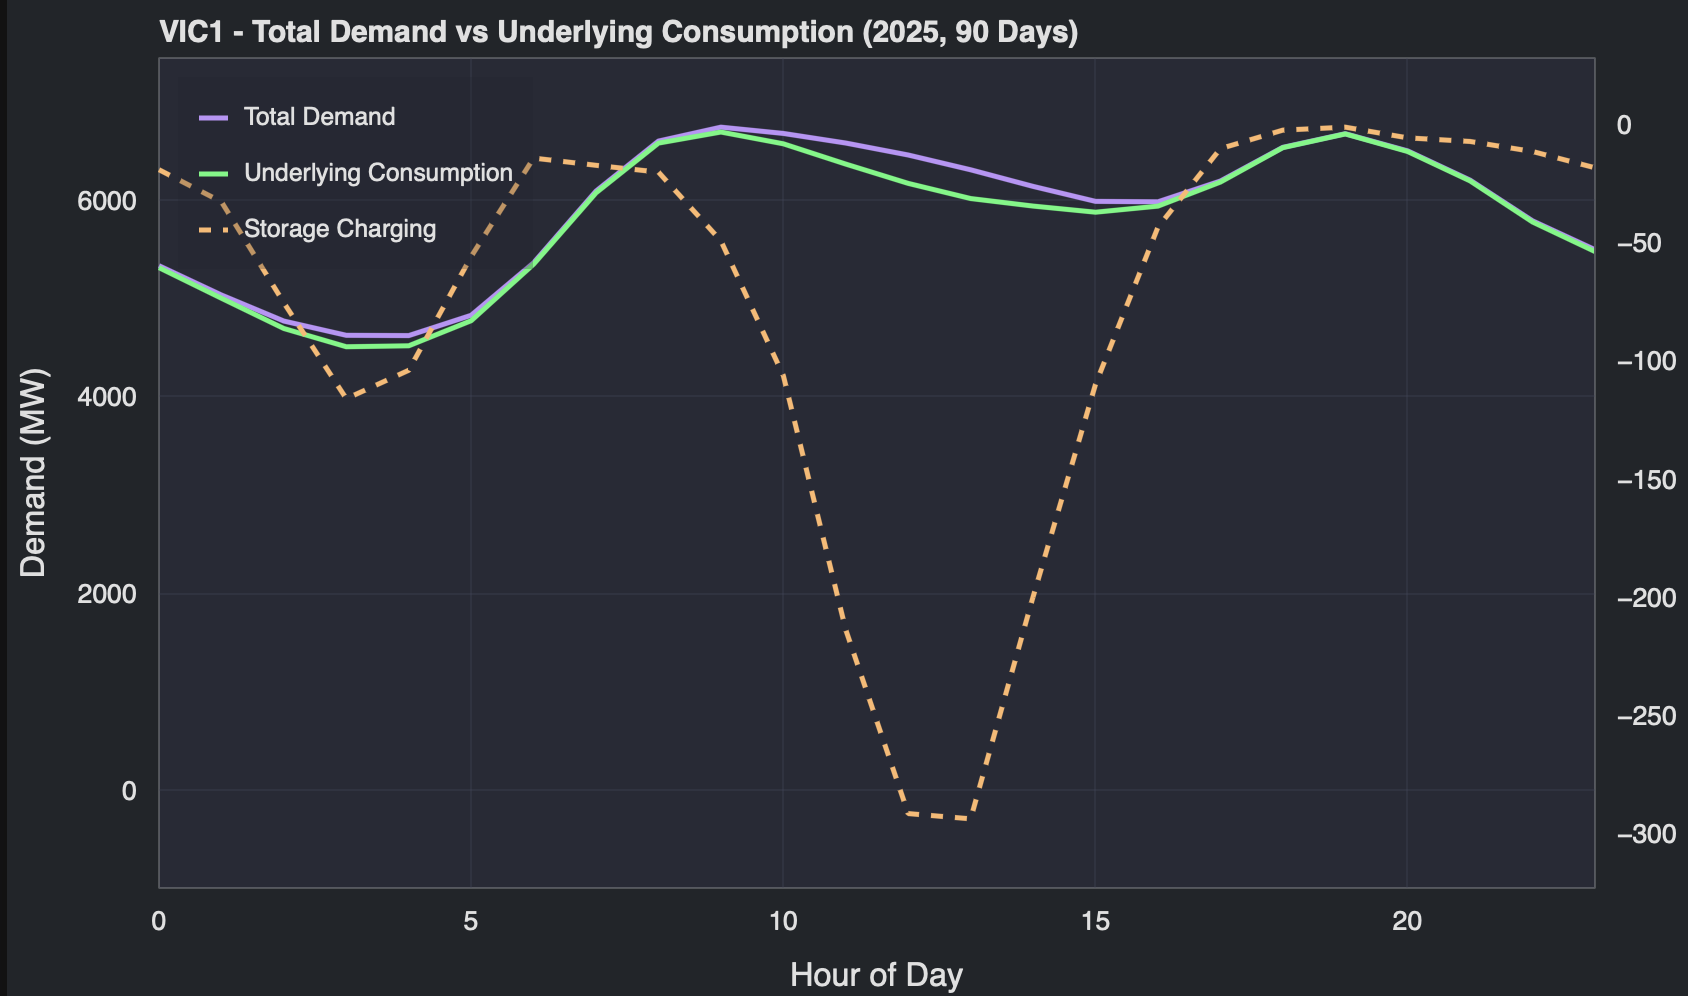
And finally we can see consumption, for example, Victoria with and without battery charging (charging is negative supply) and it’s 90 days because batteries are commissioning regularly now.