Learnings from Texas
ERCOT is the main grid in Texas with about 90,000 km of Transmission serving 26 million people and businesses. Maximum demand is over 80 GW and total energy delivered in 2023 was 440 TWh
In short notwithstanding that Australia has a relatively energy and electricity intensive economy we only have half the consumption per capita of Texas. On the other hand Texas has a relatively tiny behind the meter sector whereas of course in the NEM there is around 20 GW of behind the meter solar.
The casual conclusions from this brief survey are that ERCOT has been able to manage a 20% increase in demand over 5 years, 30 GW of new utility solar, 19 GW of new utility batteries and about 7 GW of new wind, as well as some gas without blowing up the system. The ERCOT connection modelling seems to proceed efficiently and the transmission system, next to none of which is presently over 375 KV has been able to cope. It does seem that transmission constraints are increasing. Equally the investment in batteries is very strong and it seems that even in gas strong networks there is a big role for batteries. Gas generation has increased in line with demand growth but gas generation capacity increases are very modest. Coal generation capacity and share of energy have declined and nuclear has also lost share despite steady output. In pragmatic TX the trajectory is not dissimilar to Australia, and that’s with only the support of things like the Federal Inflation Reduction Act (IRA) and otherwise no State policy support. For TX the opportunity for policy is likely behind the meter as a TX is a State subject to regular severe weather events.
Equally if I thought bitcoin mining was a useful human activity looking at ERCOT would make me think there could be few better places in the world to do bitcoin mining than Australia, its energy intensive and interruptible. BINGO.
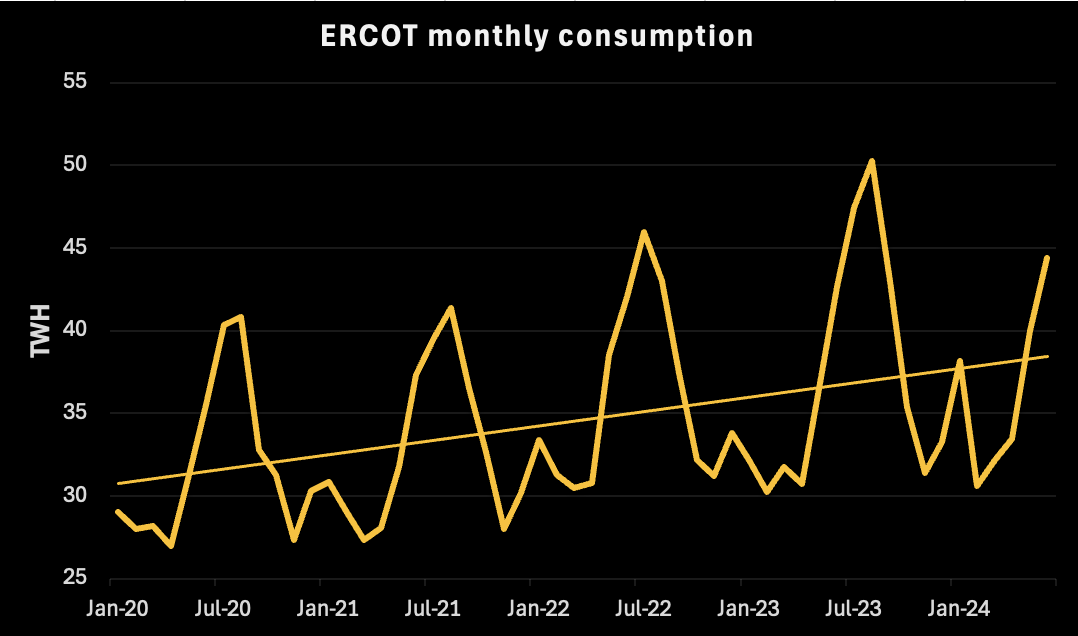
Demand has grown 22% since 2020
Interestingly the demand growth has tended to be spiky, related to severe weather events. Equally and to me ironically, the Permian Basin (the premier gas and oil basin in the USA) will end up consuming around 15 GW of more or less flat load electricity used in the well operation, field compression and pumping.
Another source of demand growth, extent unknown, is bitcoin mining. Although bitcoin doesn’t have the cachet of AI or of a conventional data centre it does have the advantage of being easily interrupted. Bitcoin mining would be an excellent demand soak for Australian solar, where if you just ran at lunchtime your electricity cost would just be the poles and wires, the energy itself would be some of the cheapest in the world.
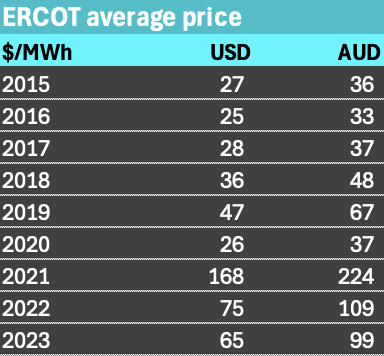
Prices are just as high as in the NEM
The 2023 average price in ERCOT was about A$99/MWh quite similar to Australia. There are specific reasons why the price is what it is and it may go down. From another perspective Texas has seen a similar price trajectory to Australia. Prices shot up for various reasons to previously unheard of levels and now have partially retraced.
Heaps of renewables and heaps of gas
In ERCOT for a variety of reasons, solar has gained market share, gas and wind have grown and held reasonably steady share. Coal share has declined and nuclear share is also down a bit even though output is virtually flat. Nuclear is now the smallest of the major fuels in TX. There is virtually no hydro generation. The growth in gas consumption has been in open cycle/peaker. That’s of course more carbon intensive that combined cycle. Solar will overtake coal within 12 months.
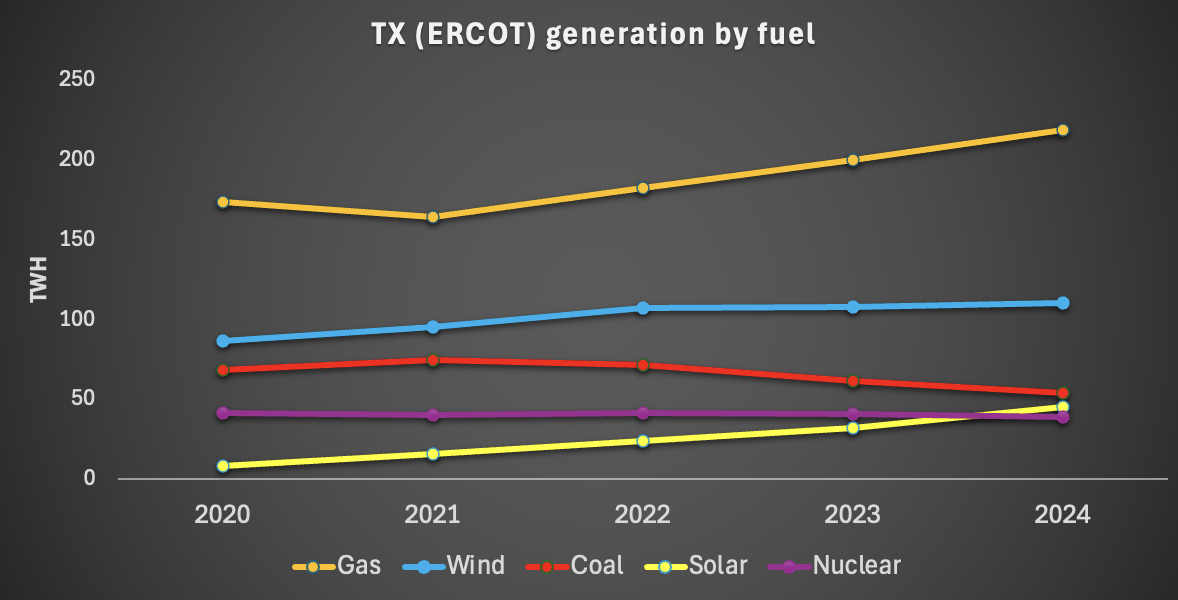
TX lags badly in behind the meter resources. It even lags well behind States like California never mind Australia. In the long run this will probably cost the State as behind the meter done well, and including household batteries ultimately results in a more resilient grid. And as TX is prone to weather disruptions, disruptions that may well become worse, grid resilience might be given more attention. But what would an aussie amateur know? As the generation by fuel figure shows, for the moment the weather events have resulted in growth in gas fuelled electricity as much as solar.
30 GW of solar added in 3 years, 15 GW of batteries
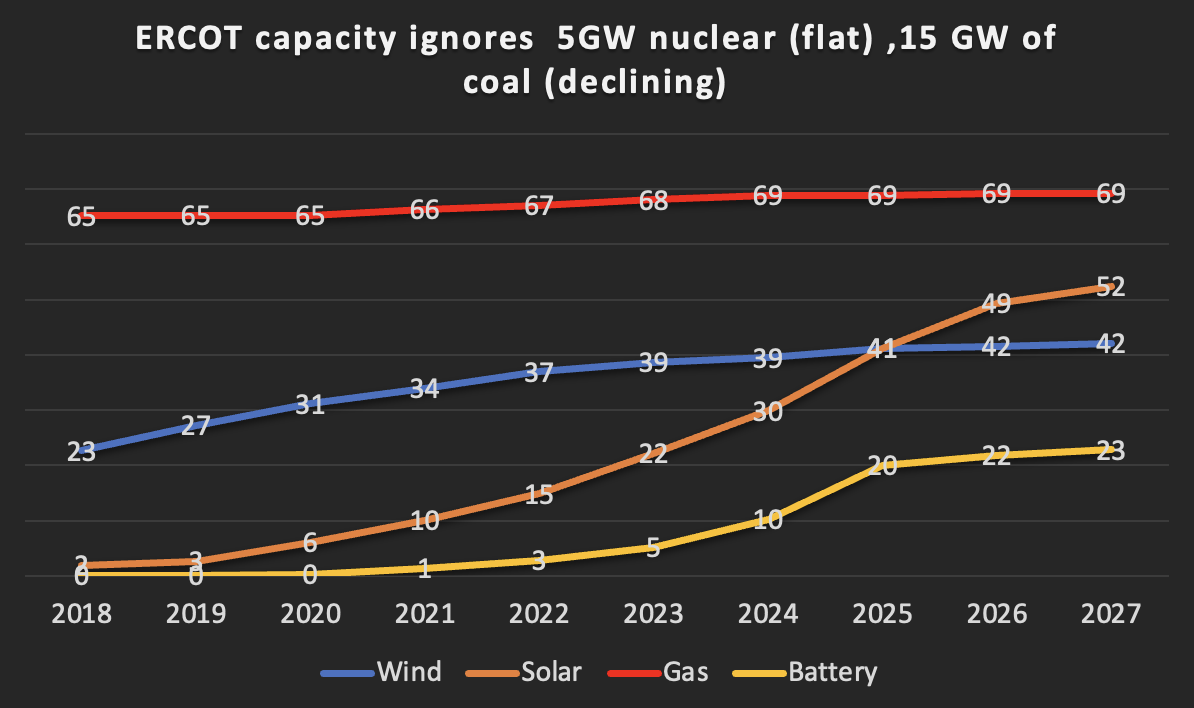
Note above table includes projects planned where financial security is posted as well as those operational. Between 2021 and 2025 31 GW of solar will be added and 19 GW of batteries. Most of this will be done without massive additions to the transmission network, but I guess for me it emphasises the ability of the ERCOT system to do the grid connection studies and get the projects connected. 7 GW of wind also added.
Comparing the capacity and energy charts it looks like gas capacity utilisation has increased. However it seems clear that gas has expanded enough for the time being, according to investors, and that the investment dollars for dispatchibility are flowing to batteries.