It’s replacing $40 bn of annual oil imports stupid
There are lots of sound reasons for Australia to go hard on EVs, much harder than it currently does. But the number one reason that should appeal to Treasury is we get the equivalent of a new export industry. Replacing oil imports is pretty much the same as increasing exports. Why go through all the pain of having new LNG facilities and new coal mines when we can just kill oil imports and get a lot of votes in the process? Of the three main policy reviews this year—(i) safeguards, (ii) EV FBT concession and (iii) EV strategy—it’s the third that provides the biggest opportunity to improve Australia, to win votes, to increase the average Australian’s wealth via a stronger $, to decarbonise a significant sector, to reduce strategic risk and to increase public health.
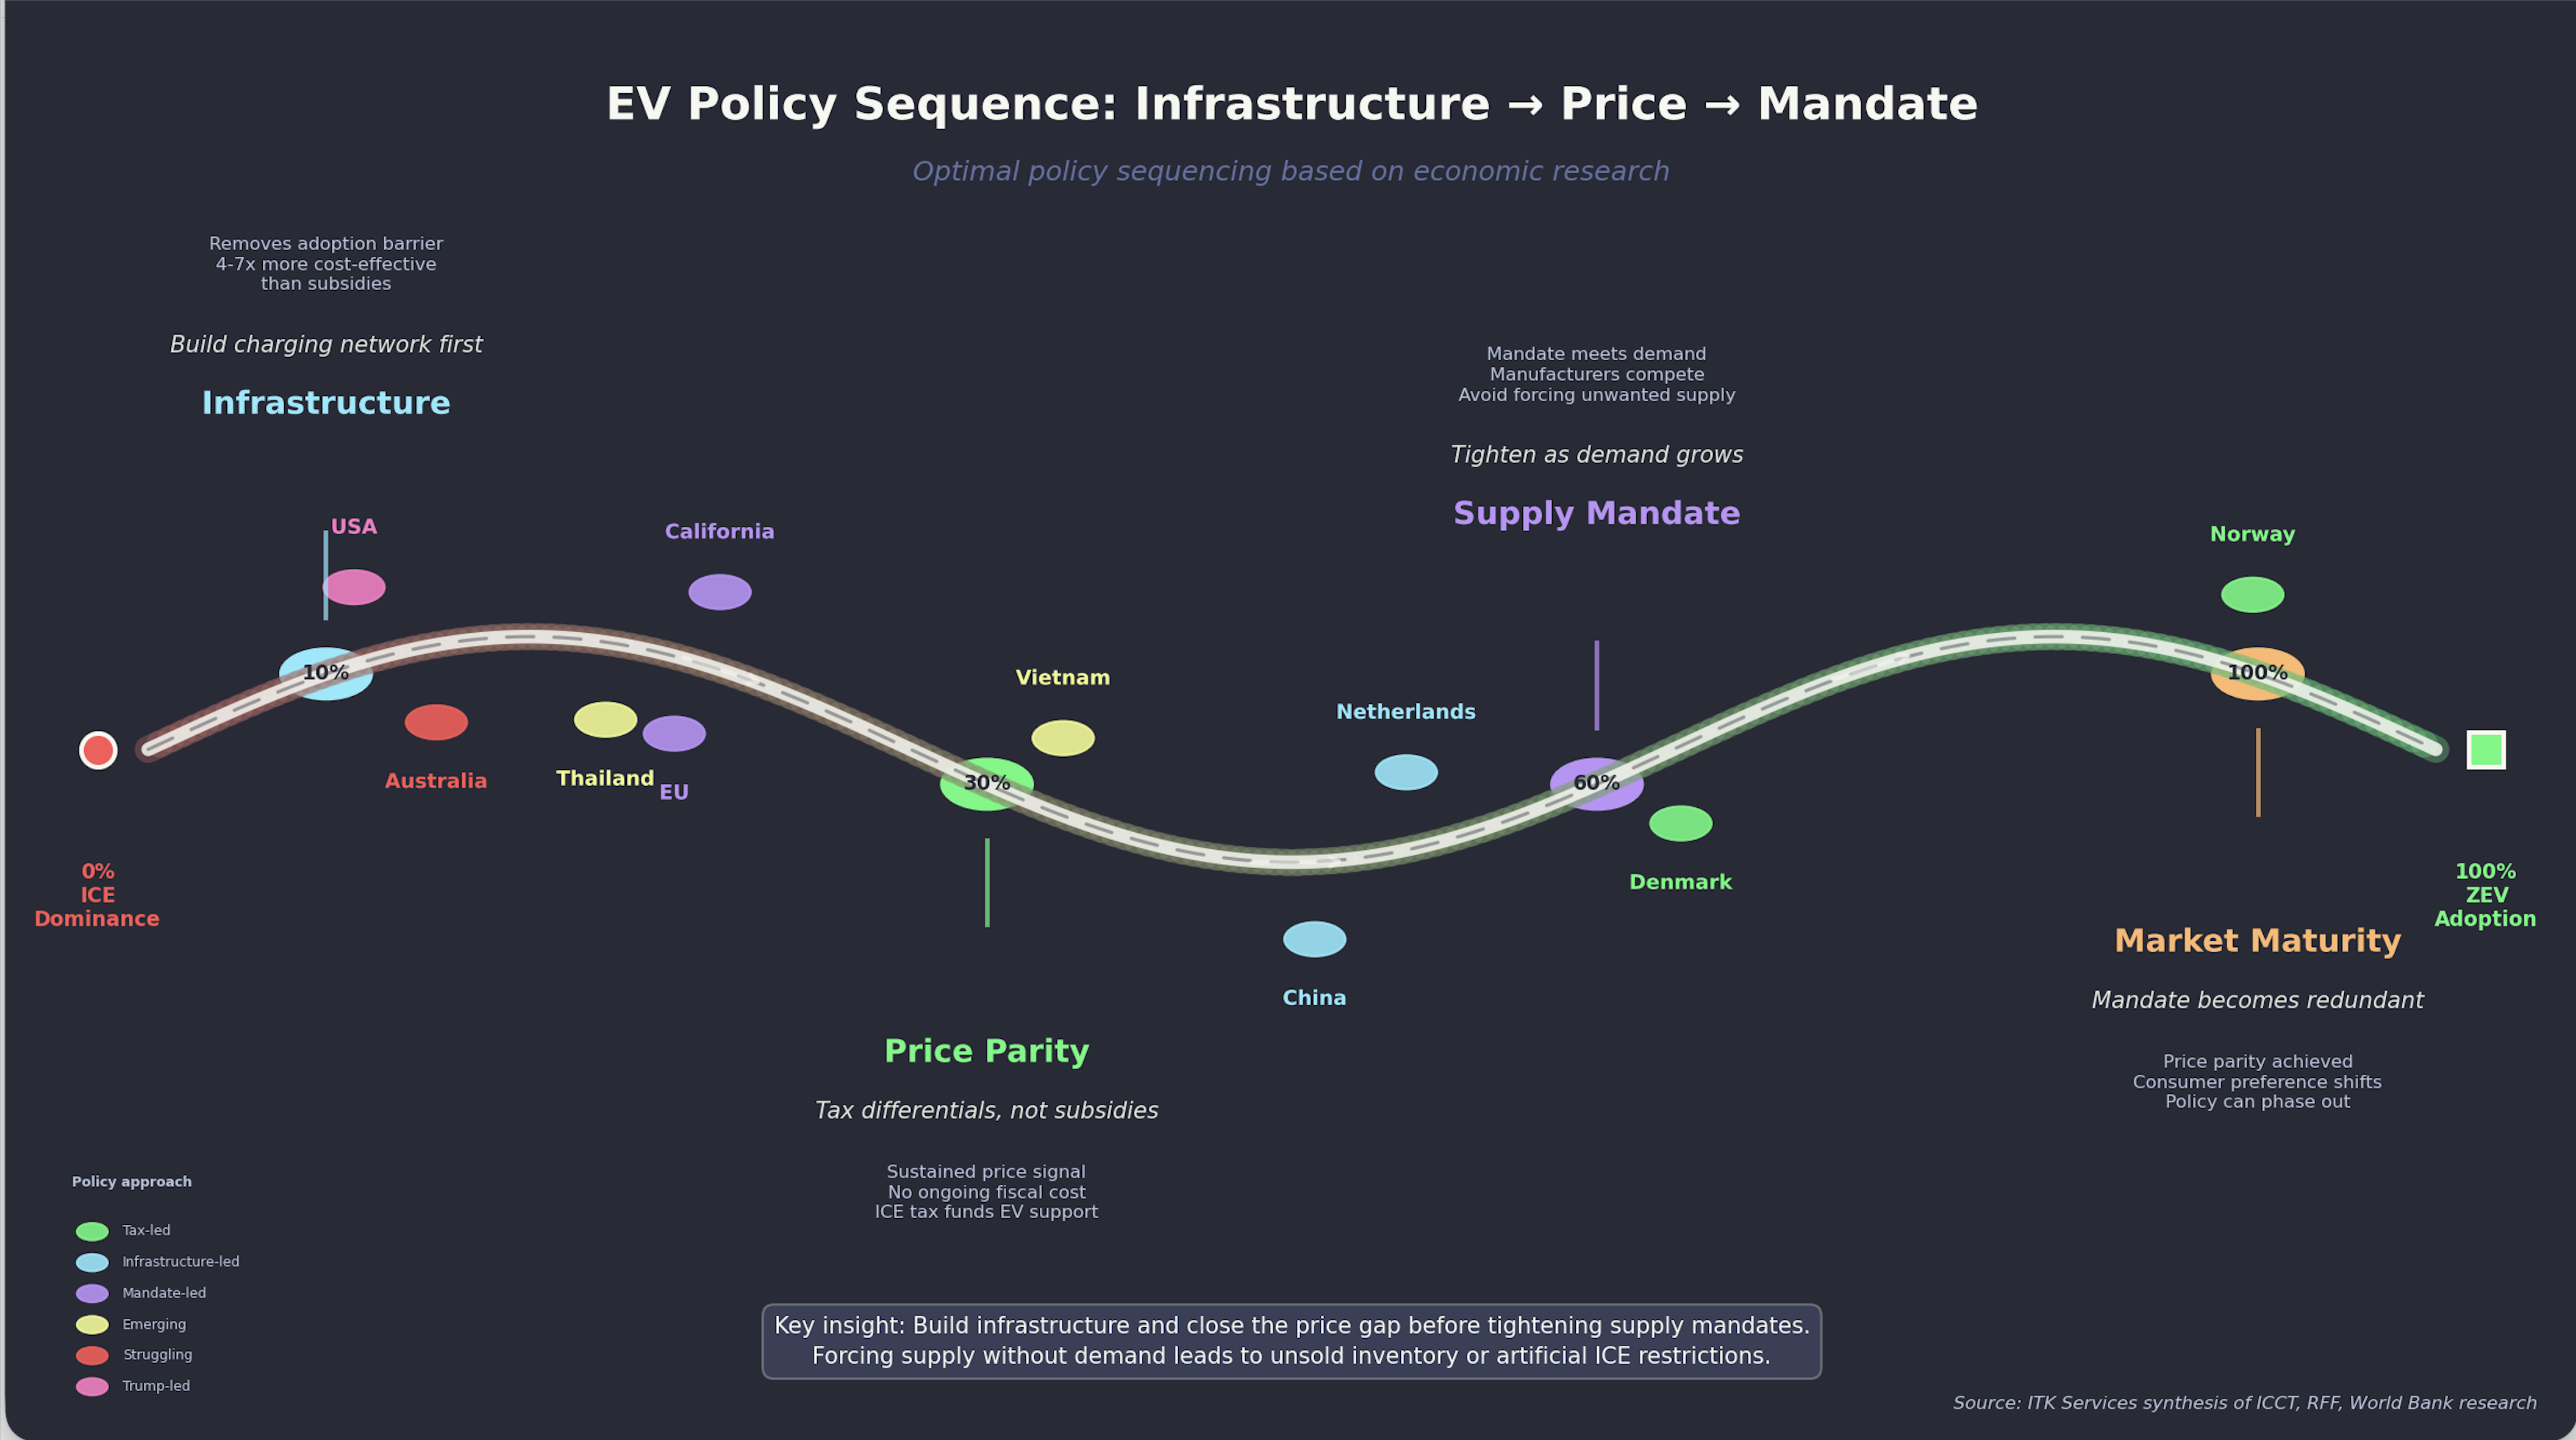
In this note we cover what policy works and the sequencing that Australia’s EV strategy review of the 2023 policy should implement. It requires going much harder on charging infrastructure, and building future proof infrastructure, ie over powering, then providing consumer incentives, like the FBT but available to all, to close the price gap. Home batteries showed how this can take off. State driven cheap incentive like bus lanes and rego can further drive consumer demand but provide sunset clauses. As consumer demand grows force a supply response via a mandate. In Asia, countries have seen it as in their national interest to promote EV manufacturing as a way to grow a new industry at the expense of traditional manufacturers like Japan. China, Vietnam and via partnerships Thailand have gone this way.
China has provided arguably between US$200 bn and US$300 bn of subsidies to its EV car manufacturers. The ethics of this are one thing but Australia should take advantage of those subsidies to accelerate EV adoption in Australia. Effectively, China pays for our cars. We shouldn’t look this gift horse in the mouth—just use Australian policy to accelerate adoption.
One policy option that emerges from this research is to exempt EVs from GST.
No carbon price but lots of Federal Policy
In 2026 there are three known official Federal Government policy reviews for which the outcome is uncertain. One, the EV FBT exemption review is “live” whereas the Safeguard Mechanism and the National EV strategy reviews are yet to formally commence. I expect there are also ongoing informal reviews, particularly of the effectiveness of the CIS in actually inducing new supply, then there is the Tomago-Snowy “back channel” policy.
On top of what the Federal Government is officially and even unofficially, there are also significant AEMC reviews and of course all the States have a bunch of policies and reviews. Overview of Federal Review
Summary of Federal Energy Policy Reviews
| Review | Status | Submissions | Published | Agency | Key Focus |
|---|---|---|---|---|---|
| Gas Market | Implementation | Not open | ✗ | DCCEEW/DISR/ACCC | Domestic reservation scheme (15-25%); LNG netback methodology |
| DMO Framework | Implementation | Closed | ✓ | AER | Electricity price caps; tariff caps; embedded networks; Solar Sharer Offer |
| NEM Wholesale Market | Implementation | Closed | ✓ | Energy Ministers | Market liquidity; Market-Making Obligation; ESEM |
| Cheaper Home Batteries | Active | N/A | — | DCCEEW | ~200k installations; $7.2B program; 2M batteries by 2030 |
| Electric Car Discount | Review | Open | ✗ | Treasury/DCCEEW | FBT exemption effectiveness; $1.35B cost; PHEV eligibility |
| National EV Strategy | Pending | Not open | ✗ | DCCEEW | Uptake progress; charging infrastructure; regional equity |
| Safeguard Mechanism | Pending | Not open | ✗ | DCCEEW | Post-2030 decline rates; offset limits; 2035 NDC alignment |
Source: Author compilation from government announcements
Much of this policy could have been minimised if Australia had stuck with the carbon tax. Abolishing the tax has in the end achieved little, coal generators are still going to close, EVs are still slowly gaining market share, renewable generation has grown steadily and it’s likely the seeds for further growth, in the form of FID for several GW of renewables, will be planted this year. The required transmission upgrades are mostly proceeding.
If we had done some of this work back when the carbon tax was in place and stayed ahead of the rest of the world it would have been a lot cheaper but to be fair the delay has enabled technology solutions like inverter based grids to move out of the lab into the actual grid.
Carbon scoreboard
Although you can make excuses about carbon by relating emissions to population and/or GDP, in the end the physics of carbon are driven entirely by the longer wave infrared absorption and rejection of the carbon in the atmosphere. More carbon more global warming, population and GDP be damned.
Equally I have excluded land use and forestry from the Australian scorecard because I think they are used to make it seem that Australia is making more progress than it actually is.
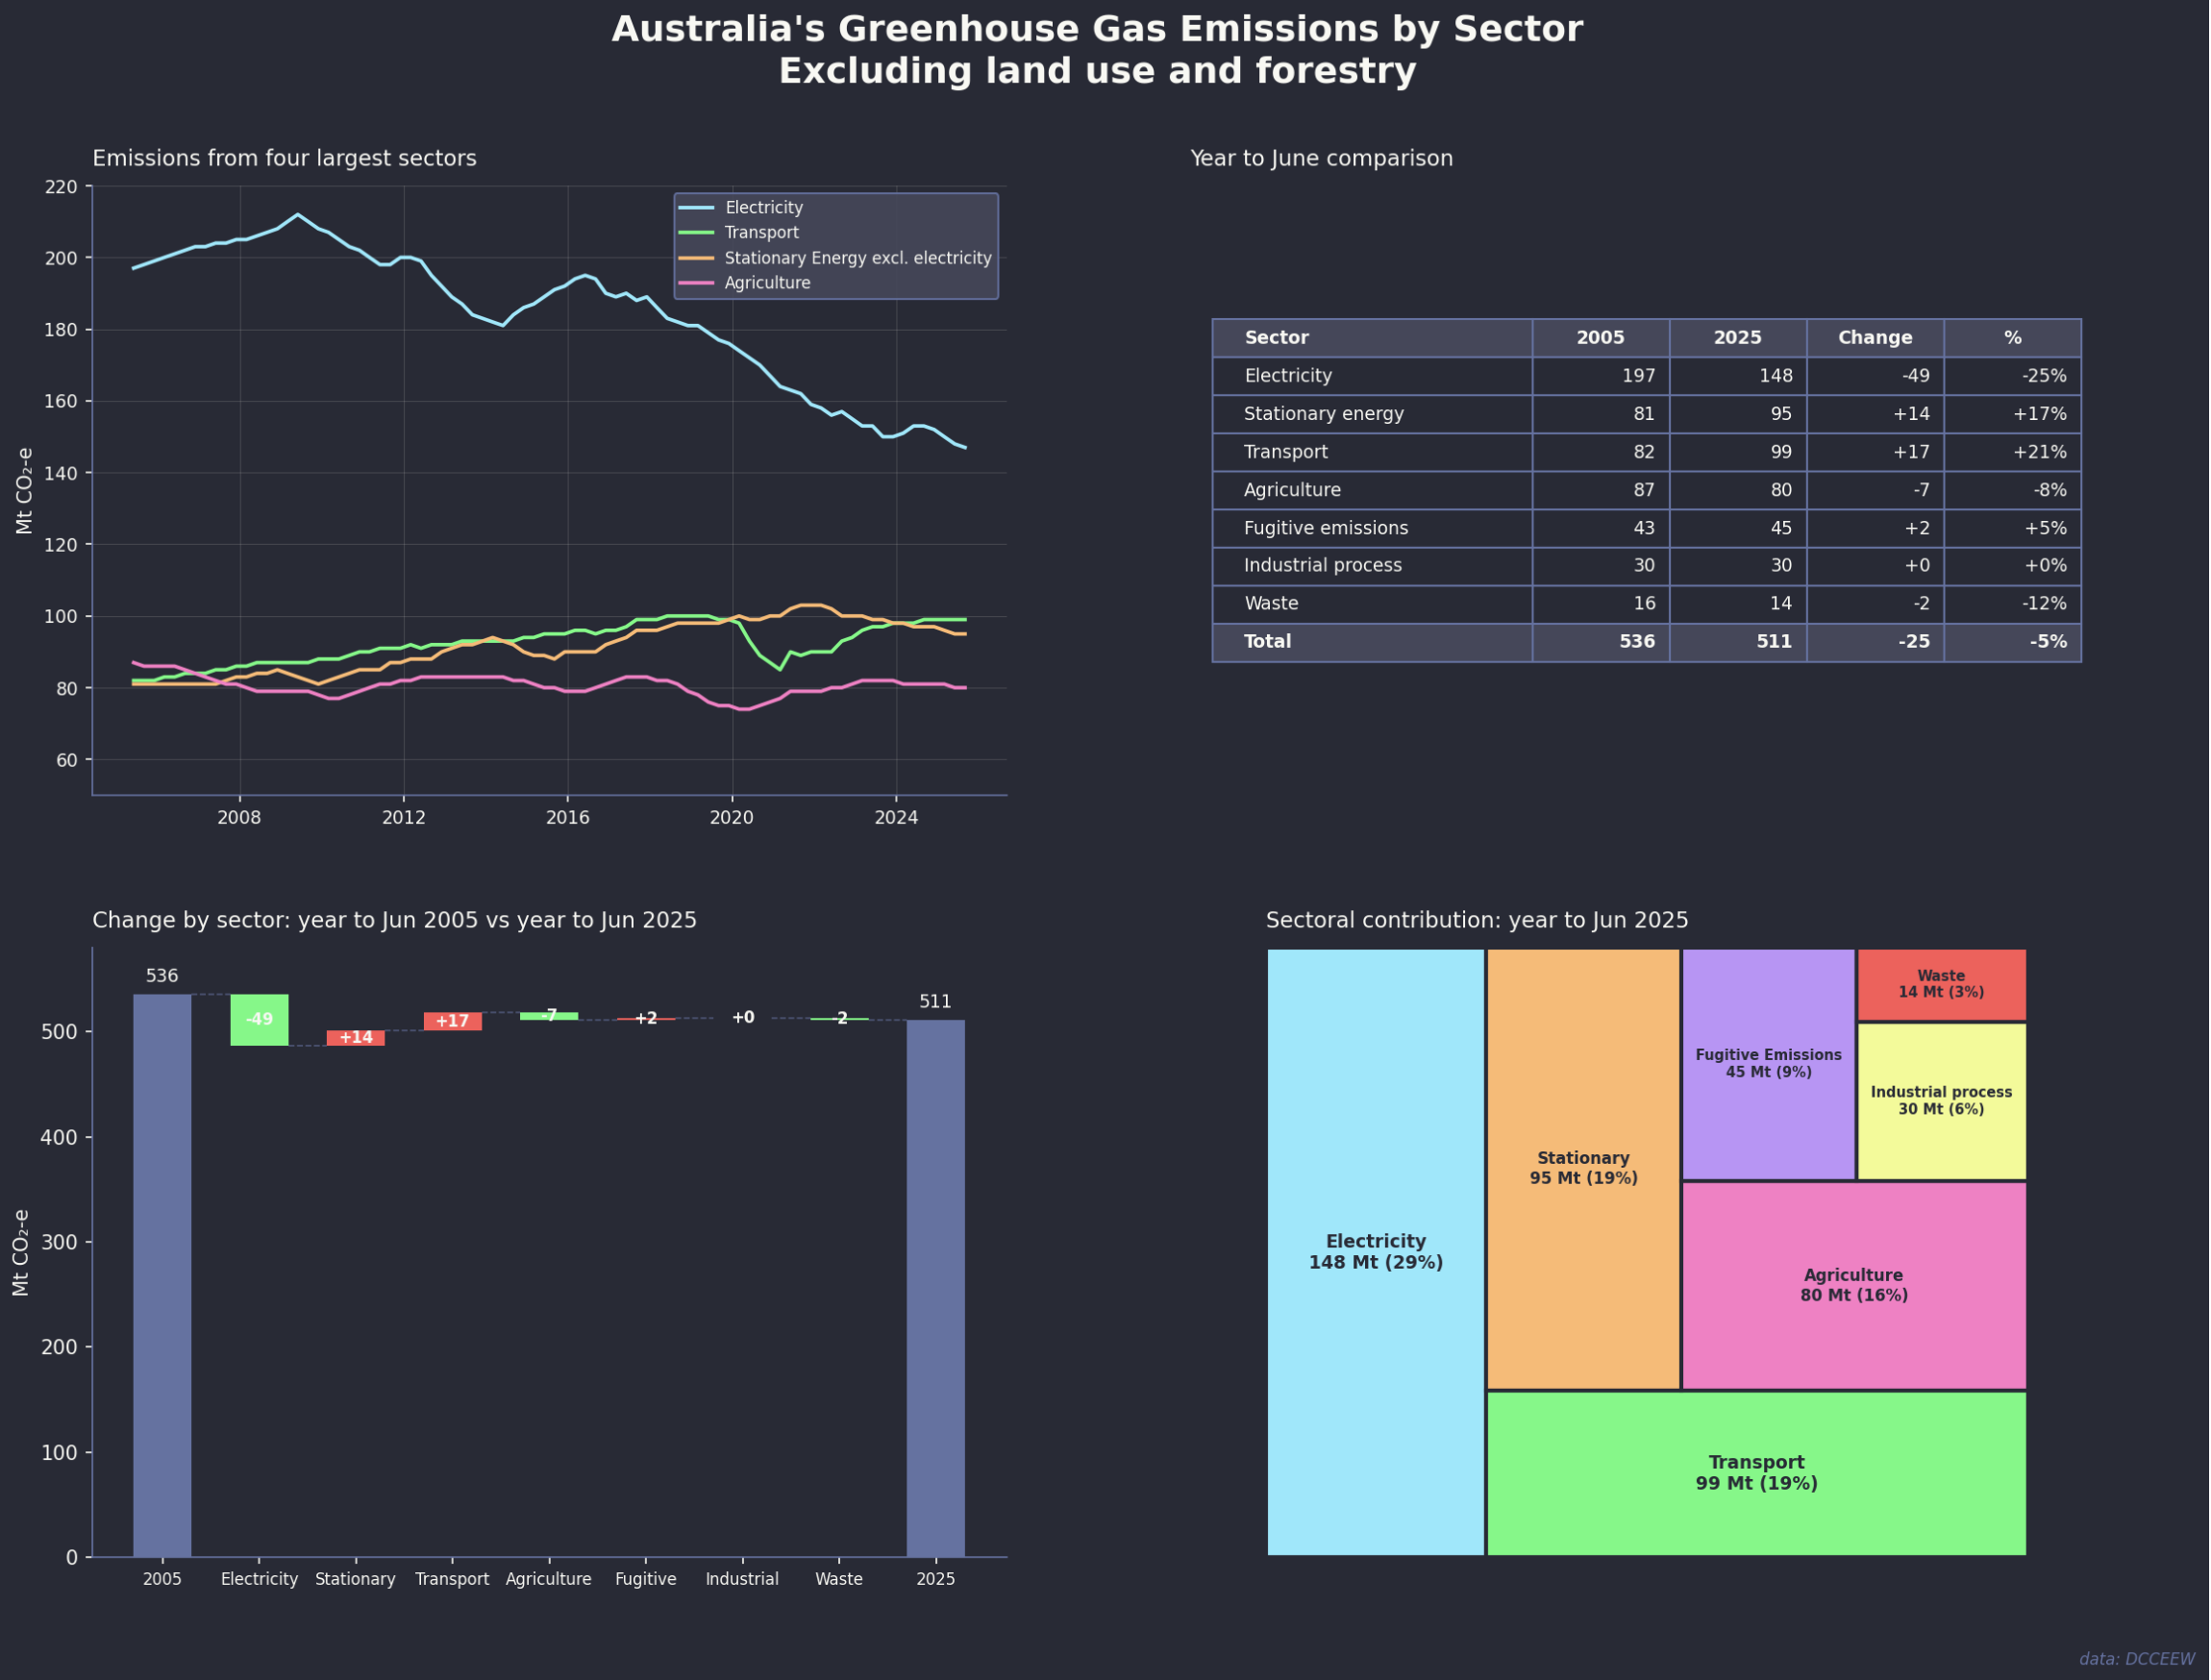
Essentially there is progress in electricity but almost nowhere else. As electricity emissions come down the relative importance of Transport, stationary energy and agriculture will increase.
In general the accepted policy for decarbonisation in Australia is the same as for every other country. Decarbonise electricity, then electrify everything. National EV strategy is the economic opportunity.
This note focuses on the EV-related reviews. There are two separate reviews. In essence the FBT is a subset of the EV strategy. I write from the point of view of a household with two EVs and regular long distance trips, not just to capital cities but to regional NSW and Victoria, over 80,000 EV km so far.
In my view over and beyond pollution a higher EV share should be on the priority list for Australia because: (1) Our climate, generally temperate, and terrain, mostly flat, are ideal for EVs. (2) We have no domestic car industry so there is no manufacturing industry to protect, (3) Australia has lots of oil imports which are both a strategic risk in the time of conflict and hurt our trade balance, (4) China has a surplus of EVs and wants to sell them to us, we should strike while the iron is hot.
Like everyone else who looks at decarbonisation seriously you would conclude that from an economics and efficiency point of view a carbon price or carbon tax is clearly the correct choice. But as ever politics have degraded us to the point where second best policies are the tools available.
Oil imports are a net $40bn say 6% of all imports
Let’s forget about climate and look at Australia’s trade balance. As everyone knows our main exports are iron ore, coal, LNG and tourism. We are the world’s top 3 thermal energy exporters, maybe 4 these days. It’s proving difficult to find industries that can replace thermal energy exports but another alternative is to reduce imports and oil is the main target. Importing EVs doesn’t do anything to the trade balance because we already import all the cars we sell. So we get to reduce imports by around $40 bn per year, let’s say $500 bn of net present value at zero cost. Our trade surplus would increase substantially.
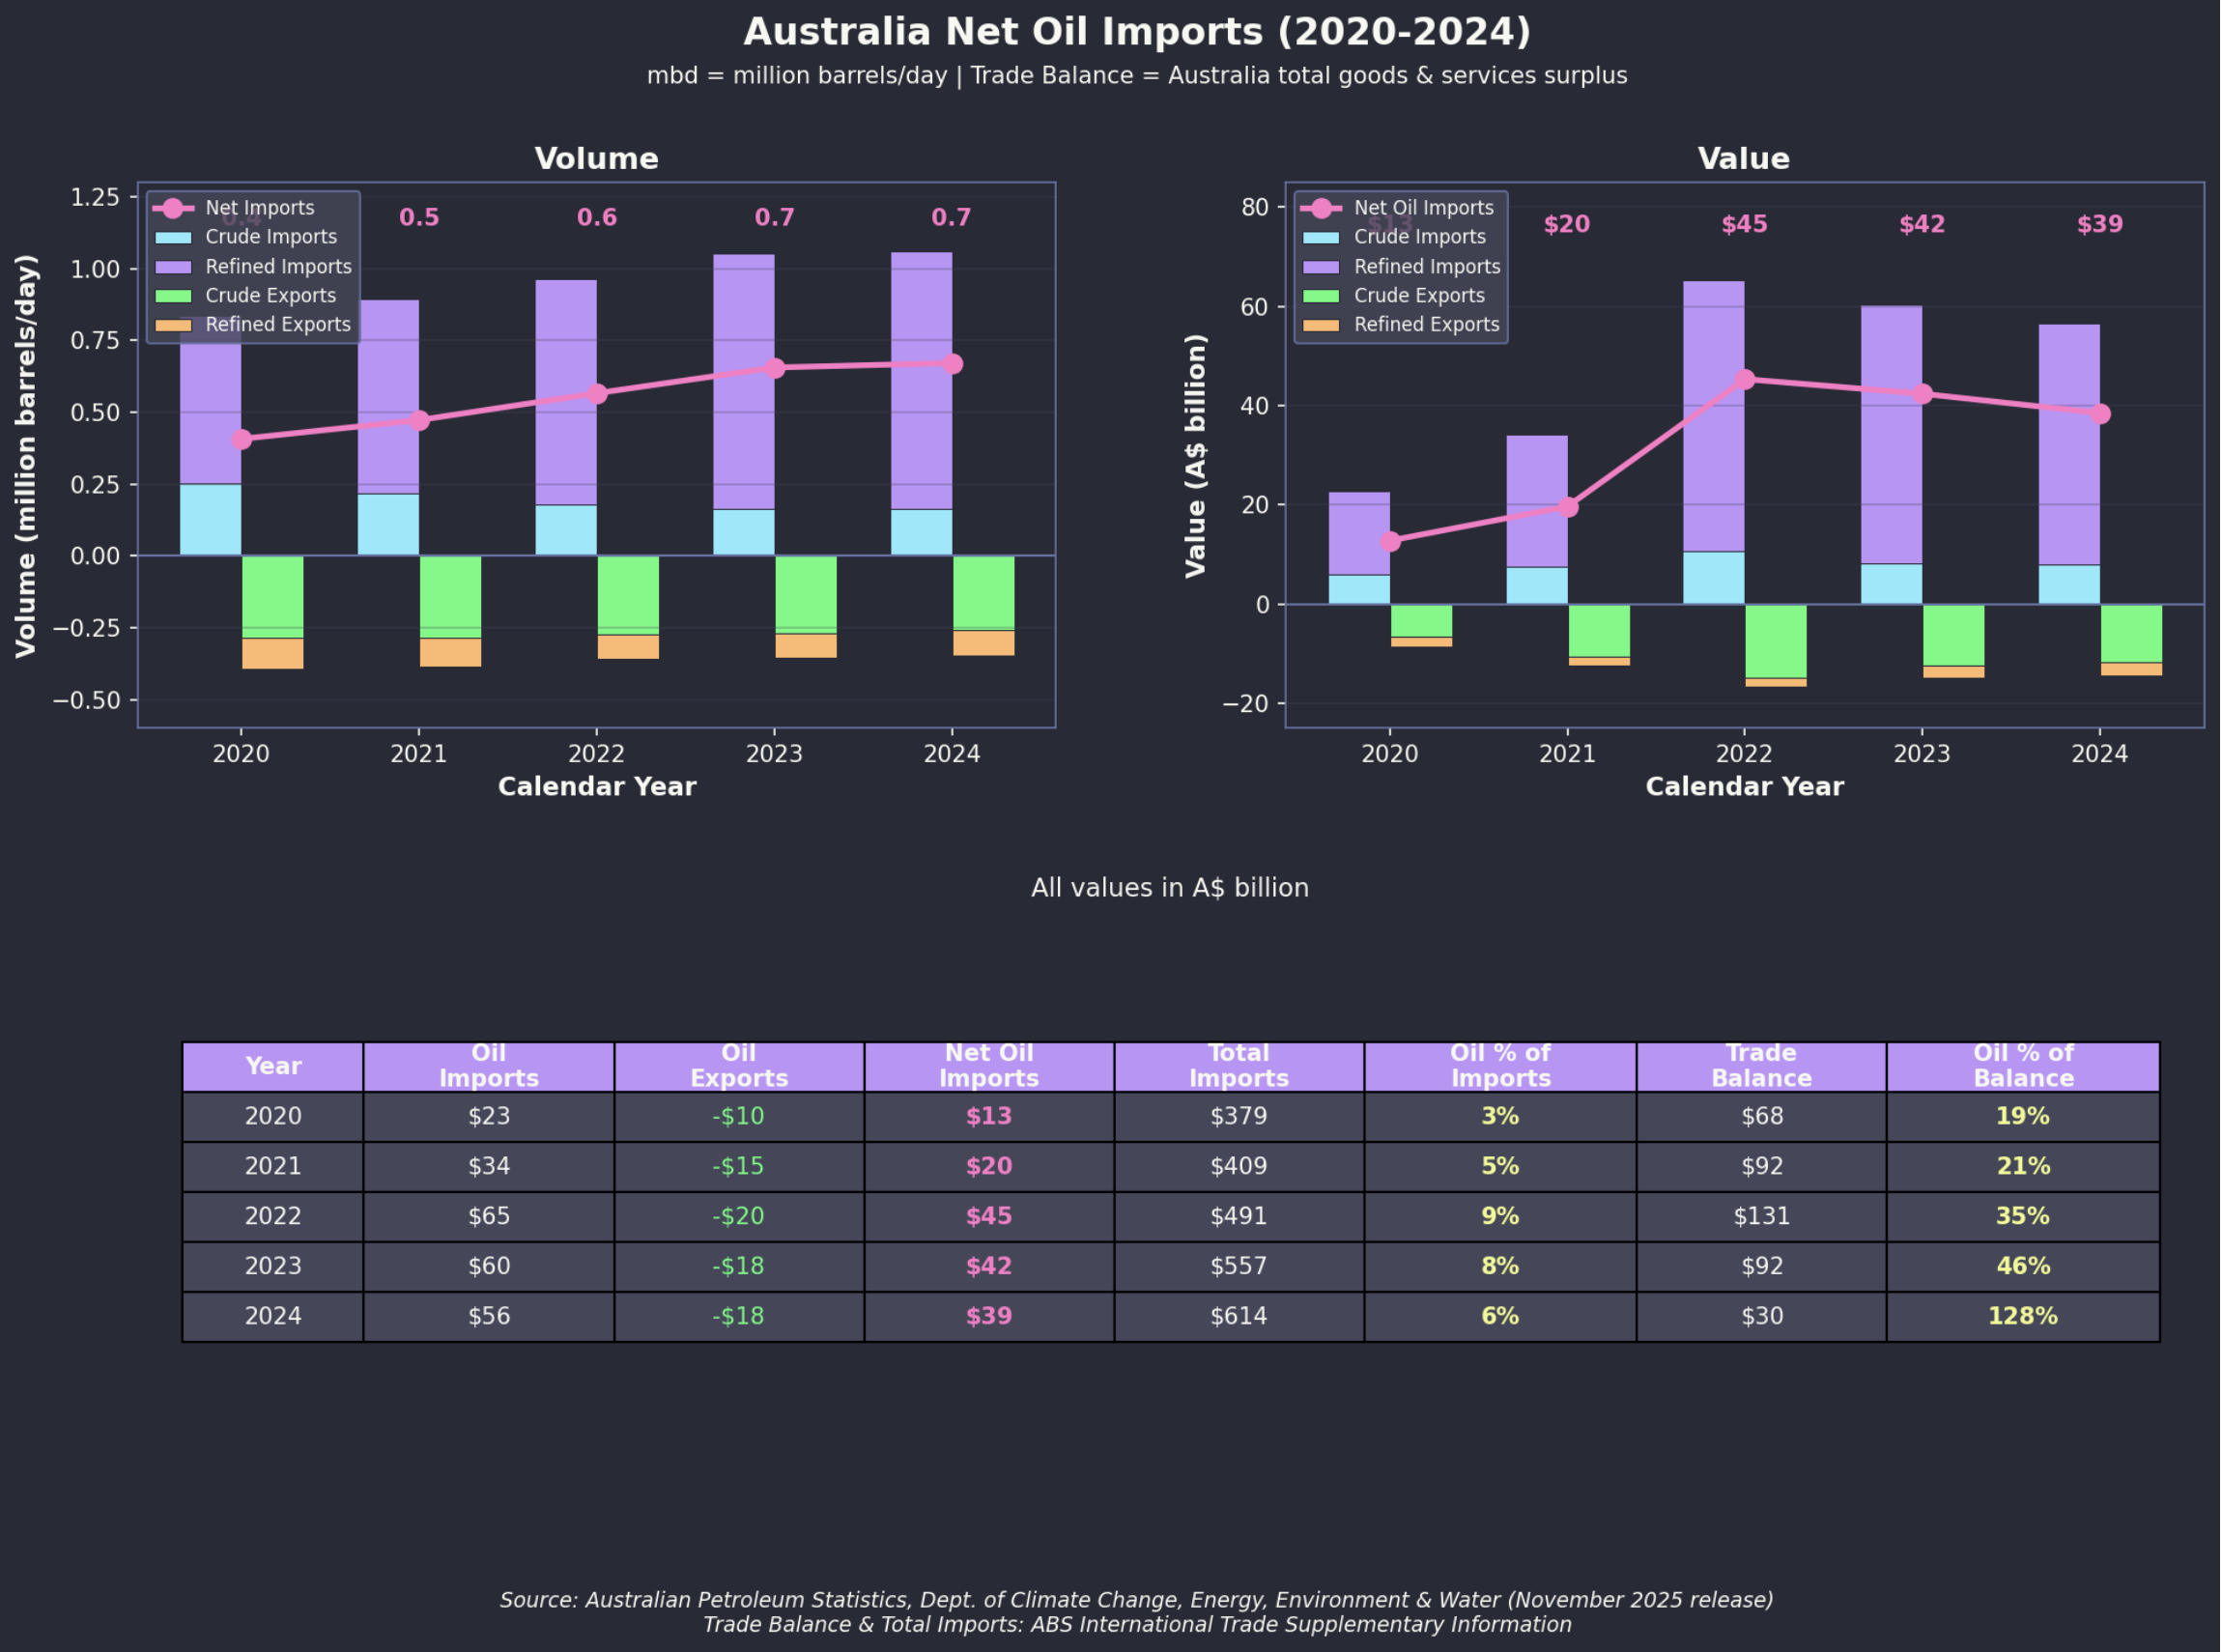
You almost can’t say this enough: reducing imports is just as beneficial to Australia as increasing exports.
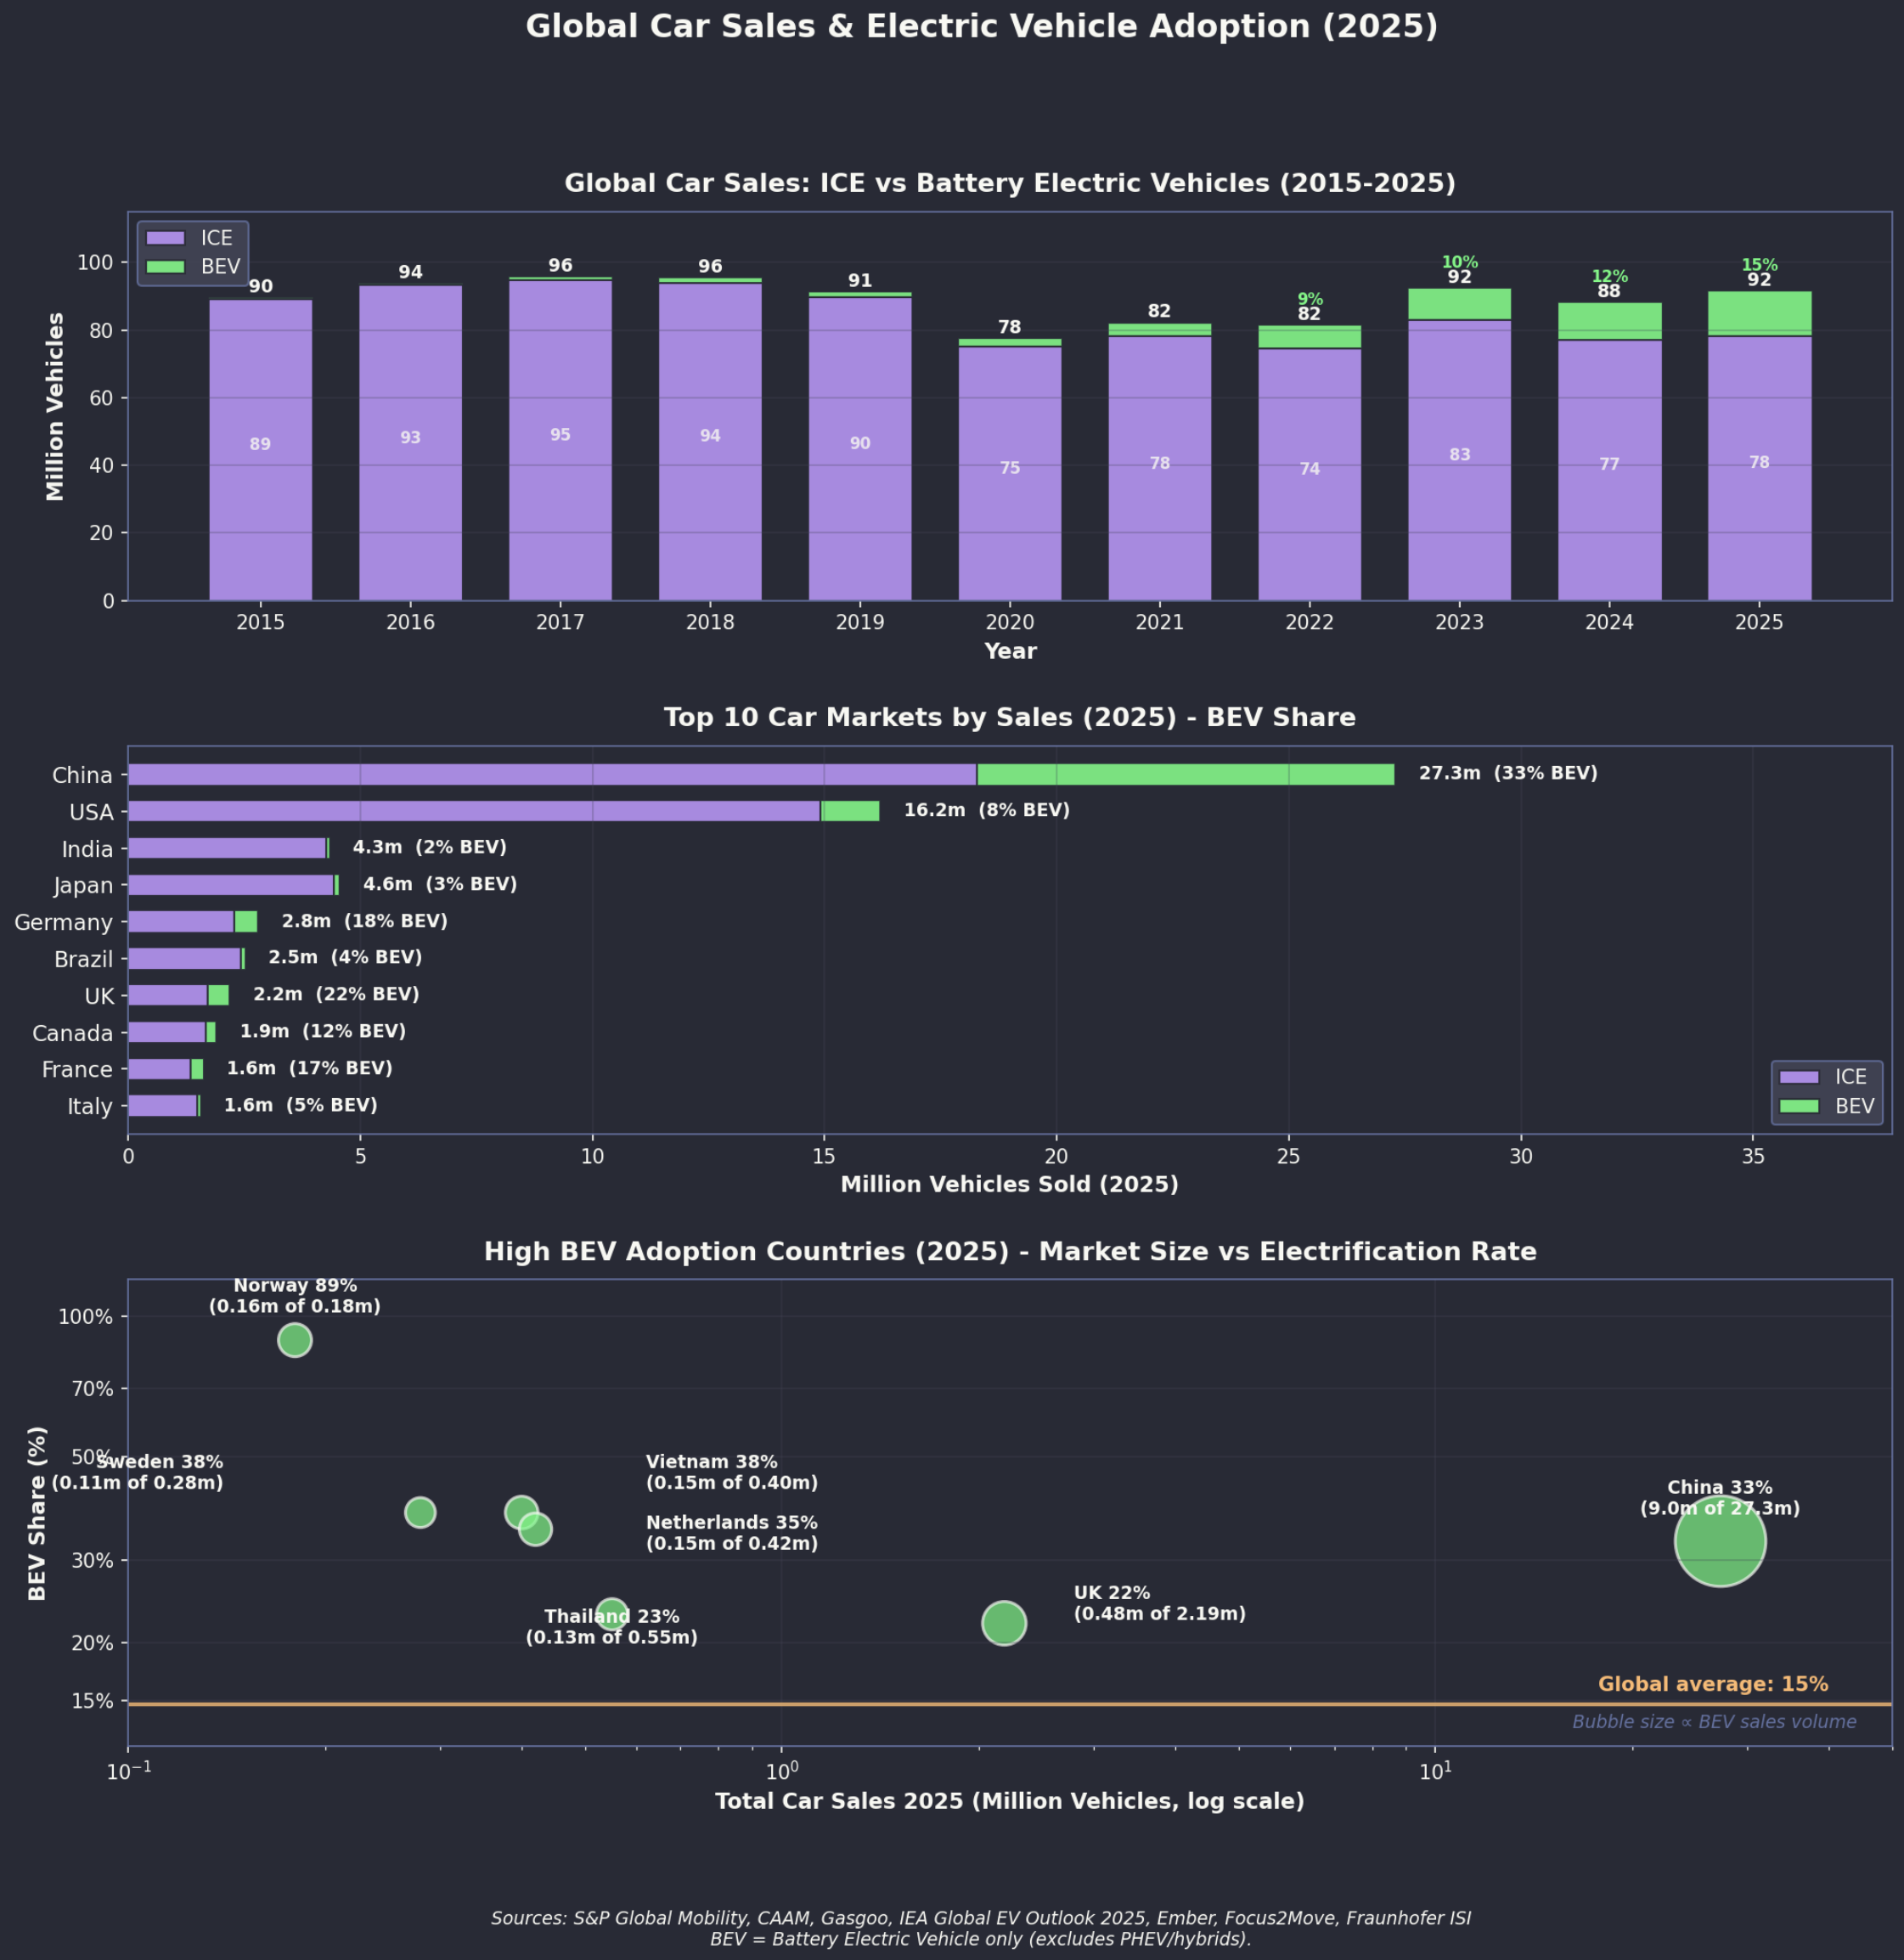
We are falling behind Asia! Never mind Europe
It’s easy to look at the global car market and think we are doing OK on EV adoption. Even so look at the hit the ICE car industry has already taken over the past decade. In 2018 sales were 94 million, now down to 78 million, that’s a really big drop. But looking at the global market completely misses the point. We aren’t competing with the USA or Japan. Japan is stuck in incumbent mode and the USA is run by a cognitively challenged leader.
We need to compare ourselves with the EV leaders, not the incumbents. France, Italy, Germany, Japan, USA all have to protect their domestic industries, just like we subsidise outdated smelters. We don’t need to subsidise Japanese and German carmakers in Australia.
Policy Configuration by Market
EV Market Share and Policy Configuration
| Market | EV Share | Supply Mandate | Tax Differential | Infrastructure | Driving Privileges |
|---|---|---|---|---|---|
| Norway | 92% | No (incentives-led) | 70%+ ICE premium | High | Bus lanes, tolls, parking |
| China | 51% | Yes (NEV credits) | Moderate | Very high | License plates, driving bans |
| Netherlands | 55% | EU CO₂ std | High (BPM tax) | Highest in EU | LEZ/ZEZ, parking priority |
| Denmark | 67% | EU CO₂ std | Very high (150%+ tax) | High | — |
| Thailand | 20% | Production requirement | Excise differential | Growing | None |
| Vietnam | 40% | No (VinFast-led) | Consumption tax diff | VinFast network | Planned |
| Australia | 12.6% | NVES (CO₂ only) | None | Lagging | None |
| USA | 9% | CA ZEV (some states) | Federal credit (uncertain) | Growing | HOV (some states) |
Source: IEA Global EV Outlook 2025; ICCT; author compilation
Consumer Incentive Values by Market
Estimated Total Consumer Benefit (AUD equivalent)
| Market | Direct Subsidy | Tax/Registration Saving | Other Benefits | Total Benefit |
|---|---|---|---|---|
| Norway | — | ~$50,000 (purchase tax exemption) | VAT ~$5,000; tolls, parking | ~$55,000+ |
| Denmark | — | ~$40,000 (150%+ registration tax avoided) | — | ~$40,000 |
| China | ~$6,000 | Varies by city | License plate ~$20,000 (Shanghai) | $6,000–26,000 |
| Vietnam | — | ~$4,000 (consumption tax diff) | Registration ~$6,000 | ~$10,000 |
| Thailand | ~$4,000 | ~$2,000 (excise differential) | Import duty reduction | ~$6,000 |
| Netherlands | — | High (BPM tax differential) | LEZ access, parking | ~$15,000+ |
| Australia | — | ~$9,000 (FBT, if eligible) | No GST or rego exemption | $0–9,000 |
Source: Author compilation from country sources. Values are indicative and vary by vehicle price and buyer circumstances.
Note on Australia: Unlike Norway (25% VAT exemption) and Denmark (registration tax exemption), Australia offers no exemption from GST (10%) or registration fees for EVs. A GST exemption would save ~$4,500 on a $50,000 EV and align with the tax-exemption approach that has driven high adoption elsewhere.
Key Research Conclusions
Infrastructure investment is 4-7x more cost-effective than purchase subsidies - redirecting subsidy spending to charging networks yields higher adoption rates (Michalek et al., 2025; World Bank, 2022)
ZEV mandates provide certainty that subsidies cannot - manufacturers respond to binding requirements; subsidy-only approaches require unsustainably high levels ($40,000/vehicle) to achieve equivalent outcomes (American Chemical Society, 2025)
Policy complementarity matters - subsidies and infrastructure reinforce each other; weakening one policy reduces effectiveness of others (Resources for the Future, 2025)
Tax differentials outperform direct subsidies - Norway’s tax exemptions (worth 70% of ICE price) and Denmark’s registration tax system create sustained price signals without ongoing fiscal cost (Norwegian EV Association, 2025; OECD, 2021)
Driving privileges provide additional adoption incentive - license plate priority (China), bus lane access (Norway), and LEZ exemptions (EU) reduce ownership friction, with measurable adoption effects (International Council on Clean Transportation, 2023; Jenn et al., 2018)
Australia’s policy mix is suboptimal - demand-side only (FBT exemption benefiting high earners), no binding supply mandate, no ICE tax differential, no driving privileges, lagging infrastructure. This configuration is least cost-effective among comparable markets.
What Works: Country Insights
The Key Lesson
The high-adoption markets share a common feature: they exempted EVs from pre-existing high taxes on vehicles. Norway’s 25% VAT and 45% registration tax, Denmark’s 150%+ registration tax, and China’s license plate restrictions all predated EV policy—some by decades. Norway taxed cars as “luxury goods” from the 1960s; Denmark’s registration tax dates to 1924. These countries didn’t introduce new punitive taxes on ICE vehicles—they leveraged existing ones by exempting EVs.
This distinction matters for Australia. Behavioural research shows punishments have 2-3x the impact of rewards, but political research shows the opposite for acceptability: subsidies are seen as “giving money” while taxes are seen as “taking money.” Australia’s carbon tax experience confirms this asymmetry. The politically feasible path is exemption from existing taxes, not new taxes on ICE.
Australia’s opportunity: A GST exemption for EVs would mirror the VAT exemptions that drove adoption in Norway and the EU. At 10%, it’s smaller than Norway’s 25% VAT, but on a $50,000 EV it would save ~$4,500—a meaningful incentive.
Country-by-Country Insights
Norway (92%) — Thirty years of policy consistency with no domestic car industry to protect. The key is exemption from pre-existing high taxes (25% VAT + 45% registration tax dating from the 1960s). Removing tax exemptions would drop EV share from 66% to 25%. Bus lane access and toll exemptions provide daily reinforcement.
Denmark/Netherlands (55-67%) — Tax differential through exemption: EVs avoid registration taxes that have applied to vehicles since 1924 (Denmark) and high BPM taxes (Netherlands). No direct subsidies required—exemption from pre-existing taxes does the work. Netherlands has Europe’s highest charging density.
China (51%) — Scale plus mandate. The Dual Credit System forces manufacturers to produce EVs or buy credits from competitors—they cannot simply pay a fine. License plate restrictions in major cities (Shanghai plate costs ~$20,000 at auction, NEV plates are free) provide powerful city-level incentives. Per-vehicle subsidies have declined from $13,860 (2018) to under $4,600 (2023) as the market matured.
Vietnam (~40%) — The VinFast effect: a single dominant domestic manufacturer can drive adoption faster than policy alone. Registration fee exemption saves buyers ~$6,000 per vehicle. Aggressive targets (all new buses electric from 2025, all new taxis from 2030) signal government commitment.
Thailand (1% → 20%) — Manufacturing-linked incentives work. Companies must offset imported vehicles with local production at 1:2 ratio by 2026 and 1:3 by 2027. This attracted Chinese manufacturers to build factories in Thailand rather than simply export. The 30@30 target (30% BEV production by 2030) signals long-term commitment.
China’s Dual Credit System: A Model for Mandates
China’s policy is worth examining in detail because it demonstrates how supply-side mandates can complement demand-side incentives.
How It Works
The “Dual Credit” system combines two requirements (International Council on Clean Transportation, 2022):
Component 1: Corporate Average Fuel Consumption (CAFC) Credits
| Year | Target (L/100km) |
|---|---|
| 2020 | 5.0 |
| 2025 | 4.0 |
Source: ICCT
NEVs count as zero fuel consumption, helping manufacturers meet CAFC targets.
Component 2: NEV Credit Mandate
| Year | NEV Credit Requirement |
|---|---|
| 2023 | 18% |
| 2024 | 28% |
| 2025 | 38% |
| 2026 | 48% |
| 2027 | 58% |
Source: ICCT; Ministry of Industry and Information Technology
Why It Works
- Manufacturers cannot simply pay a fine—they must produce NEVs or buy credits from competitors
- Links fuel economy compliance to NEV production (surplus NEV credits can offset CAFC deficits)
- Creates technology competition (credits tied to performance metrics, not just sales)
- Ratchets up annually, forcing continuous improvement
- Credits can be traded—creating a market where EV-focused companies (like BYD) can sell credits to laggards
Government Investment Scale
China Government Support for NEV Industry
| Period | Estimated Support |
|---|---|
| 2009-2022 (subsidies + tax breaks) | $40-60 billion AUD |
| 2009-2023 (all support types)1 | $230 billion USD |
| 2024-2027 (tax incentive package) | $105 billion AUD |
Source: CSIS; Ministry of Industry and Information Technology
References
If You Build It, They Will Come: Lessons from the First Decade of Electric Vehicles — Rode et al., World Bank, 2022. Analysis finding charging infrastructure explains 69% of cross-country EV share variance vs 17% for subsidies; infrastructure investment is 4-7x more cost-effective than subsidies.
Should Government Incentivize EV Adoption Through Consumer Tax Credits or Infrastructure? — Carnegie Mellon University Tepper School of Business, 2025. Research finding redirecting funds from tax credits to charging infrastructure could increase EV adoption by 26% and reduce emissions by 51%.
Subsidies, Standards, or Both? Trade-Offs among Policies for 100% Zero-Emissions Vehicle Sales — Axsen & Bhardwaj, Environmental Science & Technology, 2025. Finding ZEV mandates cost $50-150/tonne CO2e abated vs $450-820/tonne for subsidy-only approaches; subsidies require $40,000/vehicle to achieve 100% ZEV sales.
A Tale of Two Investments: Charging Stations and Purchase Subsidies for EV Adoption — Resources for the Future, 2025. Research demonstrating policy complementarity: charging station density positively influences how important consumers consider purchase subsidies.
Norwegian EV Policy — Norwegian EV Association (Norsk elbilforening), 2025. Overview of Norway’s EV incentive package including VAT exemption, registration tax exemption, reduced tolls, and bus lane access.
Norway’s Evolving Incentives for Zero-Emission Vehicles — OECD, 2021. Analysis of Norway’s fiscal incentives including exemption from registration tax, VAT, and motor fuel taxes; tax expenditure reached NOK 11.3 billion (USD 1.3 billion) in 2021.
Accelerating New Energy Vehicle Uptake in Chinese Cities — International Council on Clean Transportation, 2023. Assessment of city-level policies including preferential license plate access, traffic restriction exemptions, and use-phase incentives.
Effectiveness of electric vehicle incentives in the United States — Jenn, Springel & Gopal, Energy Policy, 2018. Research finding HOV lane access increases EV adoption by 4.7% per unit of lane density; every $1,000 rebate increases EV sales by 2.6%.
How Will the Dual-Credit Policy Help China Boost New Energy Vehicle Growth? — International Council on Clean Transportation, 2022. Explanation of China’s dual credit system where NEV credits can offset fuel consumption deficits but not vice versa, forcing manufacturers to produce EVs.
References
Footnotes
CSIS estimate includes direct subsidies, tax exemptions, government procurement, R&D funding, and infrastructure investment.↩︎