Buy stocks exposed to disaster recovery in QLD

Queensland is the most disaster-prone state in Australia. It experiences about 60% of the nation’s natural disasters, its $95 billion reef asset faces accelerating bleaching, and a significant share of its economy is in industries directly vulnerable to extreme weather. The economic evidence shows these costs are rising, both in absolute terms and as a share of economic output. Queensland is more or less actively encouraging more disasters in Queensland via coal and gas investment and this along with what the rest of the world is doing means that “prepare and repair” will continue to offer investment opportunities.
Mining in total represents about 13% of GSP and coal mining is probably half that. Even at the new royalty rates it’s 6% of government revenue. But sectors exposed to increasing disaster costs represent about 20% of GSP. There are about 50,000 jobs in coal mining compared to about 300,000 jobs in agriculture, tourism and accommodation alone that are negatively exposed to disasters in QLD.
Overall employment might increase due to construction and rebuilding — call it the permanent tradies effect. This is the “broken window fallacy”. Disasters are good for some sectors of the economy but destroy wealth and the overall impact is negative.
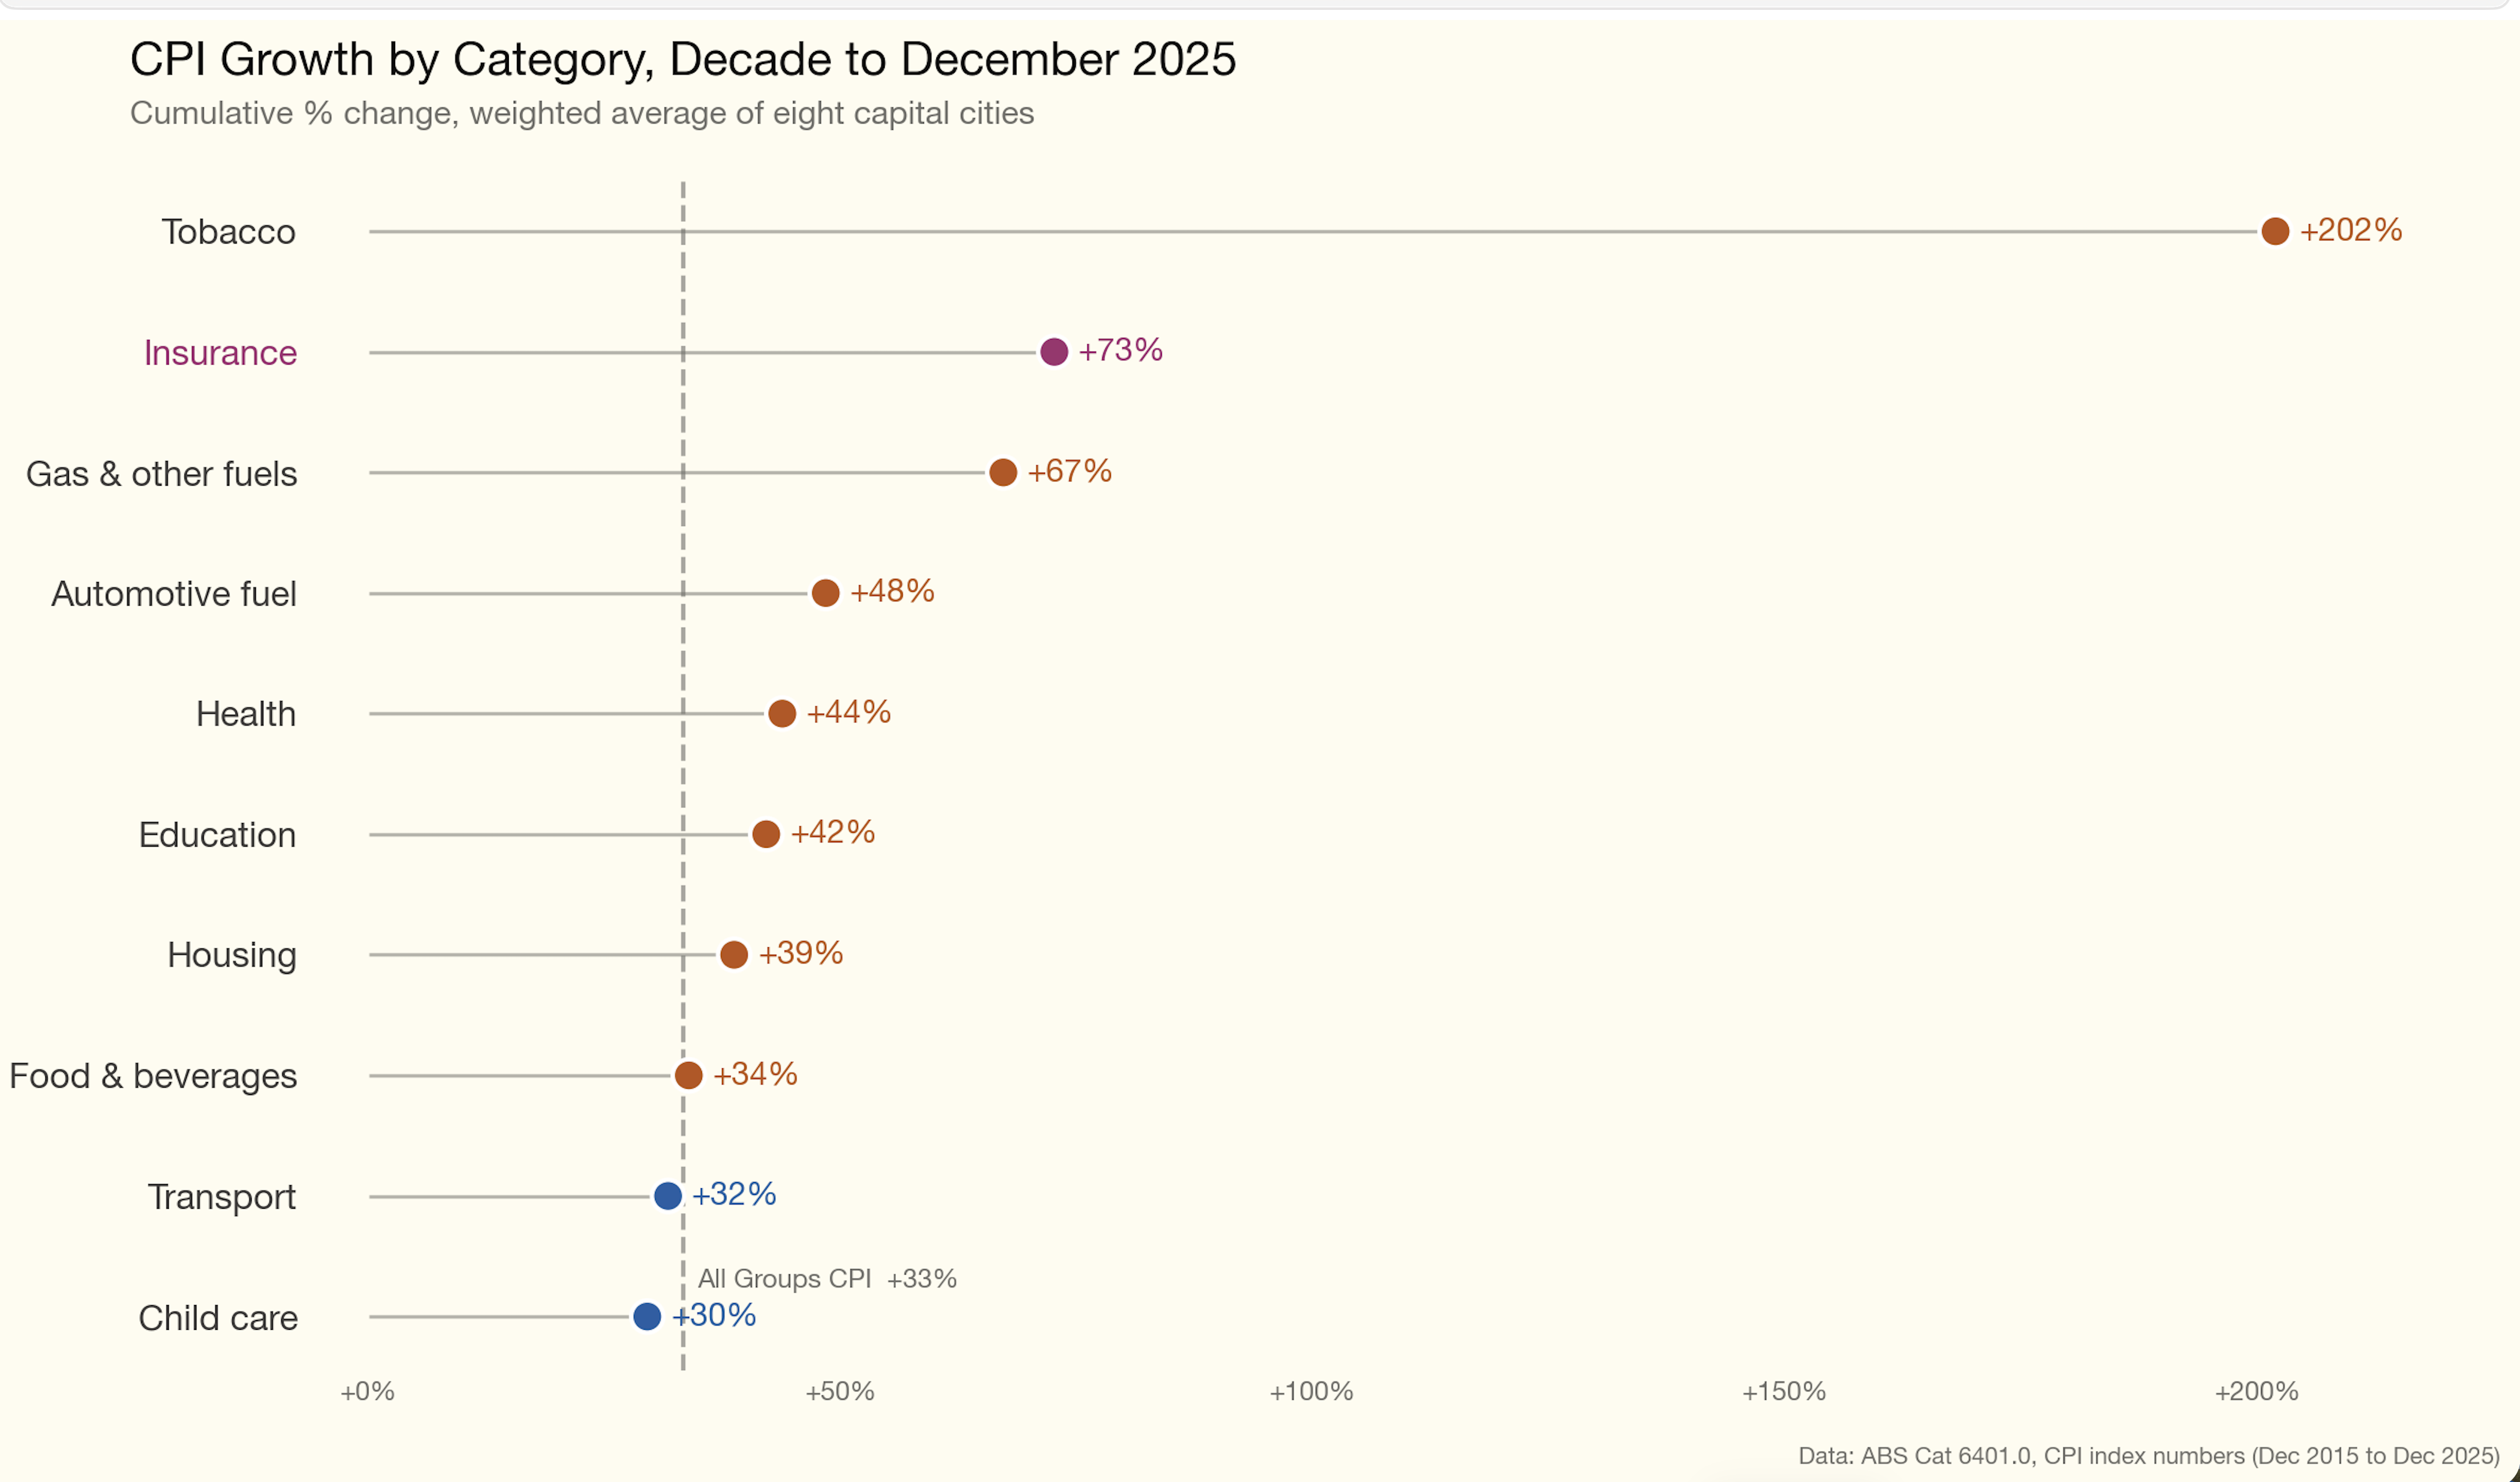
To emphasise the point look at the CPI increases over the past 10 years. Electricity doesn’t appear, but petrol and gas do. More to the point Insurance is the biggest increase outside of tobacco. Disasters are becoming more expensive and protecting against them is also becoming more expensive.
Where to invest?
Based on the Bloomberg Prepare and Repair Index — an index of eight US sectors that have outperformed the S&P 500 by 6.5% a year over the decade to October 2025 — the best likely investment areas in Queensland are:
- Industrial services. In QLD, likely general contractors, tradies, infrastructure rebuilders;
- Stormwater construction, e.g. whoever owns concrete and plastic pipes and their installers, e.g. James Hardie;
- Insurance brokers, premium growth from rising risk;
- Equipment rental, e.g. portable accommodation, mobile homes;
- Restoration — road contractors, fencing rebuilders;
- Infrastructure engineering, flood defences, toughening up electricity transmission etc.
- I’d also add marine ecology, reef repair, although exactly how you repair a reef I haven’t worked out. But there has to be a way to make money out of it. Maybe an aqua museum/resort?
No reliable disaster cost data
The ABS has acknowledged the lack of a good national disaster cost database. There is no regularly updated, comprehensive measure of Australia’s total natural disaster costs. The Insurance Council of Australia reports that average annual insured catastrophe losses have more than doubled, from $2.1 billion over the past 30 years to $4.5 billion over the past five. Total economic costs — including uninsured losses, government infrastructure, and social impacts — are estimated at several multiples of insured losses, but the most widely cited national estimate (Deloitte Access Economics) has not been fully updated since 2021.
It is surprising how poorly the economic costs of disasters are reported. There is endless climate change analysis but little about its day-to-day economic impacts. This note draws on the Deloitte/IAG estimates and the ICA Catastrophe Database (which only captures 20–50% of total economic cost). Since disaster costs are likely to increase, and QLD provides the greatest exposure, it would seem sensible for governments to maintain a trusted and reliable source of truth on the costs.
Queensland’s economic growth: about 3%, moderating
Queensland’s long-run average real GSP growth is approximately 3.0–3.5 per cent per annum, moderating to 2.5–2.75 per cent through 2028–29 (QLD Budget 2025–26). In 2010-11, floods and Cyclone Yasi reduced growth to 0.2 per cent — approximately 2–3 percentage points below trend, implying $5–8 billion in foregone output on top of direct damage costs.
13% of Queensland’s economy is directly exposed to climate disasters
GSP equals total GVA plus net taxes on products; in Queensland the two measures are close.
| Sector | GVA ($B) | % of GSP | Key Climate Risks |
|---|---|---|---|
| Agriculture, Forestry and Fishing | ~16.7 | ~3.5 | Drought, flood, heat stress, cyclones |
| Tourism (direct GVA) | 15.7 | 3.1 | Coral bleaching, cyclones, heatwaves |
| Transport and Warehousing | ~22.0 | ~4.6 | Road/rail flood damage, cyclone closures |
| Accommodation and Food Services | ~11.0 | ~2.3 | Cyclones, floods, bushfires, also a beneficiary |
| Total (high exposure) | ~66 | ~13 |
Source: QLD Treasury, ABS State Accounts, Tourism Research Australia. Including mining (12.9% of GVA, moderate exposure) brings the total to ~26% of GVA.
These are not marginal sectors. Queensland agriculture produces almost one-quarter of Australia’s total agricultural output (cattle $6B, sugarcane $2B). Tourism contributes $32 billion to GSP when indirect effects are included (6.3% of total GSP). The Great Barrier Reef alone supports 77,000 FTE jobs.
Historical Disaster Costs: $50–70 Billion
The total economic cost of major flood, cyclone, and drought events in Queensland since 2010 is conservatively estimated at $50–70 billion:
| Category | Estimated Cost | Basis |
|---|---|---|
| Road and public infrastructure (QRA managed) | $29 billion | Cumulative 2011–2025 |
| Emergency water infrastructure (Millennium Drought) | $6.9 billion | SEQ Water Grid, desalination |
| Livestock losses (2019 + 2025 floods) | $6+ billion | Deloitte $5.68B for 2019 alone |
| Uninsured property and business losses | $5–10 billion | 30–50% insured-to-total cost ratio |
| Agricultural production losses | $3–4 billion | QLD share of $1.1B/year national loss |
| Government drought assistance | $670 million | Since 2013 |
Source: QRA, Deloitte Access Economics, ABARES, ICA, QLD Government. Categories overlap.
The trend: accelerating
| Metric | Value |
|---|---|
| QRA active program, first 5 years (2011–16) | ~$15 billion |
| QRA active program, latest 5 years (2020–25) | $14.2 billion across 58 events |
| Events activated 2024–25 | 17 (highest on record) |
| LGAs activated 2024–25 | 73 of 77 (most widespread ever) |
National disaster costs have risen from an estimated $18 billion in 2017 to $38 billion in 2024. Queensland experiences roughly 60 per cent of the nation’s disaster events and bears a disproportionate share of the cost (Climate Council, 2024; Deloitte Access Economics, 2024; Insurance Australia Group, 2024).
Major events since 2010
| Event | Year | Total Economic Cost ($B) | Insured Losses ($B) |
|---|---|---|---|
| QLD Floods + TC Yasi | 2010–11 | ~14.1 | 3.5 |
| TC Debbie | 2017 | ~3.5 | 1.74 |
| NQ Monsoon Trough | 2019 | ~5.68 | 1.24 |
| SE QLD Floods | 2022 | ~7.7 | 5.56 |
| TC Jasper | 2023 | ~1.0 | 0.74 |
| Ex-TC Alfred | 2025 | ~1.8–2.7 | 1.5 |
Source: ICA, Deloitte Access Economics, QRA, World Bank.
The gap between insured and total economic costs falls on individual property owners, businesses, and taxpayers through government recovery programs.
Disaster costs are about 1% of GSP and probably rising
Historical ratio
| Period / Event | Disaster Cost ($B) | QLD GSP ($B) | Cost as % of GSP |
|---|---|---|---|
| 2010–11 (floods + Yasi) | ~16 | ~275 | ~5.8% |
| Annual average (total economic, 2011–25) | ~4–5 | ~400 (avg) | ~1.0–1.3% |
| 2022 (SE QLD floods) | ~5+ | ~425 | ~1.2% |
| Annual average (QRA program only) | ~2.1 | ~400 (avg) | ~0.5% |
Source: Author calculations from Deloitte, QRA, ICA, World Bank, ABS.
The ongoing burden of approximately 1.0–1.3 per cent of GSP is substantial. In the extreme year of 2010–11, disaster costs consumed the equivalent of almost 6 per cent of GSP.
The forward projection
Rather than rely on the Deloitte model, which has not been fully updated since 2021, we can build a projection from the more current ICA data. National insured disaster losses have more than doubled in recent years, from a 30-year average of $2.1 billion to $4.5 billion over the past five years (ICA). Applying Queensland’s share (~40–50% of national insured losses) and standard multipliers for uninsured and indirect costs (2–3x), current total economic disaster costs for Queensland are approximately $5 billion per year — roughly 1 per cent of GSP. If insured losses continue growing at the observed rate of approximately 6 % per annum, Queensland’s total disaster costs would reach $20–25 billion per year by mid-century, or about 1.3 per cent of projected GSP.
| Year | Projected Disaster Cost ($B/yr) | Projected Nominal GSP ($B) | Cost as % of GSP |
|---|---|---|---|
| 2025 (current) | ~5 | ~531 | ~0.9% |
| 2035 | ~9-10 | ~824 | ~1.1% |
| 2050 | ~21-25 | ~1500 | ~1.3% |
Source: Derived from Deloitte and ICA data.
The ratio increases by about 40 per cent by mid-century. This means disaster costs will grow faster than the economy — an increasing drag on prosperity. And these are average annual figures; individual extreme years would be substantially worse.
The Climate Trajectory Driving These Costs
Including scope 3 (exported coal and gas burned overseas), QLD’s carbon emissions are about 660 Mt CO2 or about 1.75% of global total fossil fuel emissions — 117 tonnes per capita, surely one of the world’s highest numbers. QLD is contributing measurably to the climate change driving its own disasters, and coal and gas production continues to receive policy support.
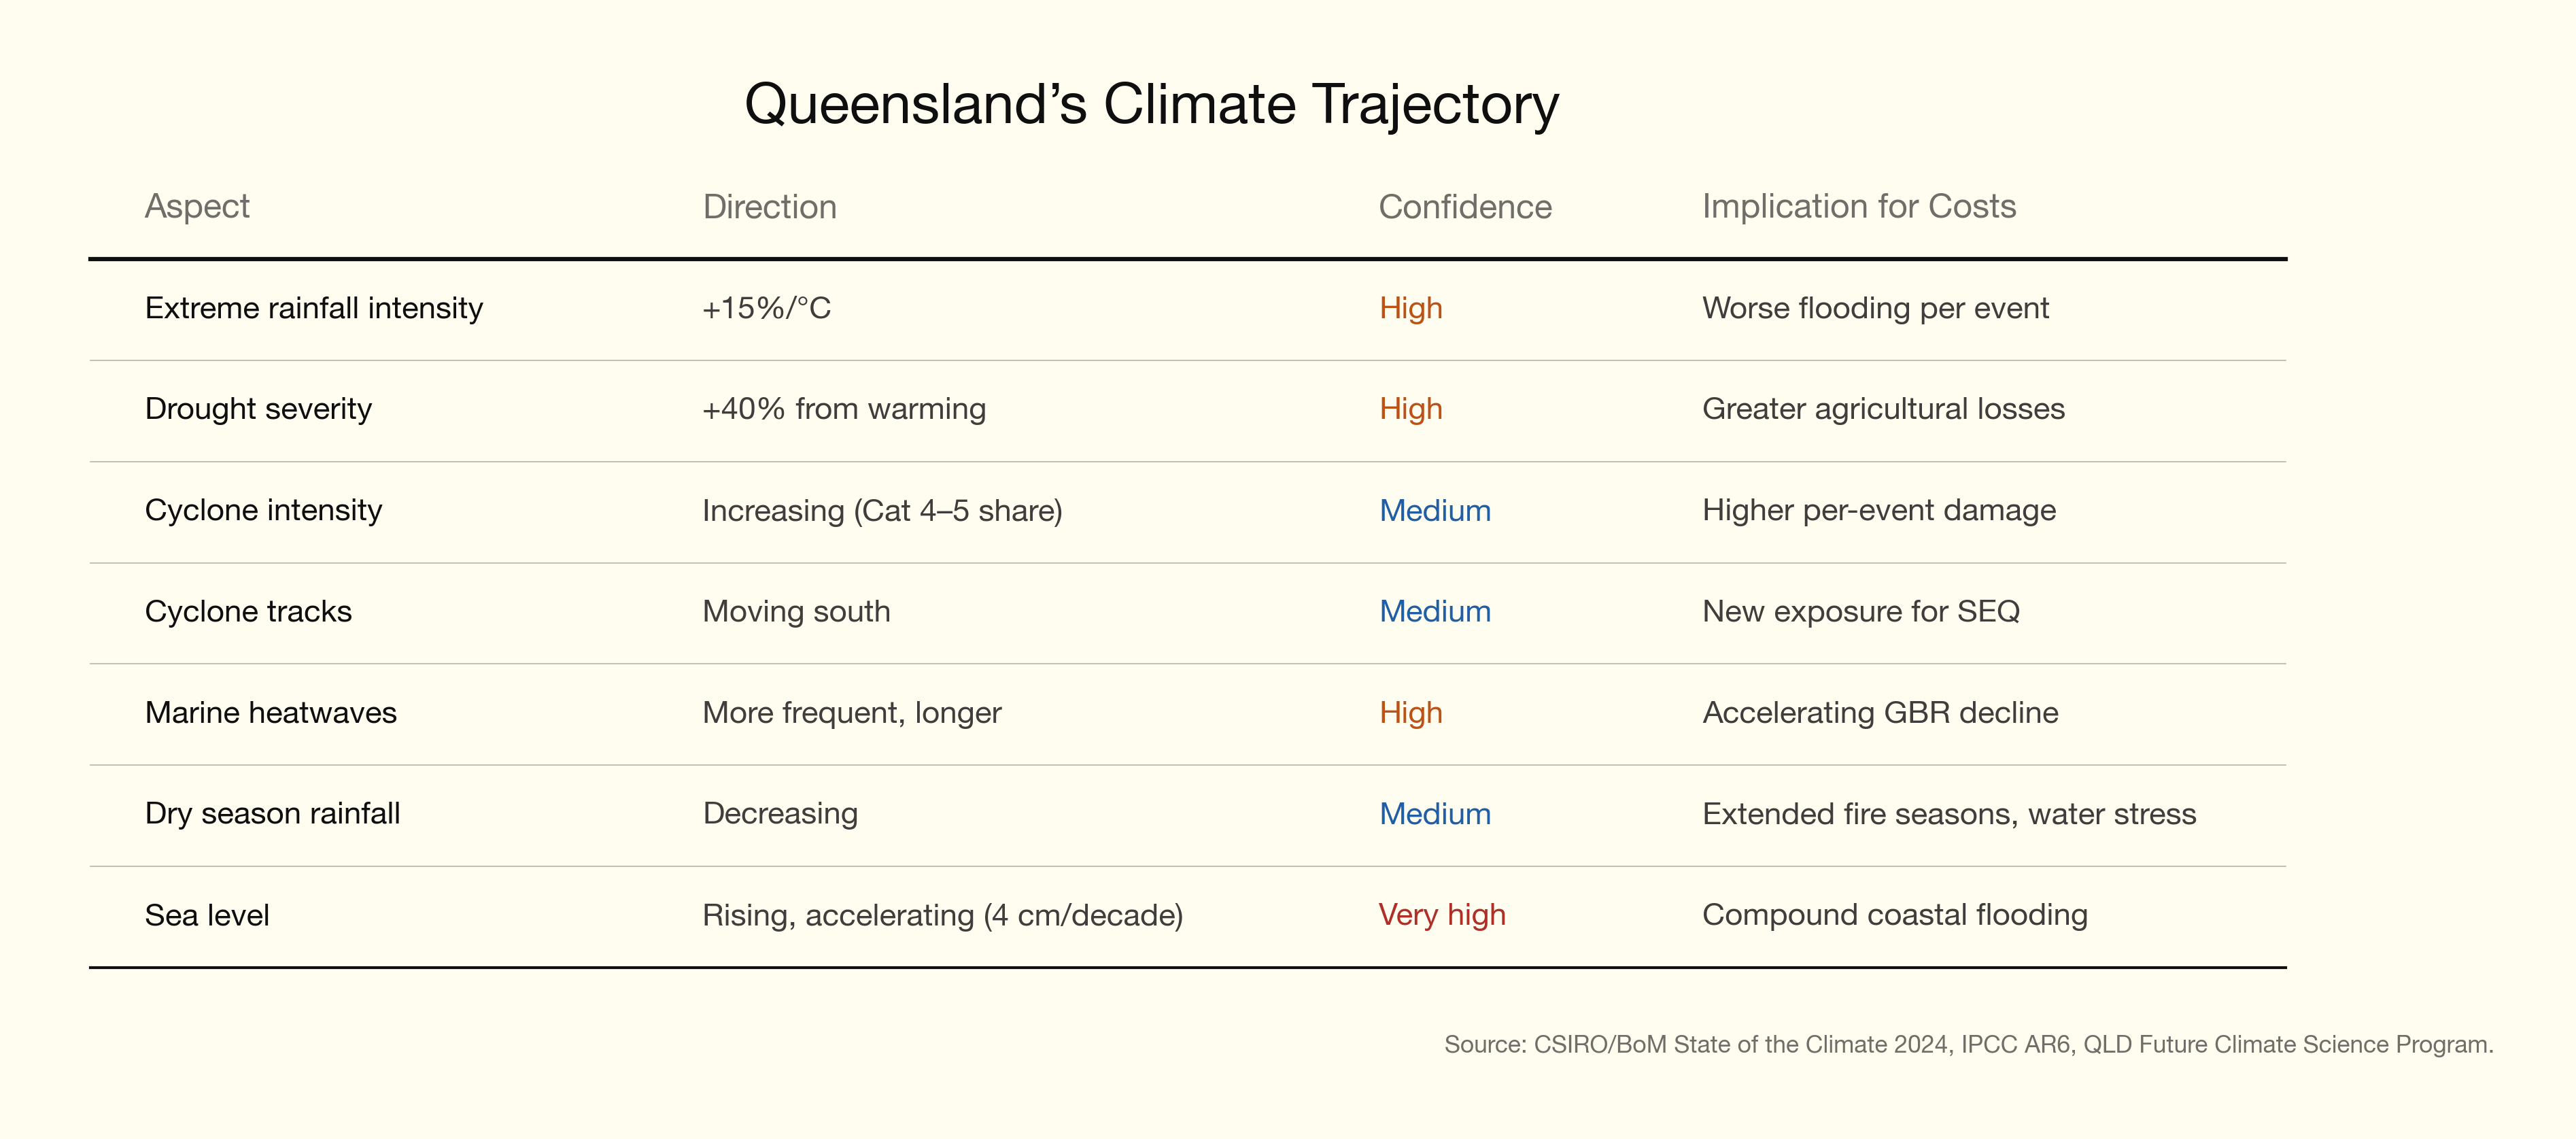
Climate projections explain why costs are accelerating and are expected to continue doing so.
What is changing
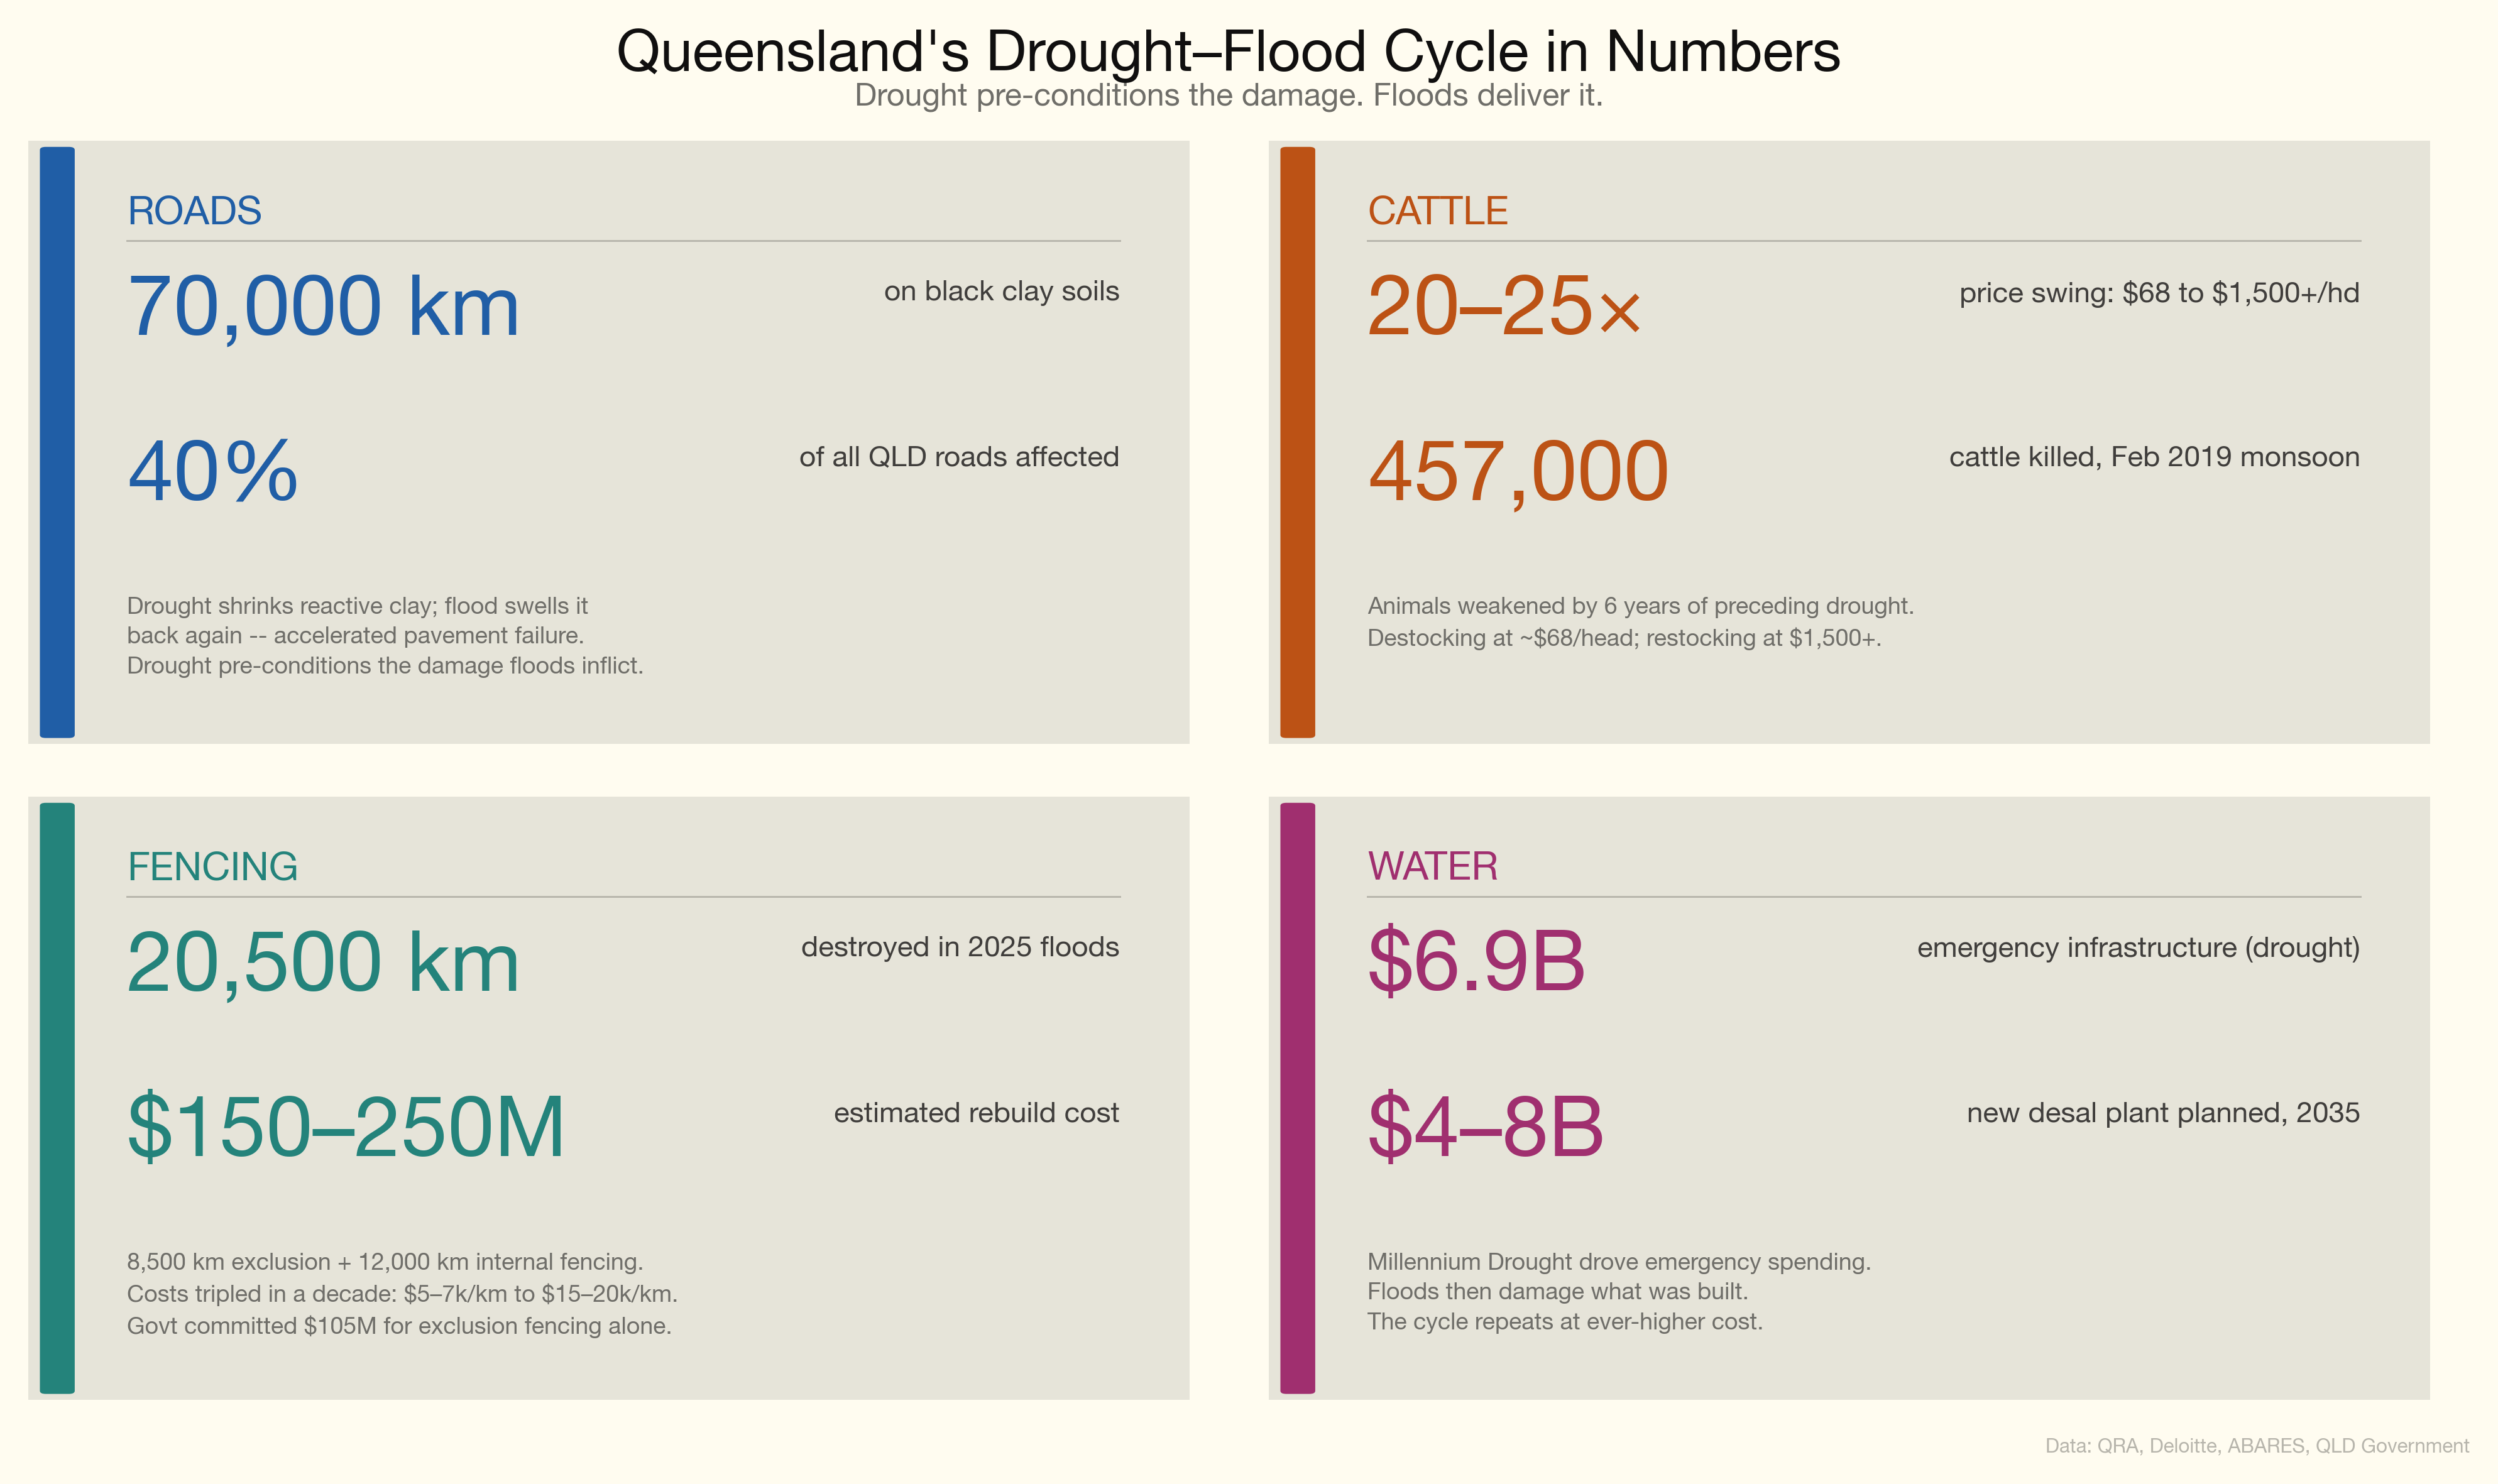
The drought-flood cycle: quantified
This is Queensland’s defining climate risk. The cycle operates across multiple sectors simultaneously:
Roads: 40 per cent of Queensland’s roads (70,000 km) are on black clay soils that shrink in drought and swell when wet. Drought-weakened pavements suffer accelerated deterioration when subsequently flooded — documented in peer-reviewed pavement engineering research.
Cattle: The 2013–2019 drought forced destocking at ~$68 per head; by 2021, restocking cost $1,500+ per head — a 20–25x price swing. The 457,000 cattle killed in the February 2019 monsoon had been weakened by six years of preceding drought.
Fencing: Exclusion fencing costs have tripled in a decade ($5–7k/km to $15–20k/km). The 2025 floods destroyed 8,500 km of exclusion fencing and 12,000 km of internal fencing — an estimated $150–250 million to replace. The government has committed $105 million for exclusion fencing alone.
Water: The Millennium Drought drove $6.9 billion in emergency water infrastructure. A further $4–8 billion new desalination plant is planned for 2035.
The climate projections confirm this cycle will intensify: drier winters, more intense rainfall events when they occur, warmer temperatures accelerating evapotranspiration. The net effect is wider swings between extremes.
Queensland’s disaster costs are rising, the climate trajectory ensures they will continue to rise, and the state’s own fossil fuel exports are contributing to the problem. For investors, this creates a structural growth opportunity in the sectors that prepare for and repair the damage.
References
Disaster cost data
- Deloitte Access Economics, Building Australia’s Natural Disaster Resilience (2017, updated 2021, 2024). Commissioned by the Australian Business Roundtable for Disaster Resilience and Safer Communities.
- Insurance Australia Group / Deloitte, “Natural disasters estimated to cost Australia $73 billion per year by 2060” (2024).
- Insurance Council of Australia, Insurance Catastrophe Resilience Reports (annual) and ICA Catastrophe Database (1967–present).
- Climate Council, State of Queensland: Disaster Ground Zero (2024).
- Queensland Reconstruction Authority, Annual Report 2024–25.
- World Bank, Queensland Recovery and Reconstruction in the Aftermath of the 2010/2011 Flood Events and Cyclone Yasi (2011).
Economic data
- ABS, Australian National Accounts: State Accounts, 2024–25 (Cat. 5220.0).
- DFAT, Queensland Country Economic Fact Sheet, 2024–25.
- QLD Budget 2025–26, Budget Paper No. 2: Budget Strategy and Outlook.
- Tourism Research Australia, State Tourism Satellite Account.
Climate science
- CSIRO/BoM, State of the Climate 2024.
- IPCC AR6, WGI Chapter 11: Weather and Climate Extreme Events.
- QLD Future Climate Science Program (CMIP6 projections).
- ABARES, Effects of Drought and Climate Variability on Australian Farms.
Great Barrier Reef
- GBRMPA, Outlook Report 2024.
- Deloitte Access Economics, At What Cost? (2024) and At What Price? (2017).
Scope 3 emissions
- Climate Analytics, Australia’s Global Fossil Fuel Carbon Footprint (August 2024).
- QLD Department of Natural Resources, Coal Industry data.
- QLD State of the Environment Report 2024, Greenhouse Gas Emissions.
Insurance
- ACCC, Northern Australia Insurance Inquiry Final Report (2020).
- CHOICE, Home Insurance Premiums (2025).
- Actuaries Institute, The Climate Change Adaptation Gap (2024).
Investment
- Bloomberg, “Disaster Recovery Is an $8 Trillion Driver of US Growth” (2025). Bloomberg Prepare and Repair Index.
Data quality
- ABS, Measuring Natural Disasters in the Australian Economy.
- Handmer, J. et al., “How much do disasters cost? A comparison of disaster cost estimates in Australia,” International Journal of Disaster Risk Reduction (2016).