A look at the updated Snowy business case
Snowy Hydro has its updated (as of August 2023) business case on its website. I am a bit out practice at looking at Net Present Value (NPV) calculations so reviewing this was a chance to get a bit of “match practice”.
In the brief time available to review the numbers there is nothing that jumps out as being completely unreasonable. In fact if we take Snowy’s estimate of annual after tax cash flows as reasonable, the project looks attractive. This was a surprise to me.
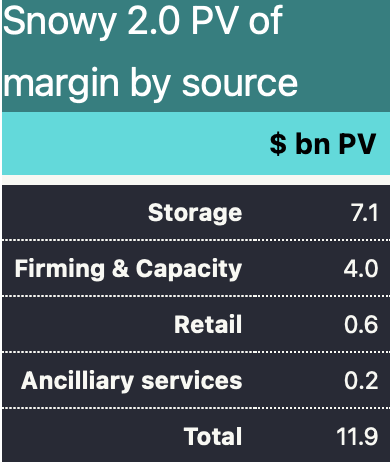
Although I barely scratch the surfact on the biggest component of value, that is simple storage trading which Snowy estimates is worth $7bn based on earning an average trading margin of $100 MWh my own calculations suggests its a reasonable estimate in and of itself. That is I’d expect an asset that generate 2.2 GW with very large storage could earn $100/MWh for 4-6 hours per day. In fact a battery needs double that to justify being built and historic margins have mostly been above $100. However I also think there will be lots and lots of competition in the storage trading space. Still with margins over the past year closer to $300/MWh than $200 there is plenty of headroom for competition.
What I haven’t done is looked at firming and capacity contracts that are the second largest source of value and nor have I looked at the integration of both them to check that for plausibility. Time for lunch.
Overview
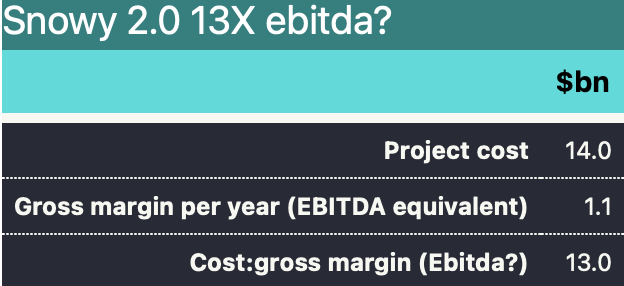
Snowy 2.0’s represents that for the first 15 years of operation it will earn roughly $1.2 bn of gross margin. The trading gross margin is the difference betwee the price electricity sold for and the price paid for it after adjusting for the round trip efficiency factor of say 0.75. I also use storage margin or storage reward for the same concept. The round trip efficiency has two consequences. First it means that to generate for 4 hours you have to pump for 5.3 hours. But when you pump for 5.3 hours its likely that the average cost per hour of pumping will be higher than if you only pumped for 4 hours. You get less choice in the hours to pump. I have used $12 bn for cost which is Snowy’s number. At a minimum there is also capitalised interest to be considered. I would roughly estimate $0.5 bn. I am happy to exclude most of the transmission costs. In the first place its normal to do so, no matter what some say. Secondly I specifically think the business case for Humelink and VNI West is very strong even if Malcolm Turnbull had never induldged his nation building urges. However the component of Humelink that is basically only used for connecting Snowy 2 should be legitimately added to project cost. Including that and the capitalised interest would likely get to $14 bn even if there are no further increases.
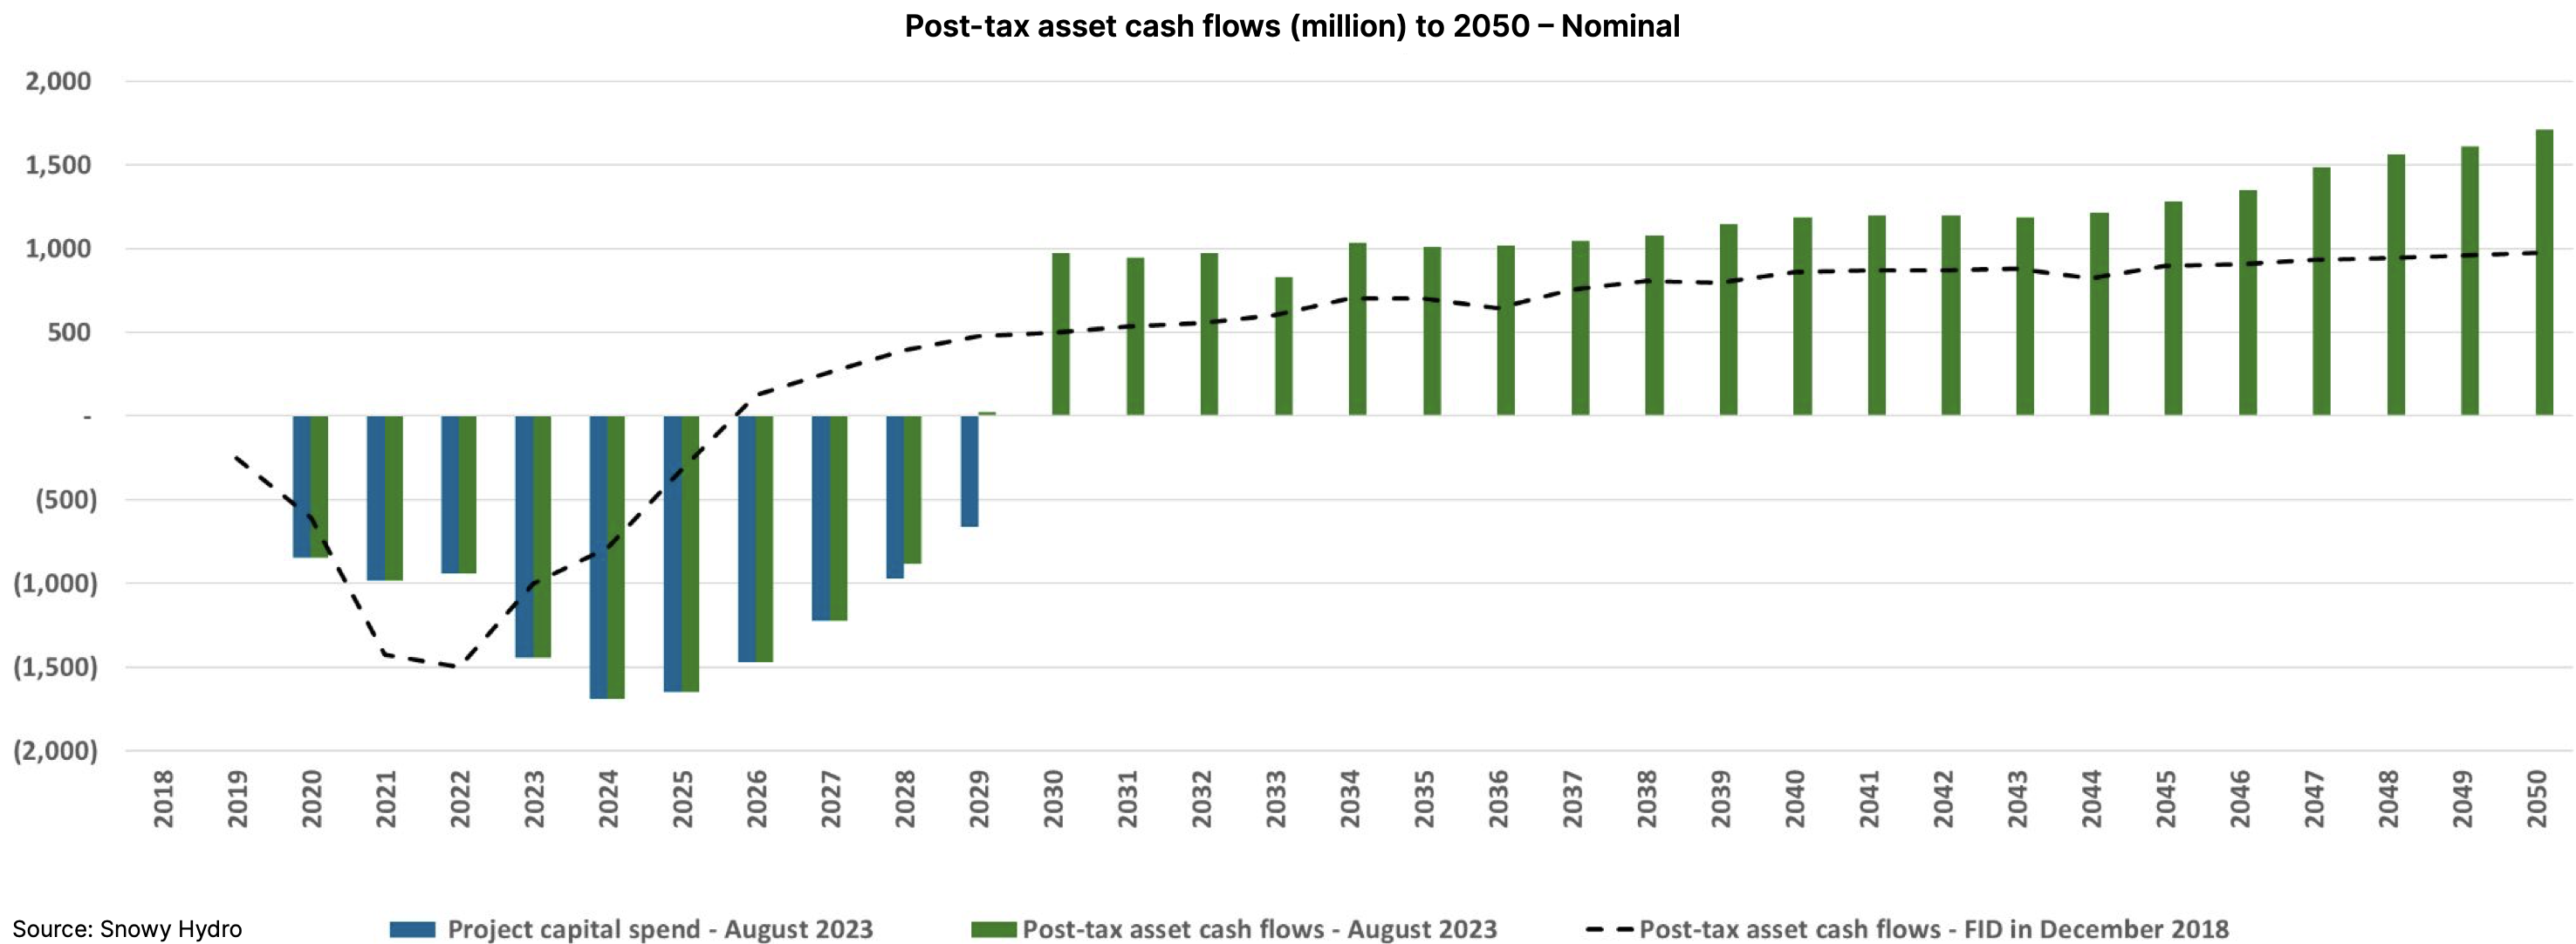
Notice in the table below, the basically universal view of people selling business cases that things will get better in the far distant future. In this case as the dollars are nominal inflation is your friend.
If we assume Snowy’s estimat of its after tax cash flows are accurate then once we allow for the value beyond 2050 as little as it is, then I estimate the project’s underlying rate of return is about 9%.
The vast majority of the value is created from the storage reward but Snowy also plans to sell firming products. It is in a position to do this, up to a point, because of the quantity of stored energy and also its access to its own traditional generation capacity as a backup. However it cannot double dip on the same MW for two different revenue streams at the one time. That is it cant be selling the same MW in the spot market and also firming someone else’s solar plant at the same time.
Snow’s NPV is a bit easier becaue the volume is fixed. There is no growth
In most cases much of the debate around the value of a business centres on forecasting the growth rate of cash flows. However for an individual unit of production like a single factor, or in this case pumped hydro project, the volumes have a fixed limit, the only variable to be forecast is the average price.
In saying that Snowy 2.0 has a huge amount of storage 175 GWh relative to any other long duration storage project. The mooted Borumba project has similar size but even its 48 GWh is modest compared to Snowy 2.0.
I am well aware that the ability of Snowy to replenish its storage when ever it wants to is hotly contested, but I don’t propose to consider that in this note. I have zero knowledge on that topic.
Looking at the Storage gross margin
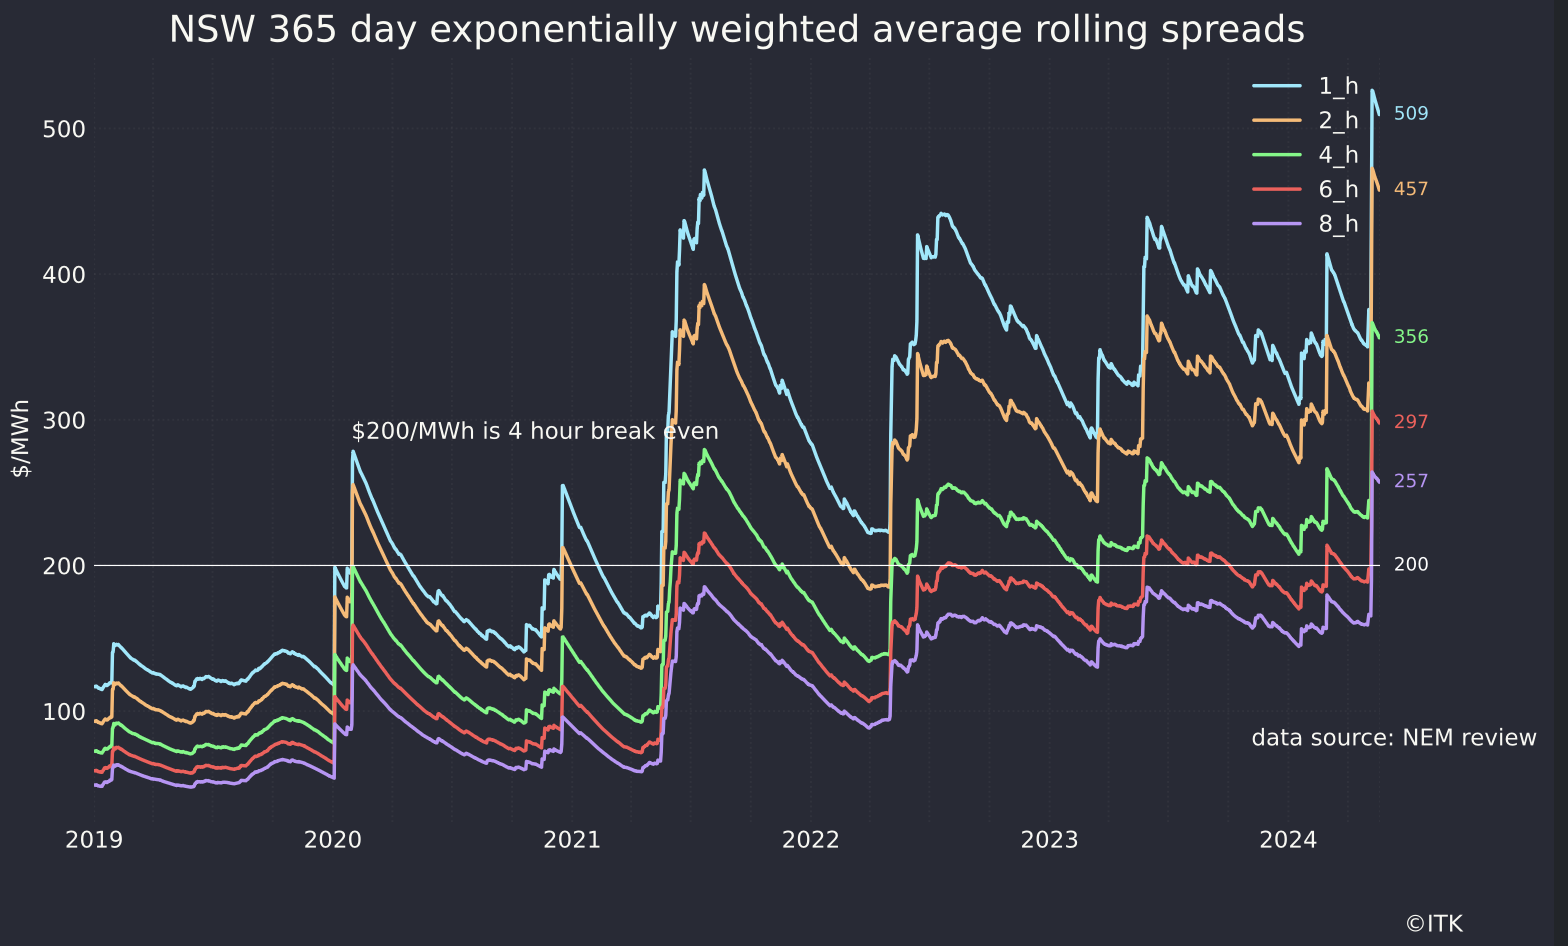
Before doing some specific analysis I can take some numbers I update every week on battery margins that assume a battery operator has perfect foresight and can pick the highest prices to generate at and lowest prices to pump at every day.
The red line is a six hour spread and the green 4 hours. Those margins over the past year average $297 and $356 per year. These are 3X the numbers assumed in the Snowy value case so very supportive.
Equally a new four hour battery at recent CSIRO Gencost, which in this instance I think are well in the ballpark, requires between $200/MWh and $300MWh to justify the initial investment. In practice the batteries are built on the assumption at frequency regulation will provide some of the revenue. Like Snowy once the battery is built, it can undercut Snowy because Snowy’s round trip efficiency is worse than a battery. Snowy says the design life is 150 years, whereas a battery design life is 20 years. Snowy’s capital cost goes up every year, whereas for the next decade or so battery costs will fall say 6% a year.
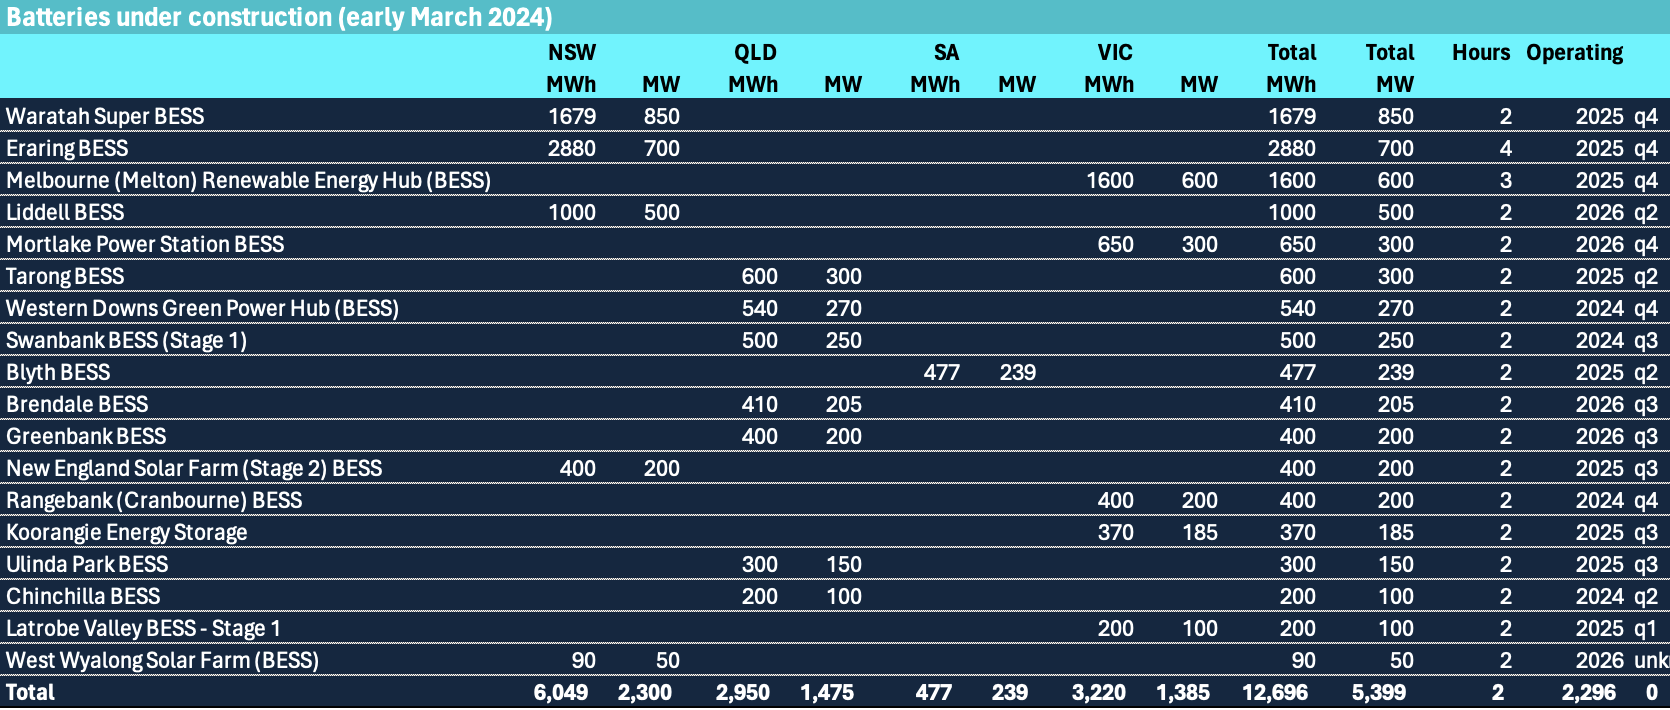
I have no doubt at all that when 5 GW of new batteries under construction are actually operating and even assuming that only say 75% of that is devoted to trading that margins will fall from the current levels.
However if margins fall to the $100/MWh assumed by Snowy the batteries will not recover their capital costs.
Looking at it in a fairly casual NPV persective my first guess is that if we ignore tax the numbers support Snowy’s estimate of the storage NPV at around $7bn. To see that I made use of the “Gordon Growth formula”. This approximates the NPV of an anual cash flow as \[
\begin{align*}
&\frac{\text{CF}}{\text{WACC} - g} \\
\text{where:} \\
&\text{CF} = \text{Cash Flow} \\
&\text{WACC} = \text{Weighted Average Cost of Capital} \\
&g = \text{Growth Rate (assumed to be inflation)}
\end{align*}
\] 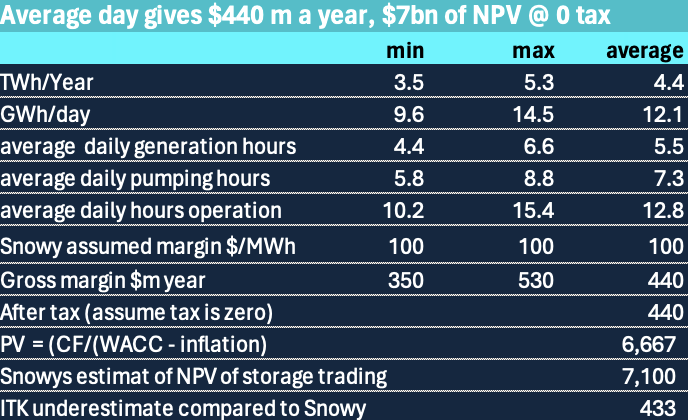
The TWh a year and assumed margin were supplied in the business case document. They are almost credible.
Finance 101 in 3 paragraphs
TL:DRA At the risk of boring readers, a reminder that the NPV (which my ex boss used to say stood for No Present Value) makes use of the concept that people will pay more for $1 that they get today compared to $1 in a year’s time and a $ received in two year’s time. If the rate of interest is 10% you would pay 1/1.1 for 1$ to be received in one year and \[ \frac{1}{1.1^2} \] for $1 to be received in two years time and so on. By estimaing the cash inflows and outflows for each year and choosing a discount rate one calculates the NPV.
Many a textbook has been written about the choice of discount rate which, for something involving risk uses the Weighted Average Cost of Capital (WACC) but the simplest and oldest version is the after tax cost of debt plus the cost of equity, using the proportions of each. The cost of equity is a long topic mainly because of the uncertainly around the appropriate measure of risk
NPVs involve forecasts of future cash flows which are highly uncertain. The NPV is also sensitive to the choice of discount rate and the number of years over which the cashflows are forecast. However for any reasonable discount rate, cashflows more than 30 years in the future have little impact on the NPV. Or to put it another way cash flows received in the earlier years of the project have a much bigger impact than out year ones.
