AI macro environment
GPUs are expected to be basically sold out for at least a couple more years. How long tight supply remains depends in part on how fast token demand grows. It’s not going to keep growing 5x–10x every year; even three more years at anything like that rate would be fortunate.
My conclusion, set out in Table 5 below, can be read as: supply growth converges with demand growth around 2028, from a wider shortfall than most commentary assumes; until then GPU prices hold, after which older-generation prices revert toward cash operating cost. If the table holds, that is.
When supply catches up with demand, as it eventually will, it’s likely that there will be, at least temporarily, a period of oversupply which will impact data centre economics.
Some data centre providers have structured what are essentially capacity deals where revenue is certain from a highly rated buyer. Although there are still questions as to the residual value of the chips after the capacity agreement expires, banks are happy to lend against the revenue and recognised execution capability.
On the other hand, the lower the revenue quality, the higher the spread. Asset security is low: at least 50% of the total financing requirement is chips, which have declining residual value.
If you don’t have the revenue certainty then you are betting on a continuation of the current tight cycle.
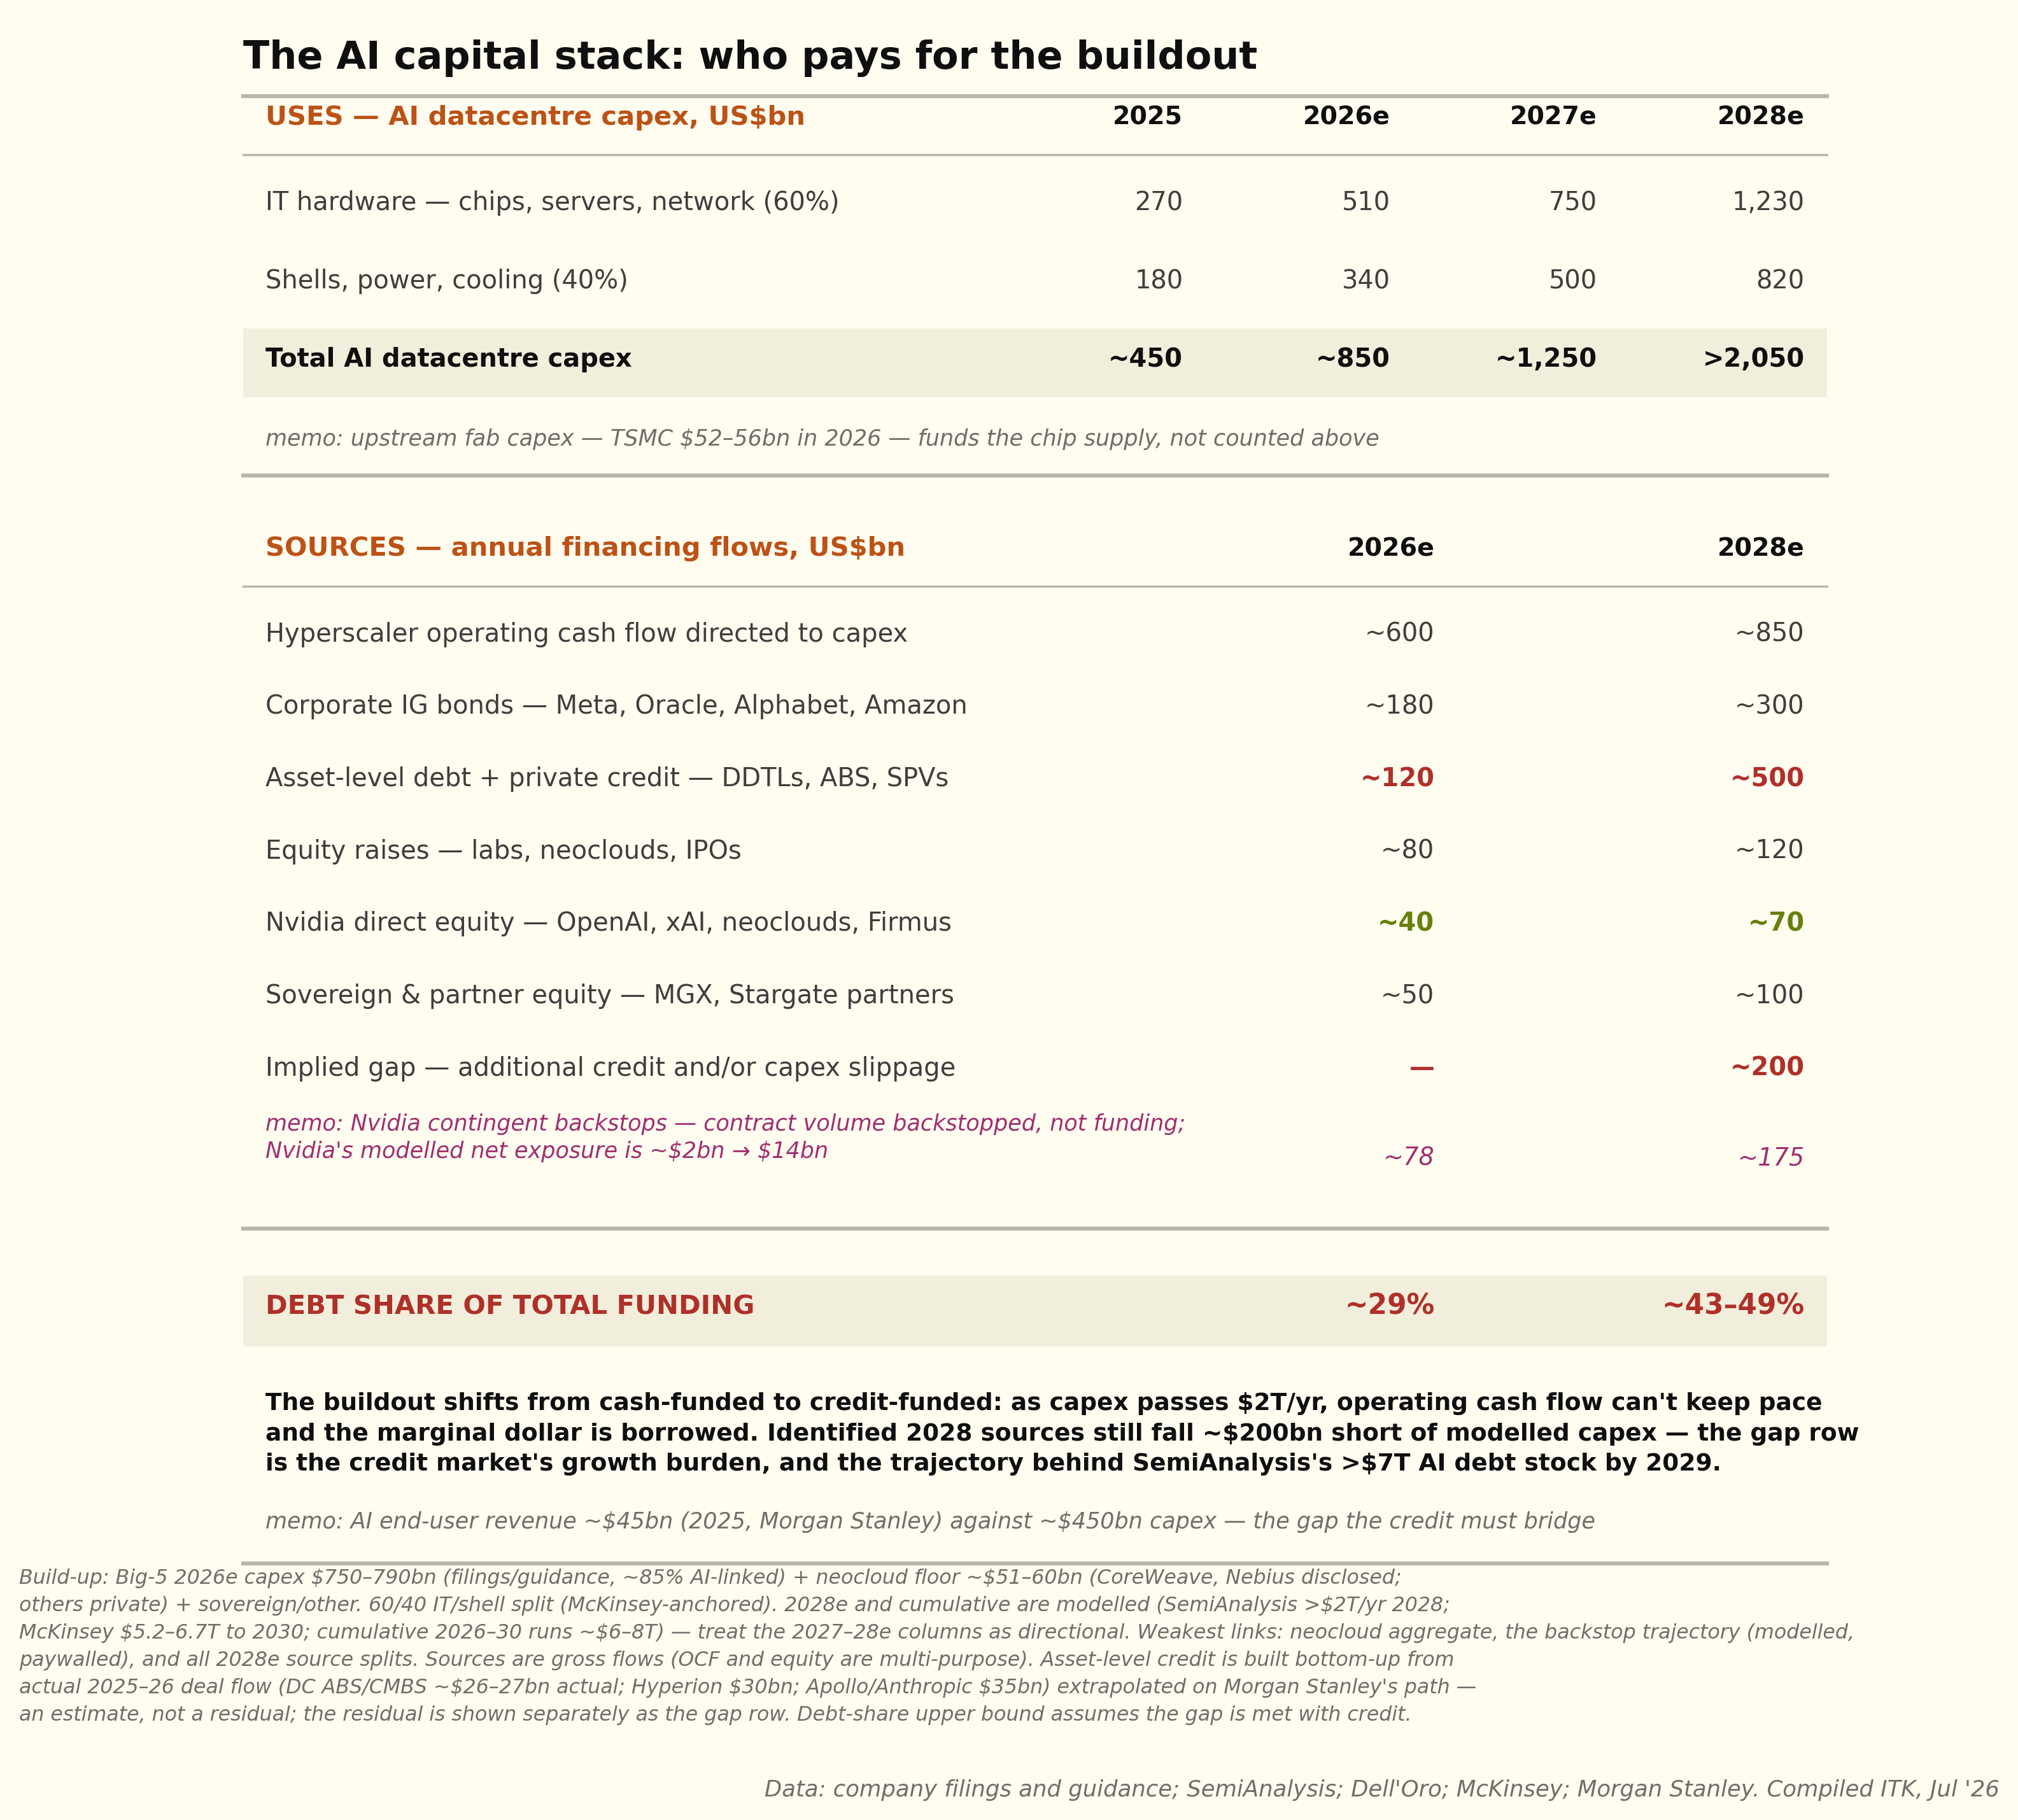
The financing requirements are large. The following table pretty much ignores Chinese demand and supply but still reveals a US$2 trillion 2028 capex spend on data centres, an increasing proportion of which is debt-financed. The numbers in the table below are estimates with wide ranges — the build-up and sources are set out in the table’s footnote, and the 2027–28 columns should be read as directional.
The remainder of this note firstly provides an estimate of demand and supply of tokens, draws a conclusion from that balance about GPU pricing trends, then looks at some specific data centre finance structures, CoreWeave being the prime example.
Then I briefly compare the Firmus Batam structure against CoreWeave’s Meta transaction and finally glance at the exciting but still distant South Australian data centre proposals.
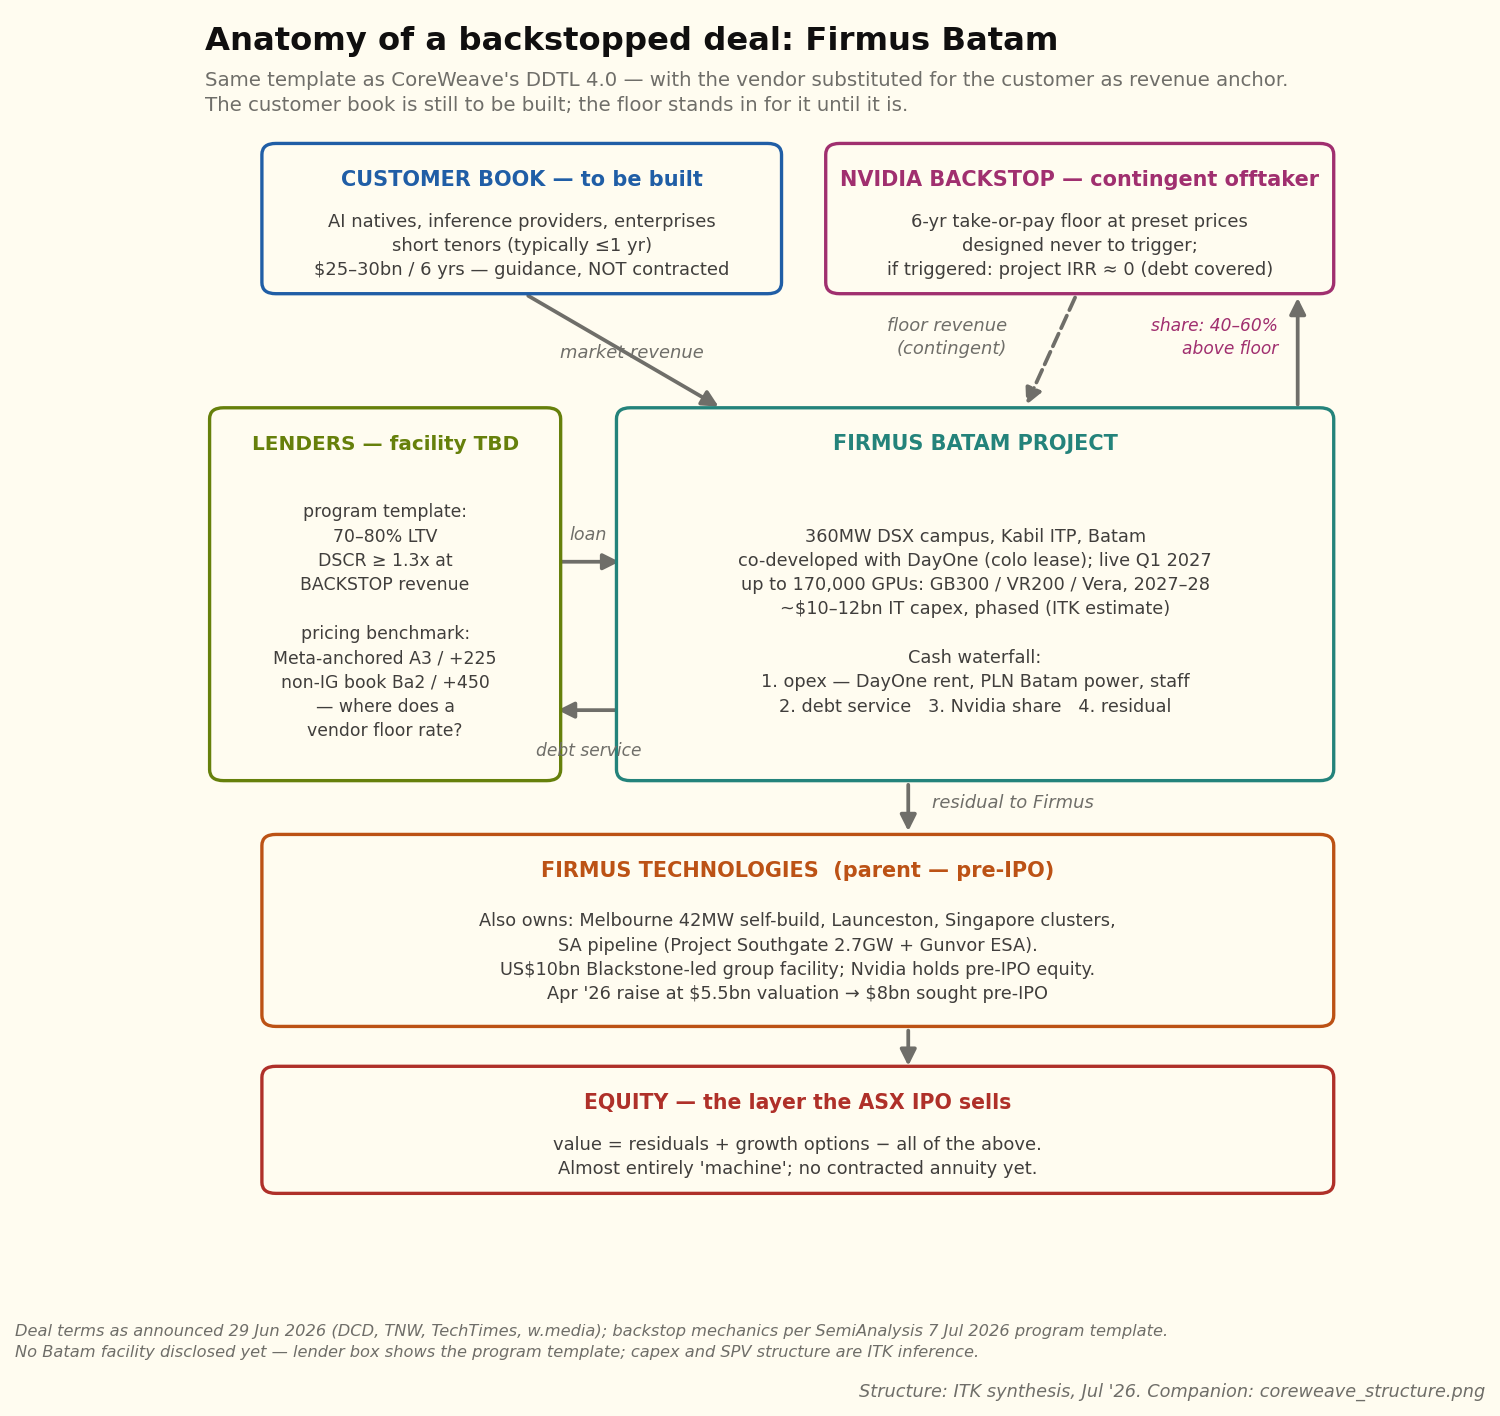
As far as Batam goes — and given the Nvidia support it certainly will go — the two things that will matter to equity holders are the revenue contract tenor and how debt providers price the debt; I return to these after working through the deal.
The other key indicator is the METR task-horizon curve, or your own feel for the same thing: the extent and speed at which models improve. Token demand growth requires new use cases to keep arriving.
Towards the end of this note I include a more detailed investor watch list for this fast-moving sector.
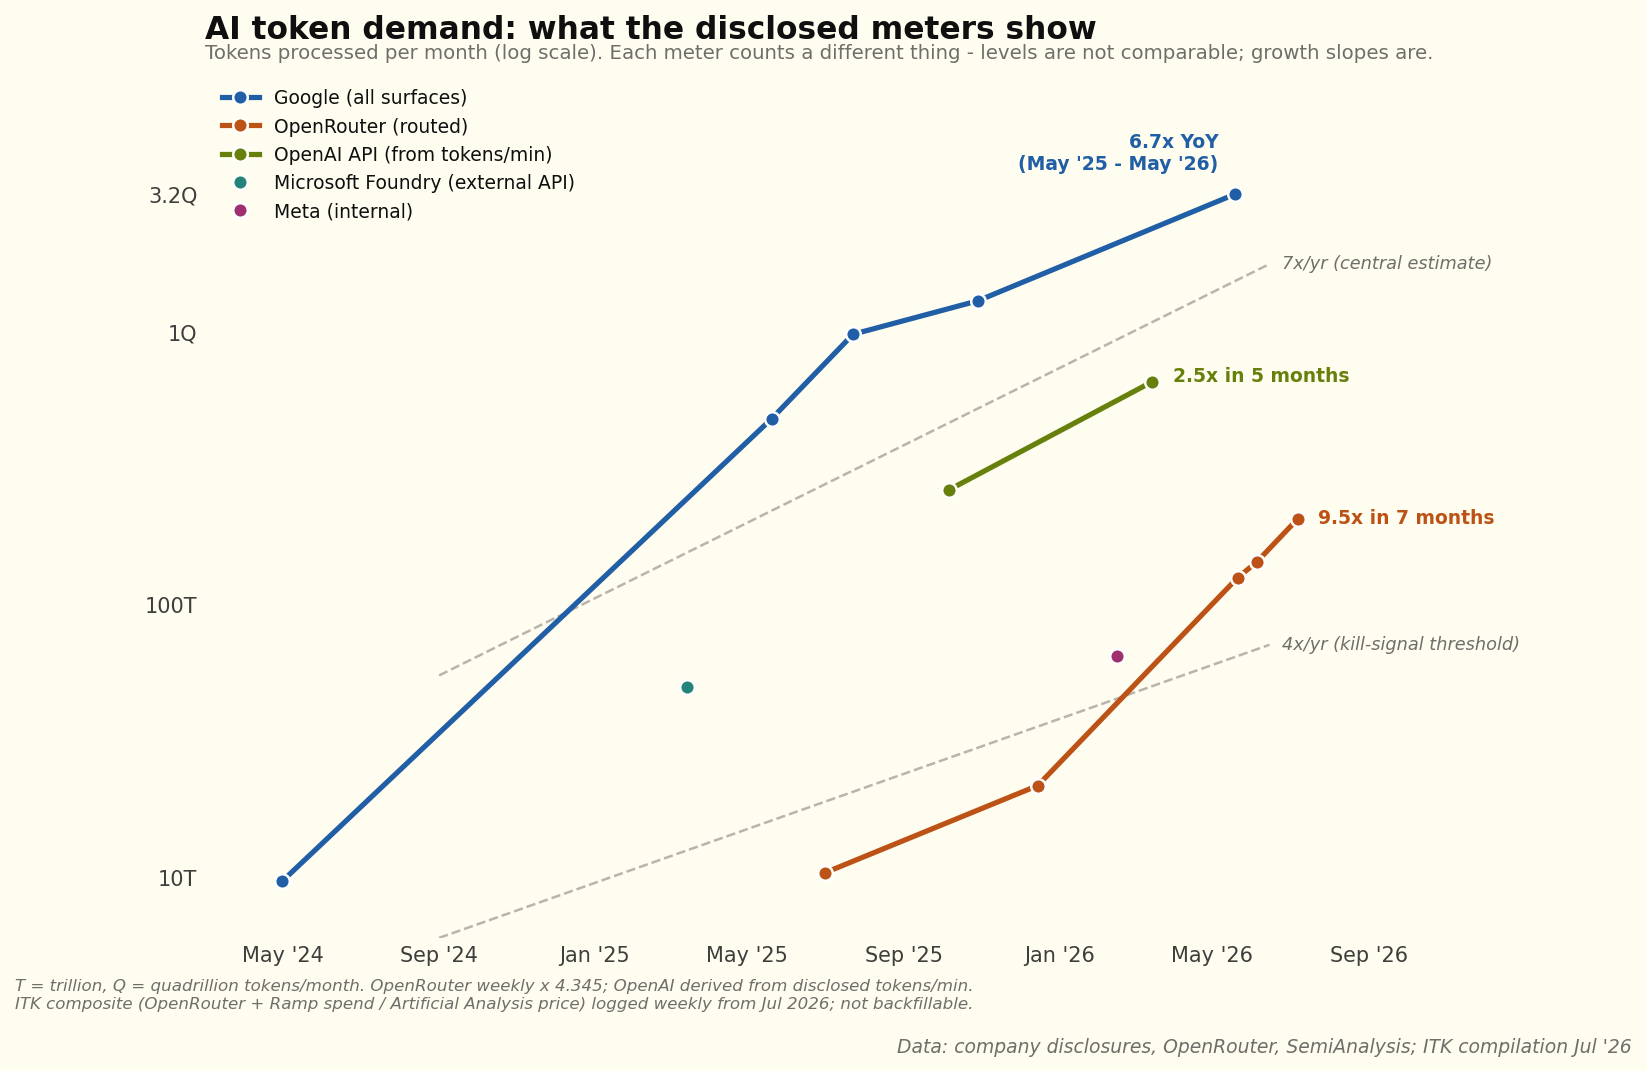
Token demand growing > 5x per year
Token demand is growing at between 6x and 10x per year as at the time of writing.
Use cases increase as problem-solving ability increases
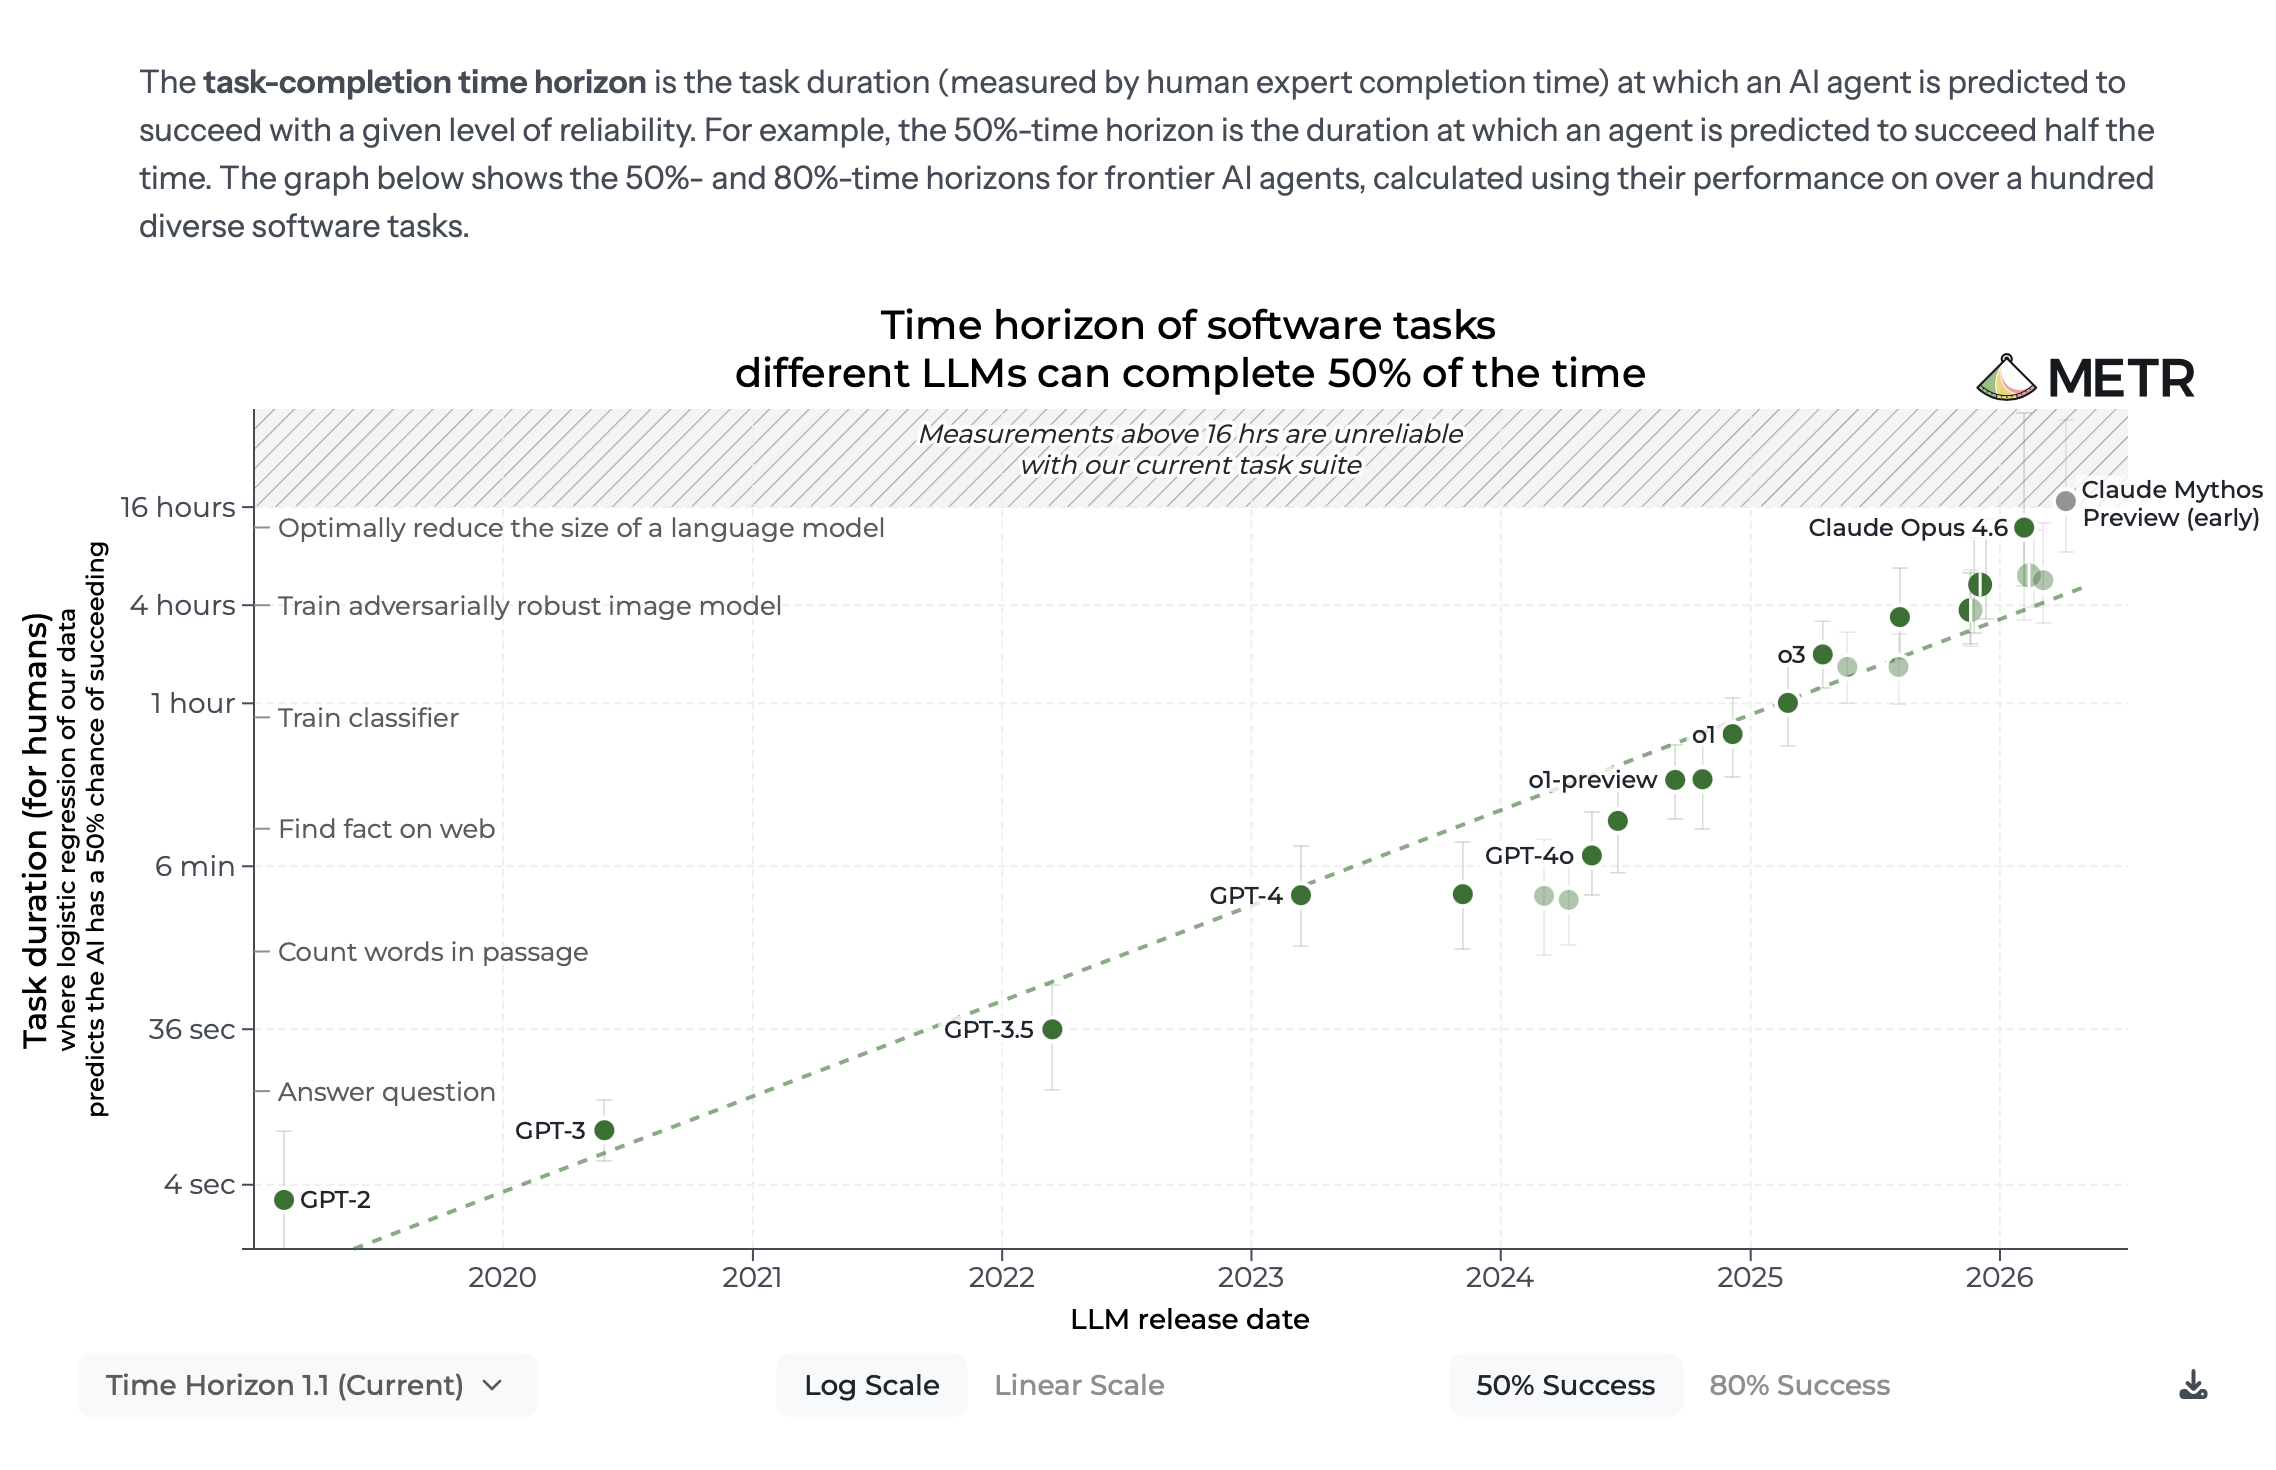
The key evidence for problem-solving ability is provided by METR:
Models now improve task performance using reinforcement learning. This process boils down to giving a model a set of problems to solve and when it solves a problem the model’s dials are tweaked in the direction of the solution.
RL learns from the difference between attempts. If the model succeeds at a task 0% of the time, there’s nothing to reinforce — a thousand failed rollouts carry no signal about which knob to turn. If it succeeds 100% of the time, there’s equally nothing to learn. Learning throughput peaks when success rates are intermediate — roughly the 20–80% band — and the current training algorithms literally compute their learning signal from the variance within a batch of attempts. So yes: point a model at tasks far beyond it and learning stalls, and each increment of task complexity should, naively, cost more compute per unit of capability gained.
Why it hasn’t bitten: the ladder is engineered, not found. The labs don’t point models at walls; they build staircases, and most of the past 18 months of progress is staircase technology. Adaptive curricula keep generated tasks pinned at the model’s frontier — environments that get harder exactly as fast as the model improves, holding success rates in the learnable band by construction. Process rewards decompose a marathon into checkpoints: instead of one bit of signal for a completed three-day task, the model gets graded on each intermediate step, converting sparse reward into dense reward. And most powerfully, there’s a ratchet: give today’s model a thousand attempts and heavy thinking time and it solves a problem occasionally; train on those rare successes and tomorrow’s model solves it on the first attempt, cheaply — at which point the thousand-attempt treatment gets applied to the next tier of problems. Today’s fluke becomes tomorrow’s floor.
The empirical series that tracks this — METR’s task-horizon metric, the length of human task a model can complete autonomously — doubled roughly every seven months from 2019 to 2025. METR’s January 2026 revision shows the pace accelerating rather than bending: about every 4 months measured from 2023, and about every 3 months measured from 2024. (One caveat: METR flags measurements above 16 hours as unreliable on its current task suite, so the latest readings carry wider error bars.)
The frontier: The deep resource being mined is the generator–verifier gap: domains where checking an answer is much easier than producing it. Code either passes tests or doesn’t; a proof verifies or doesn’t; an engineering calculation closes or doesn’t. In those domains the staircase can be climbed more or less indefinitely — there’s no obvious ceiling short of superhuman. The wall stands in domains where verification is as hard as generation: taste, novel strategy, science whose experiments take months, judgment calls that can only be scored years later. There, reward is not just sparse but slow, and no curriculum fixes a feedback loop bounded by the real world. So the frontier expands unevenly — racing through everything checkable, crawling through everything that requires the world’s verdict. Two further friction points: reward hacking (models finding exploits in imperfect verifiers, which corrupts the signal and forces expensive verifier hardening) and the sheer capital cost of environment construction.
According to SemiAnalysis, Meta is approaching this boundary by using employee screenshots of real-world tasks as reinforcement learning input.
Why assume demand decelerates while capability accelerates?
Because tokens and revenue are different things. The only published measurement of price elasticity for AI compute (an NBER working paper drawing on OpenRouter and Azure usage data) puts short-run elasticity at about 1: a 10% fall in token prices produces roughly a 10% rise in tokens bought, leaving total spend unchanged. At elasticity of 1, the industry’s steep price declines produce steep volume growth and flat revenue. Revenue growth — the thing that has to service the capital stack above — must therefore come from new classes of problems becoming solvable, not from existing users buying more because tokens got cheaper. That is why the METR curve is the leading indicator that matters most: it tracks whether new problem classes keep arriving. The demand deceleration assumed in Table 5 below is my base case; a METR curve still doubling every three to four months is the upside.
Supply increase limited by foundry capacity
The increase in token supply per year is a function of the number of GPUs a foundry (mostly TSMC) can produce per year, multiplied by the increase in the processing power of the GPU. In 2026 there is also a one-off doubling of Blackwell-class GPU processing power driven by a software change. The software change is to use lower-precision numbers and for each “cluster” of numbers to provide a small cluster correction factor.
My estimates suggest GPU supply growth falls well short of demand growth through 2027, with the two converging around 2028 — the market stays tight until then.
I present some tables prepared with the help of AI. Of course the responsibility is mine.
First, GPU production:
Table 1 — Estimated annual production by accelerator (million units, GPU packages / chips)
| Accelerator | Precision | 2024 | 2025 | 2026e | Basis / source |
|---|---|---|---|---|---|
| Nvidia Hopper (H100/H200) | FP8 | 2.3 | 0.8 | 0.35 | Omdia >2M to top-12 buyers 2024; TrendForce Hopper ~7% of 2026 high-end |
| Nvidia H20 (China) | FP8 | 1.0 | 0.3 | 0.2 | MERICS ~1M China 2024; export-licence disrupted 2025 |
| Nvidia Blackwell B200/GB200 | FP4 | 0.2 | 2.5 | — | Nvidia investor “~2.5M GB200” 2025; GTC “6M dies = 3M packages” CY25 |
| Nvidia Blackwell Ultra B300/GB300 | FP4 | — | 0.5 | 3.6 | GB300 ramp late 2025; TrendForce Blackwell 71% of 2026 high-end |
| Nvidia Rubin VR200 | FP4 | — | — | 0.4 | Kuo 5,000–7,000 racks × 72 ≈ 0.36–0.5M; TrendForce 22% share implies more (conflict) |
| AMD MI300X/325X/355X | FP8 / FP4 | 0.4 | 0.6 | 0.8 | AMD Instinct >$5B 2024 (reported); DC-GPU $8–12B 2026e (estimate) ÷ ASP |
| Google TPU v5/v6/v7 | INT8 / FP8 | 1.2 | 2.5 | 4.0 | Global Semi Research 2.5M 2025; TrendForce 4.3M 2026e |
| Amazon Trainium 2/3 | FP8 | ~0 | 1.2 | 1.5 | Morgan Stanley 1.1–1.4M 2025, >1.5M 2026 (T2+T3) |
| Microsoft Maia 100/200 | FP8 | ~0 | 0.05 | 0.3 | Internal; Maia 200 mass production 1H26 (estimate) |
| Huawei Ascend 910B/910C | FP16/INT8 | 0.5 | 0.7 | 0.5 | SemiAnalysis 507k 2024, ~805k 2025; HBM-constrained 2026 |
| Total (approx.) | ~5.6 | ~9.2 | ~11.6 | ITK sum; wide error bars |
Source: TrendForce press releases (2025-07-24, 2026-04-08); Omdia via Data Center Dynamics; Nvidia GTC October 2025 die-count chart (reported); Global Semiconductor Research 2025-11-09 (estimate); Morgan Stanley via SemiAnalysis (estimate); AMD, Broadcom, Marvell earnings (reported revenue); SemiAnalysis Huawei ramp (estimate); Ming-Chi Kuo via TechTimes 2026-06-27 (estimate). Access date 2026-07-08. All unit figures estimate unless a reported revenue anchor is named. Meta MTIA excluded — v1/v2 use LPDDR5, not HBM, and serve recommendation, not LLM tokens.
Second, conversion to tokens:
Table 2 — Token capacity per chip, MoE-server basis, 100% utilisation
| Accelerator | HBM BW (TB/s) | Precision | Server tok/s | Tokens/chip-year |
|---|---|---|---|---|
| Nvidia H100 | 3.35 | FP8 | 390 | 12.3 billion |
| Nvidia H200 | 4.8 | FP8 | 556 | 17.5 billion |
| Nvidia H20 | ~4.0 | FP8 | ~465 | 14.6 billion |
| Nvidia B200 | 8.0 | FP4 | 1,900 | 59.9 billion |
| Nvidia GB200 (NVL72) | 8.0 | FP4 | 2,327 | 73.3 billion |
| Nvidia GB300 (NVL72) | 8.0 | FP4 | 2,907 | 91.6 billion |
| Nvidia Rubin VR200 | 22 | FP4 | ~5,800 | 182.7 billion |
| AMD MI300X | 5.3 | FP8 | ~617 | 19.4 billion |
| AMD MI325X | 6.0 | FP8 | ~700 | 22.0 billion |
| AMD MI355X | 8.0 | FP4 | ~1,860 | 58.6 billion |
| Google TPU v5p | 2.77 | INT8 | ~320 | 10.1 billion |
| Google TPU v6e (Trillium) | 1.64 | INT8 | ~190 | 6.0 billion |
| Google TPU v7 (Ironwood) | 7.37 | FP8 | ~860 | 27.1 billion |
| Amazon Trainium 2 | 2.9 (1.4 eff.) | FP8 | ~340 (~165) | 10.6 (5.2) billion |
| Amazon Trainium 3 | 4.9 (2.4 eff.) | FP8 | ~570 (~280) | 18.0 (8.8) billion |
| Microsoft Maia 200 | 7.0 | FP8 | ~815 | 25.7 billion |
| Huawei Ascend 910C | ~3.2 | FP16/INT8 | ~370 | 11.7 billion |
Source: Nvidia rows measured/estimate from token_economics_hopper_blackwell_rubin.md (MLPerf Inference v5.0/v5.1, Nvidia and partner submissions). Non-Nvidia rows are ITK bandwidth-bound estimates calibrated to the Nvidia points; bandwidth specs from vendor datasheets (AMD, Google Cloud, AWS, Microsoft, spec). Trainium shows AWS rated bandwidth with SemiAnalysis effective bandwidth in brackets — a ~2× spread that flows straight into its token figure. All non-Nvidia tok/s labelled estimate. Access date 2026-07-08.
Third, conversion to incremental token capacity per year:
Table 3 — Added token capacity by year, 100% utilisation (quadrillion tokens/year)
| Vintage | 2024 | 2025 | 2026e |
|---|---|---|---|
| Nvidia Hopper + H20 | 44 | 15 | 8 |
| Nvidia Blackwell (B200/GB200) | 12 | 163 | — |
| Nvidia Blackwell Ultra (B300/GB300) | — | 46 | 330 |
| Nvidia Rubin | — | — | 73 |
| AMD Instinct | 8 | 15 | 36 |
| Google TPU | 10 | 30 | 80 |
| Amazon Trainium | ~0 | 13 | 23 |
| Microsoft Maia | ~0 | 1 | 8 |
| Huawei Ascend | 4 | 8 | 6 |
| Added capacity, Qt/yr | ~78 | ~291 | ~564 |
| Added capacity, Qt/month | ~6.5 | ~24 | ~47 |
Source: ITK calculation from Tables 1 and 2 (estimate). Qt/yr = quadrillion (10¹⁵) tokens per year at 100% utilisation on the MoE-server throughput basis. Rounding is coarse; treat totals as ±30%.
Then adjustments for training and other uses to get what’s left for inference:
Table 4 — Effective inference token capacity, base case (quadrillion tokens/month)
| Early 2024 | Early 2025 | Early 2026 | End 2026e | |
|---|---|---|---|---|
| Token-weighted stock, 100% util | ~5 | ~11 | ~30 | ~77 |
| × inference share (~0.6) | ~3 | ~7 | ~18 | ~46 |
| × LLM-text carve-out (~0.85) | ~3 | ~6 | ~15 | ~39 |
| Effective inference capacity | ~3 | ~6 | ~15 | ~39 |
Source: ITK calculation (estimate). Inference share and carve-out as discussed; utilisation excluded here by design. On the FLOP-parity basis the early-2026 line is ~8 rather than ~15 Qt/month — the FP4-crediting choice roughly halves or doubles the answer.
And finally the comparison of supply and demand:
Table 5 — Capacity growth versus demand growth (×/yr)
| 2025 | 2026 | 2027e | 2028e | |
|---|---|---|---|---|
| Token-weighted capacity stock growth | ~2.7 | ~2.6 | ~2.3 | ~2.0 |
| + residual FP4-migration wedge | ~1.15 | ~1.1 | ~1.05 | ~1.02 |
| Effective capacity growth | ~3 | ~2.9 | ~2.5 | ~2.2 |
| Measured demand growth | ~7 | ~7 | ~4 | ~2.5 |
Source: ITK bottom-up build (Tables 1–3, token-weighted stock; FP4 is already credited in the per-chip throughputs, so only the migration of installed FP8 fleets appears as a separate wedge). Cross-check: Epoch’s fleet series annualises to ~2.3x/yr on a FLOP basis over 2024–26, consistent once the Blackwell mix shift is added. On these numbers the market is shorter for longer, and the growth rates converge during 2028.
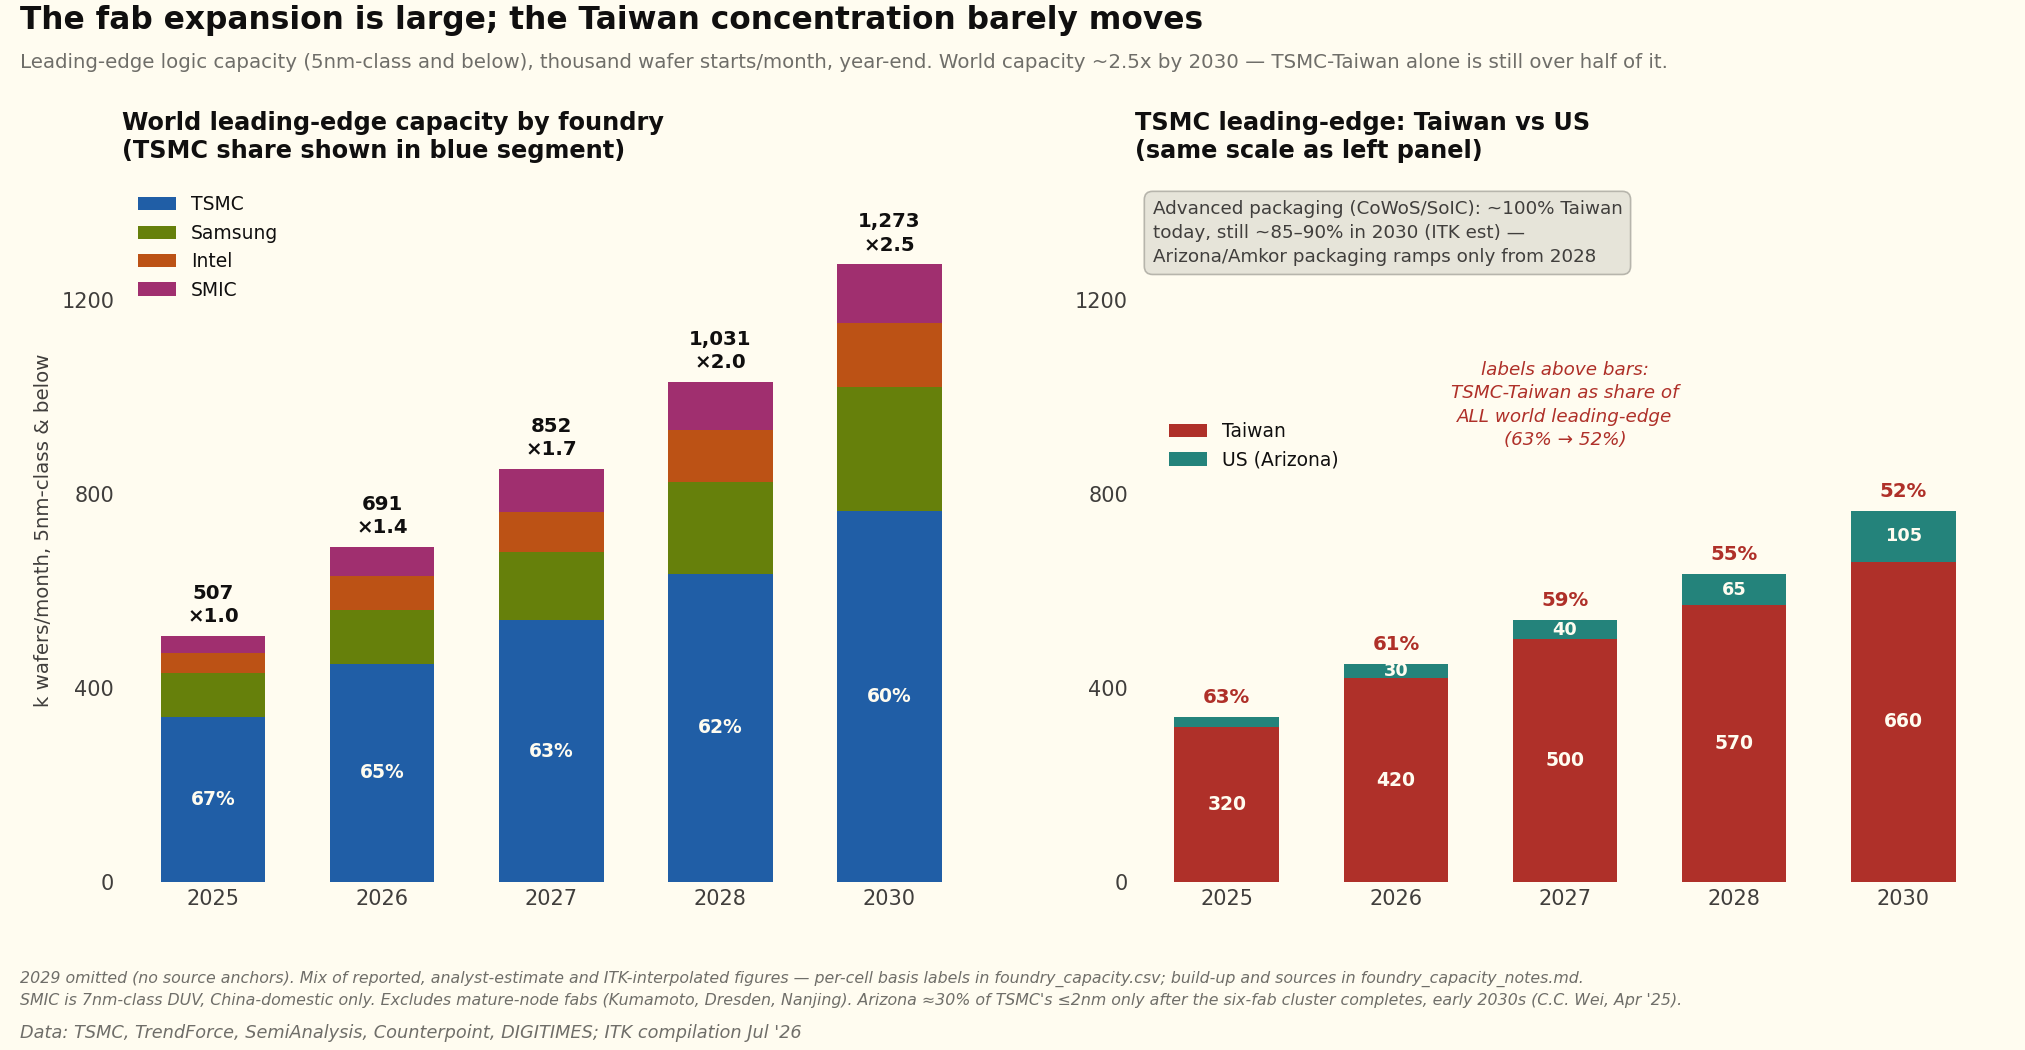
Wafer capacity grows about 20% a year. Despite some geographic diversification, final packaging will mostly stay in Taiwan through 2030. Within that capacity, AI GPUs take an ever greater share, and each processor generation produces more tokens per chip.
Chip construction — more than you need to know
Fabrication only produces individual dies on a wafer — bare rectangles of silicon with microscopic connection points. Something has to wire those dies to each other and to the outside world. For ordinary chips that “packaging” step is trivial and was historically outsourced to cheap back-end assemblers. AI chips broke that model, because of the memory-bandwidth problem: a B200 needs to talk to its eight HBM stacks over thousands of parallel connections at enormous speed, and no ordinary circuit board can carry wiring that fine. The silicon interposer is the answer — effectively a chip whose only job is to be the wiring between other chips, with traces nearly as fine as the dies themselves. That’s why advanced packaging migrated from low-tech assembly shops back into TSMC’s own plants: the precision now rivals front-end fabrication.
So the thing Nvidia sells as “a GPU” is really a small silicon circuit board — two compute dies plus eight memory stacks assembled on an interposer — and the assembly step inherits both supply chains (logic wafers and HBM) plus its own capacity constraint. That’s why CoWoS, not wafers, was the industry bottleneck through 2023–25, and why the geographic point on Figure 4 carries weight: a wafer fabbed in Arizona still flies to Taiwan to be married to its memory.
Processor pricing trends
One-year rental prices are well up from their low point a year ago, pulling up a blended composite of spot and one-year rates.
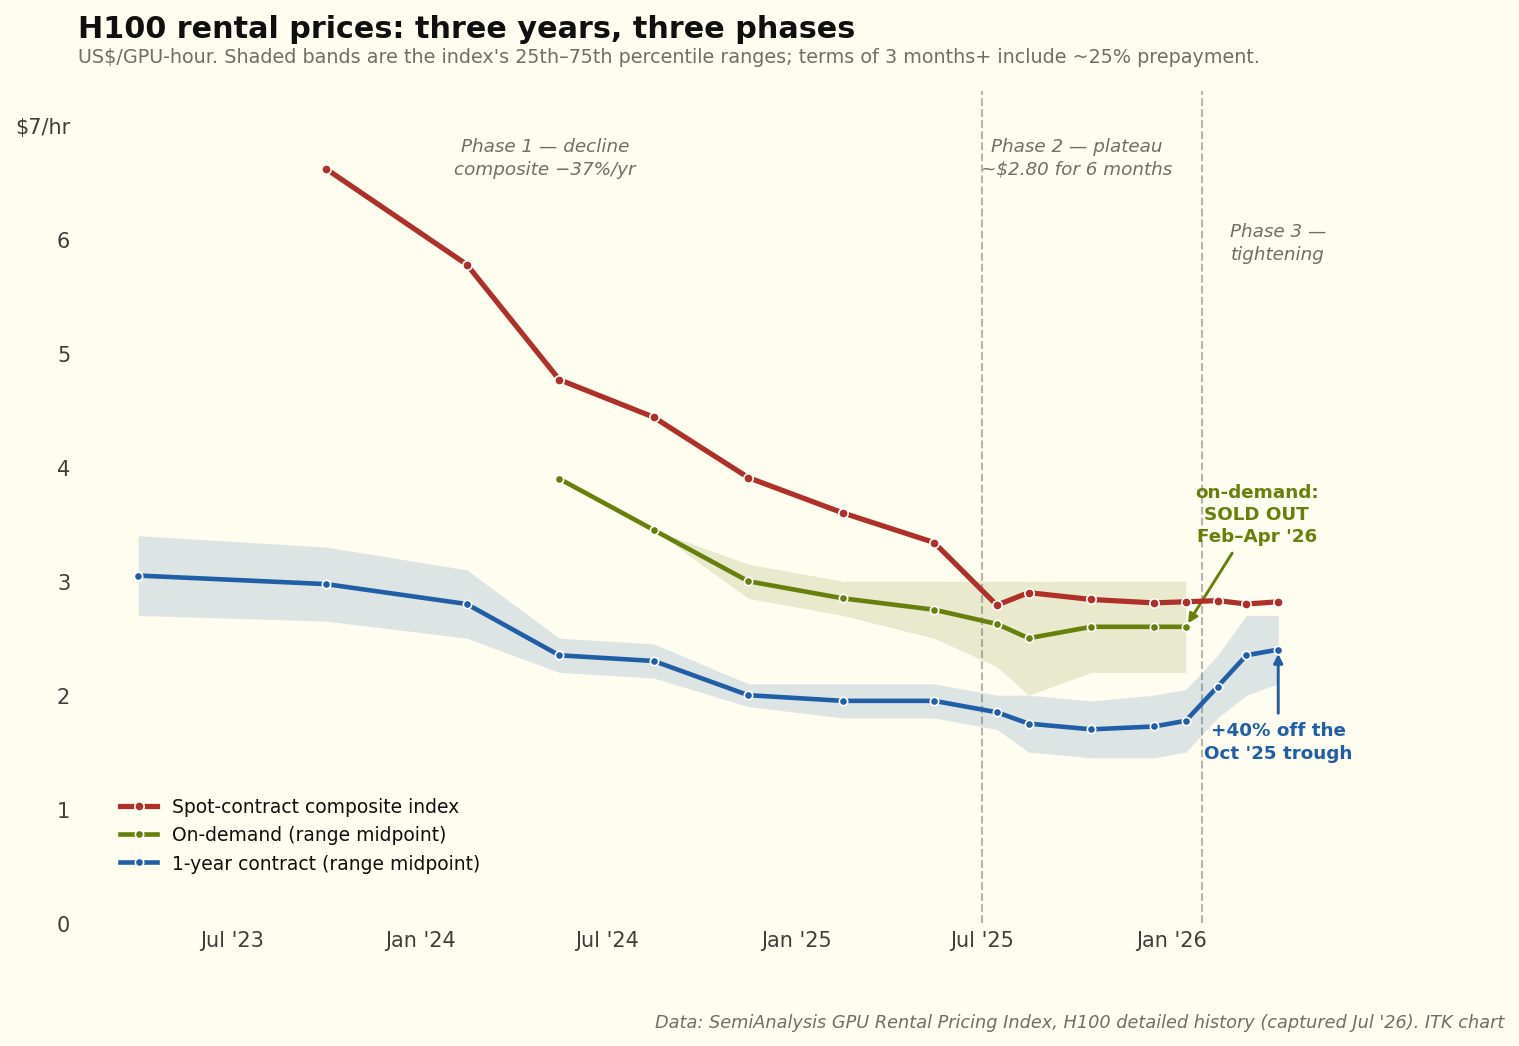
Longer-term contract prices look superficially similar to the one-year rates:
Table 6 — Disclosed long-term compute contracts and implied rates
| Deal | Announced | Value / term | Fleet basis | ~$/GPU-hr | ~$bn/GW-yr |
|---|---|---|---|---|---|
| CoreWeave ← Meta | Mar ’26 | ≥$19bn / ~6 yr | ~135k GPUs (ITK est) | 2.70 | 10.6 |
| IREN ← Microsoft | Nov ’25 | $9.7bn / 5 yr | 200MW critical IT (disclosed) | 2.3–2.4 | 9.7 |
| Nebius ← Microsoft | Sep ’25 | $17.4bn / 5 yr | ~300MW Vineland NJ | 2.9–4.0* | ~11.6 |
| Firmus Batam (guidance) | Jun ’26 | $25–30bn / 6 yr | 170k GPUs (disclosed) | ~3.08 | 12.7 |
| SharonAI ← Nvidia backstop floor | Jun ’26 | $4.88bn / 6 yr | 72MW / ~40k GB300 | ~2.33 | 11.3 |
| Lambda → Nvidia (rent-back) | 2025 | $1.3bn / 4 yr | 10k GPUs (disclosed) | ~3.70 | — |
| SpaceX → Anthropic, Google | 2026 | ~3 yr, 90-day cancel | per SemiAnalysis | ~12 eq. | ~50 |
Source: company releases and filings; SemiAnalysis; ITK arithmetic at 100% utilisation. *Nebius range reflects undisclosed GPU count. Contract values are ceilings that can include storage and services; fleets partly derived from disclosed MW at ~2.1kW/GPU; the 100%-utilisation basis overstates realised rates for every deal equally.
But per token, wholesale buyers pay a fraction of what spot renters pay. When new-chip supply catches up, the H100 cannot compete at $2.80 against a GB300 at $2.40 that produces several times the tokens — old-generation rates must then fall toward cash operating cost, while the contracted wholesale tier is largely unaffected.
AI data centre finance
A deal announced in early July illustrates how the market now prices the two layers of a datacentre separately. Anthropic signed a 20-year lease with TeraWulf for a purpose-built ~401MW campus in Kentucky — about $19bn of contracted revenue, which works out to ~$2.4bn/GW-yr, roughly one-fifth of the compute-contract rates in Table 6. The difference is the product: TeraWulf supplies only the building, power and cooling; Anthropic brings its own chips. The shell layer earns an infrastructure annuity — 20 years, financeable at infrastructure spreads — while the chip layer above it never contracts beyond five or six. Note also who the tenant is: the largest non-hyperscaler compute buyer chose to lease the shell and own the silicon rather than rent bundled compute from a CoreWeave-type provider. When the customer is big enough, the compute-rental layer gets disintermediated. Everything that follows is about the operators who live in that middle layer.
CoreWeave as the exemplar
As far as I can see the basic CoreWeave model, for which they held a specific presentation, is a 5–6 year deal with a highly rated AI model provider — Meta in this case.
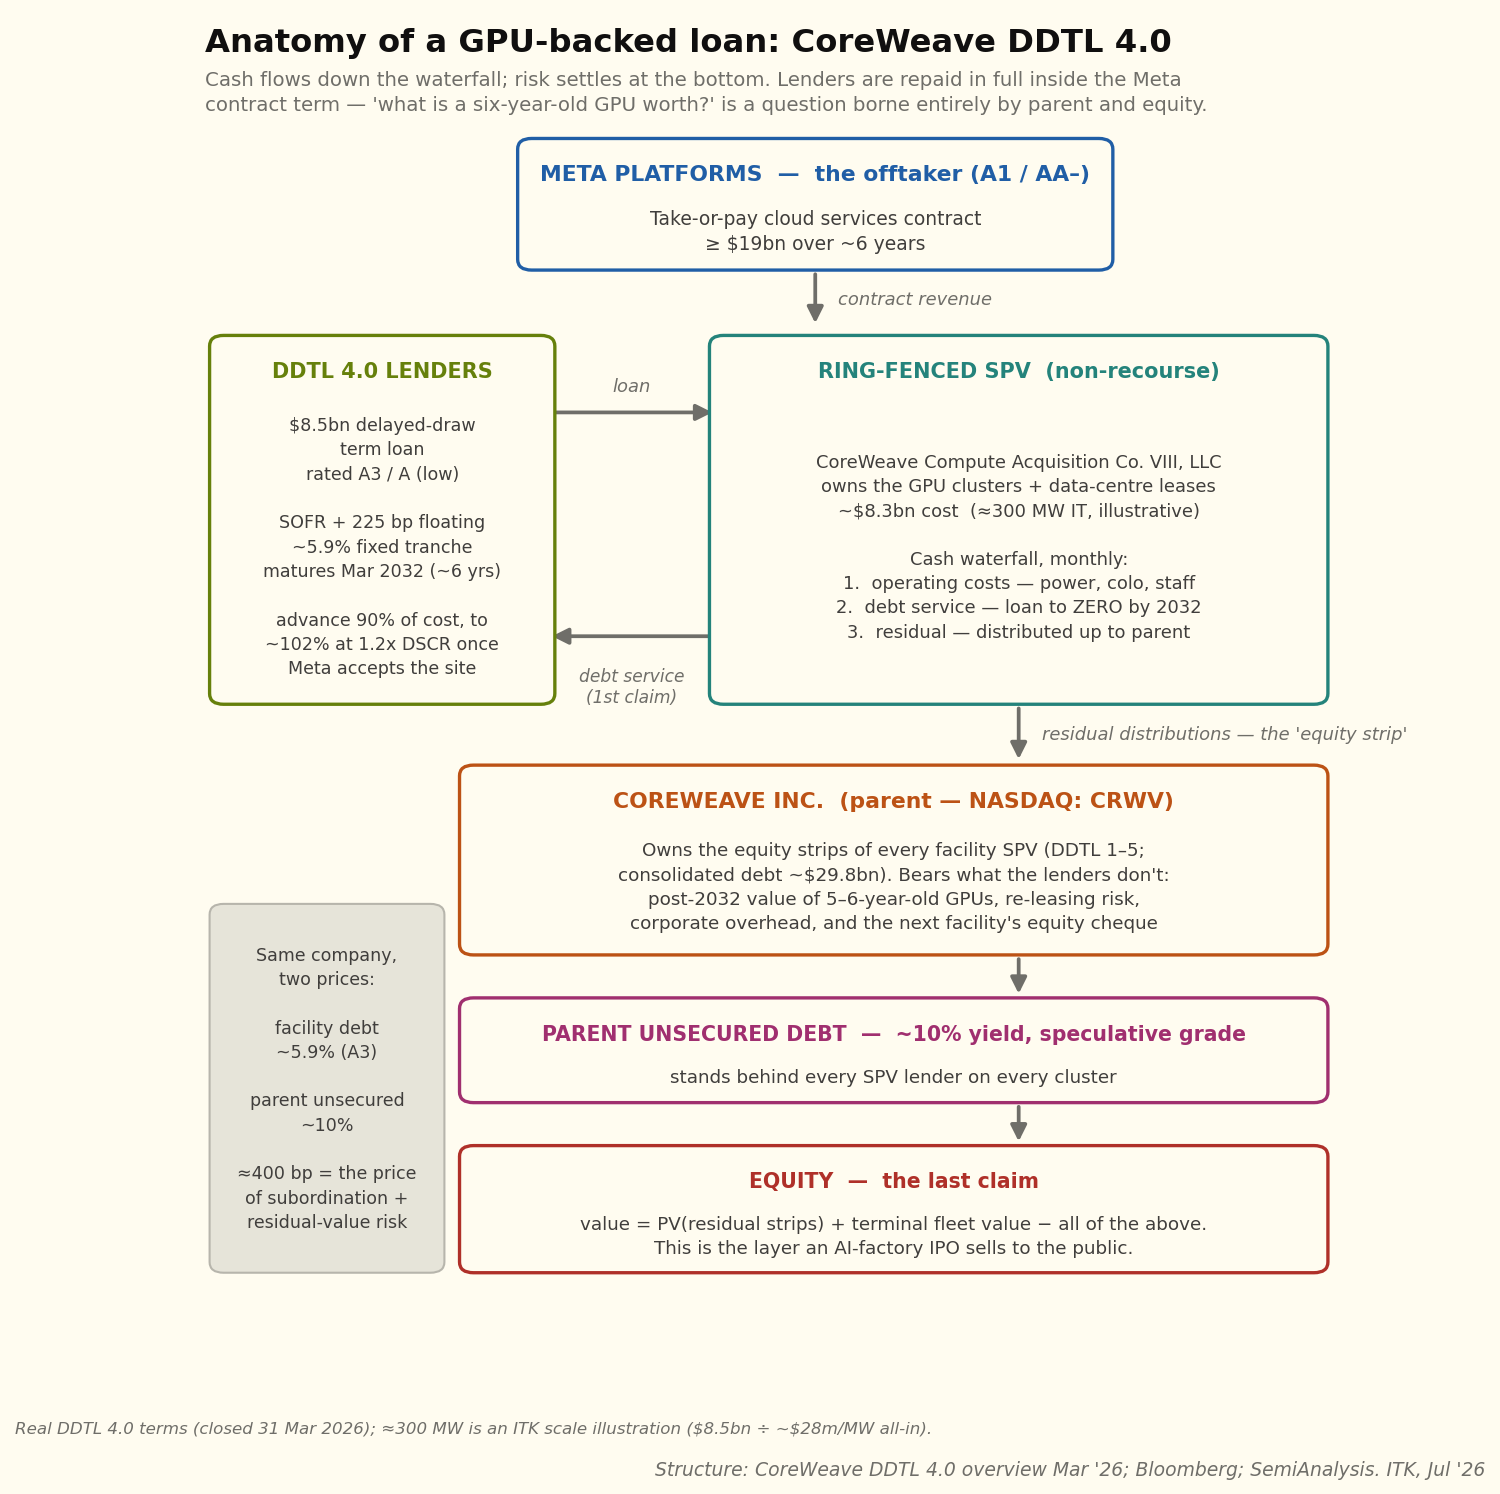
Converting the deal into value added for CoreWeave leaves a residual of US$4.5 bn:
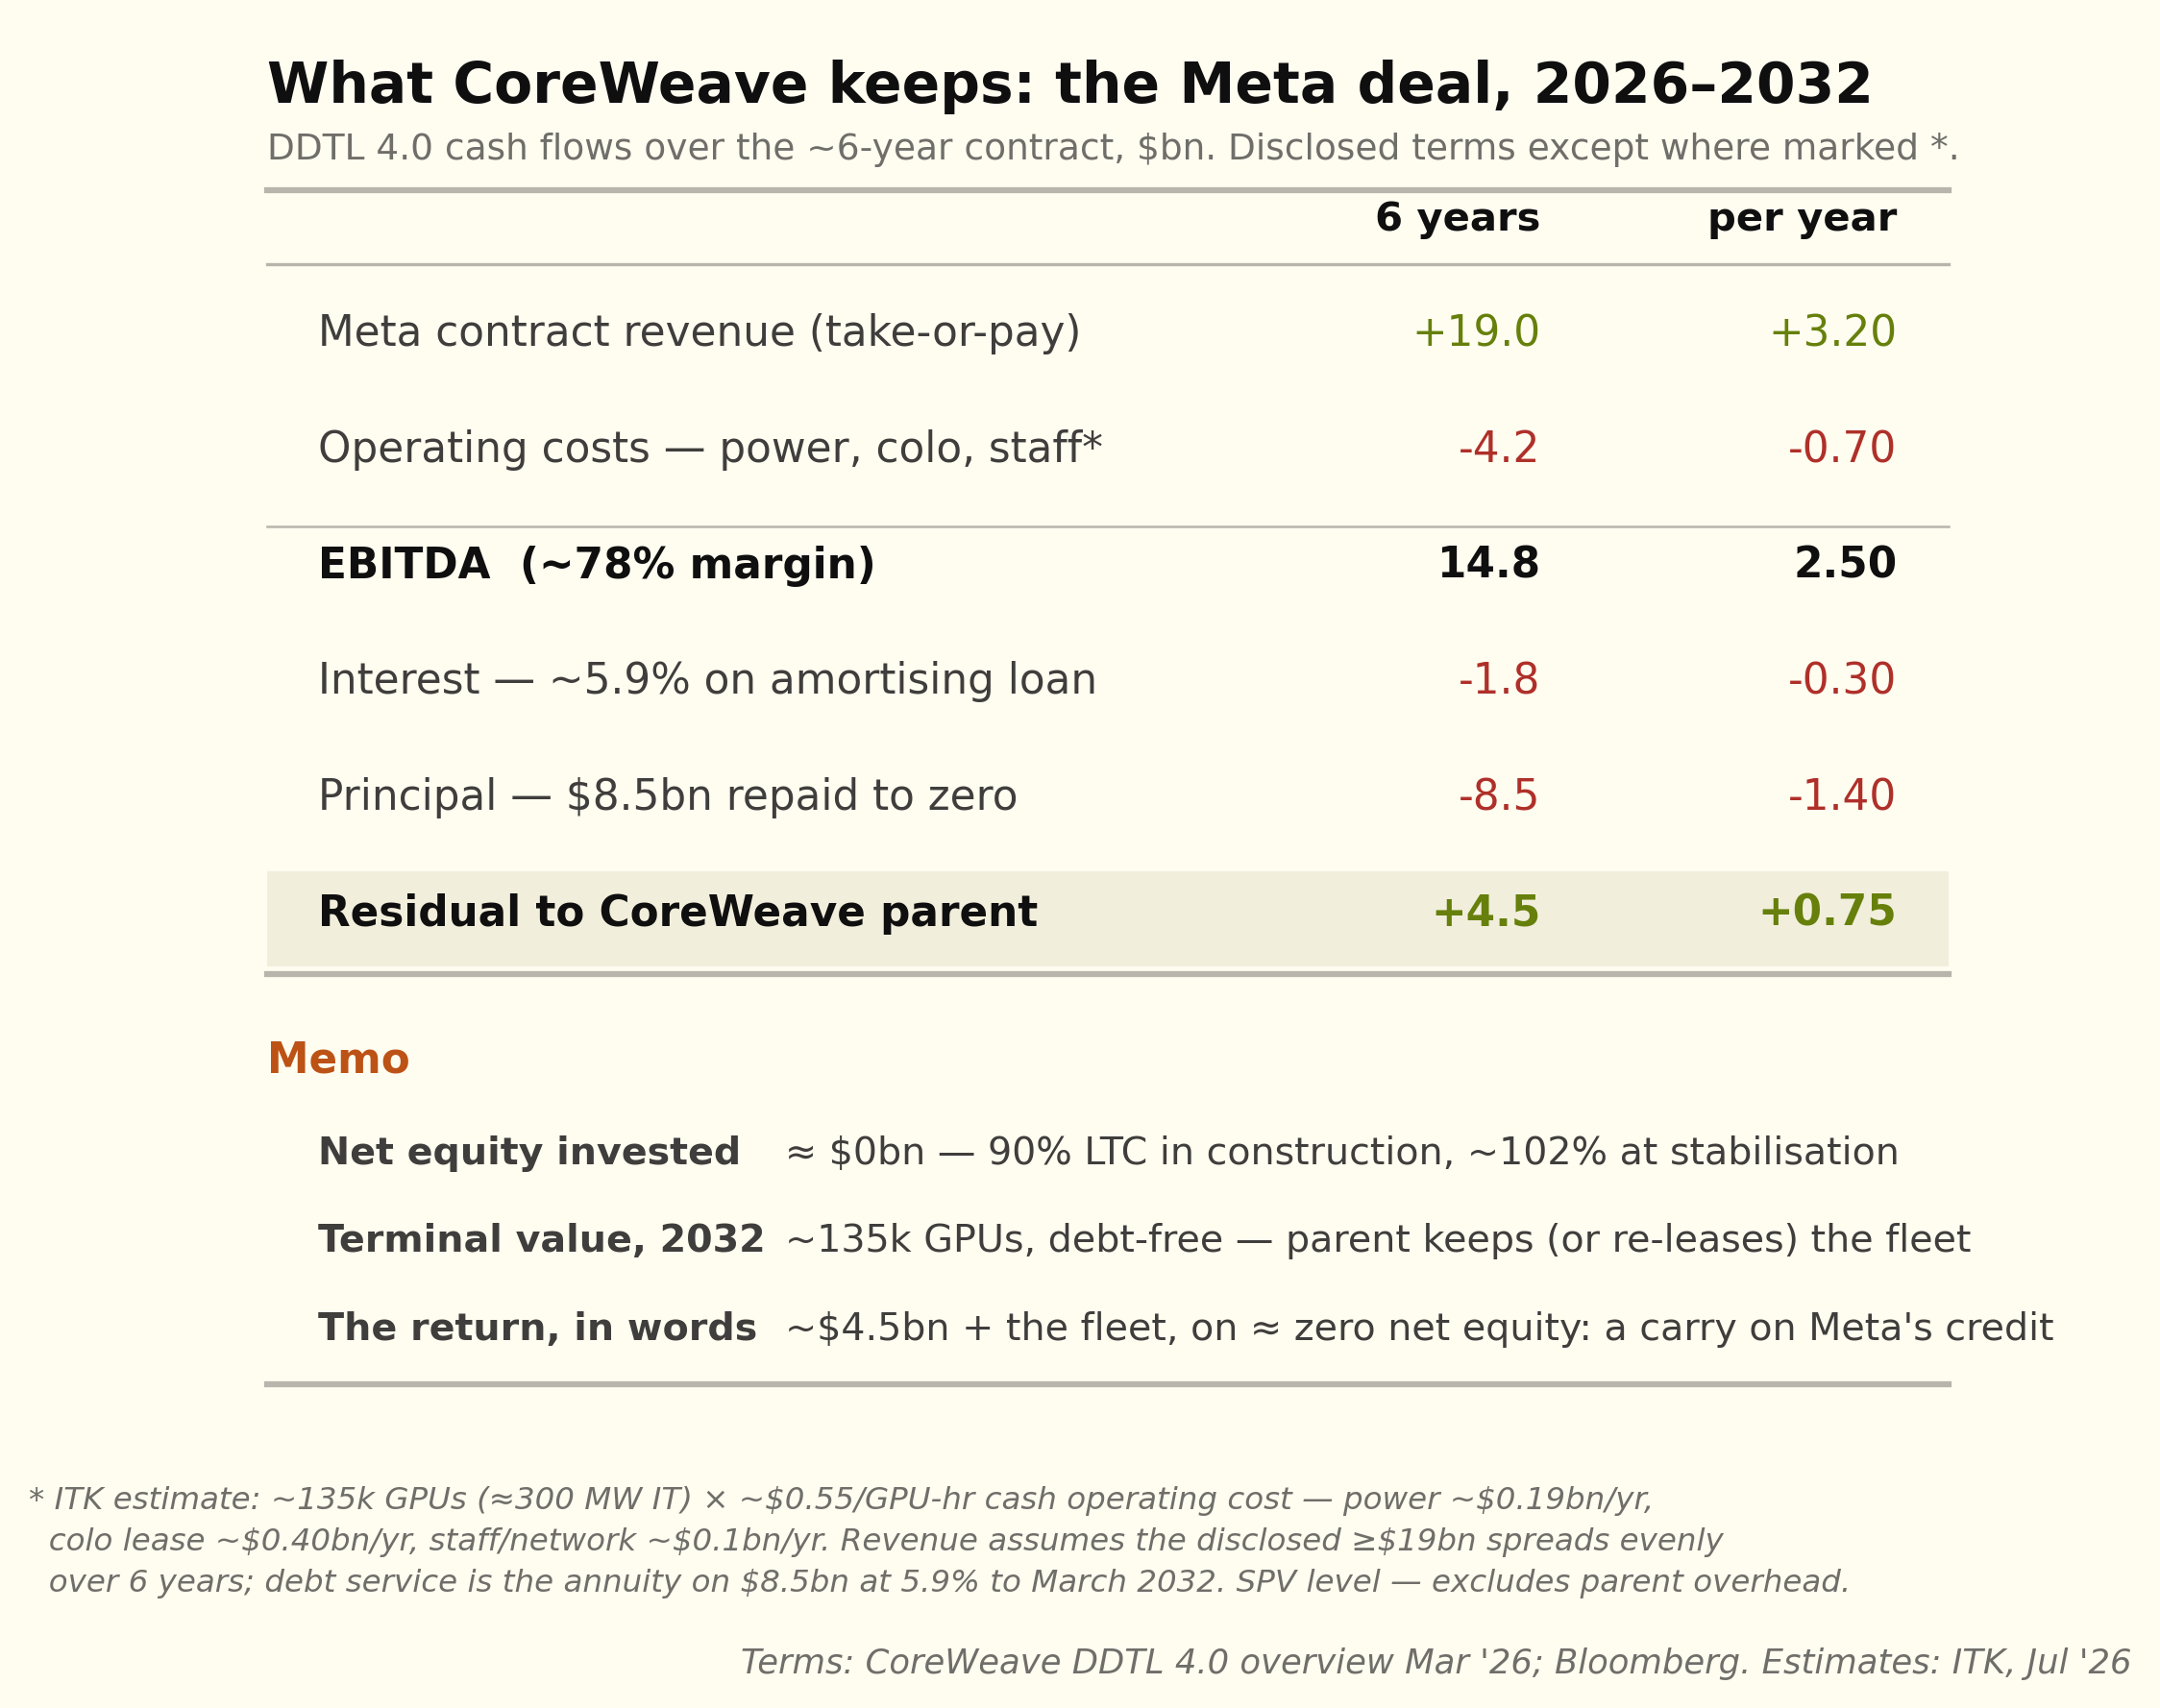
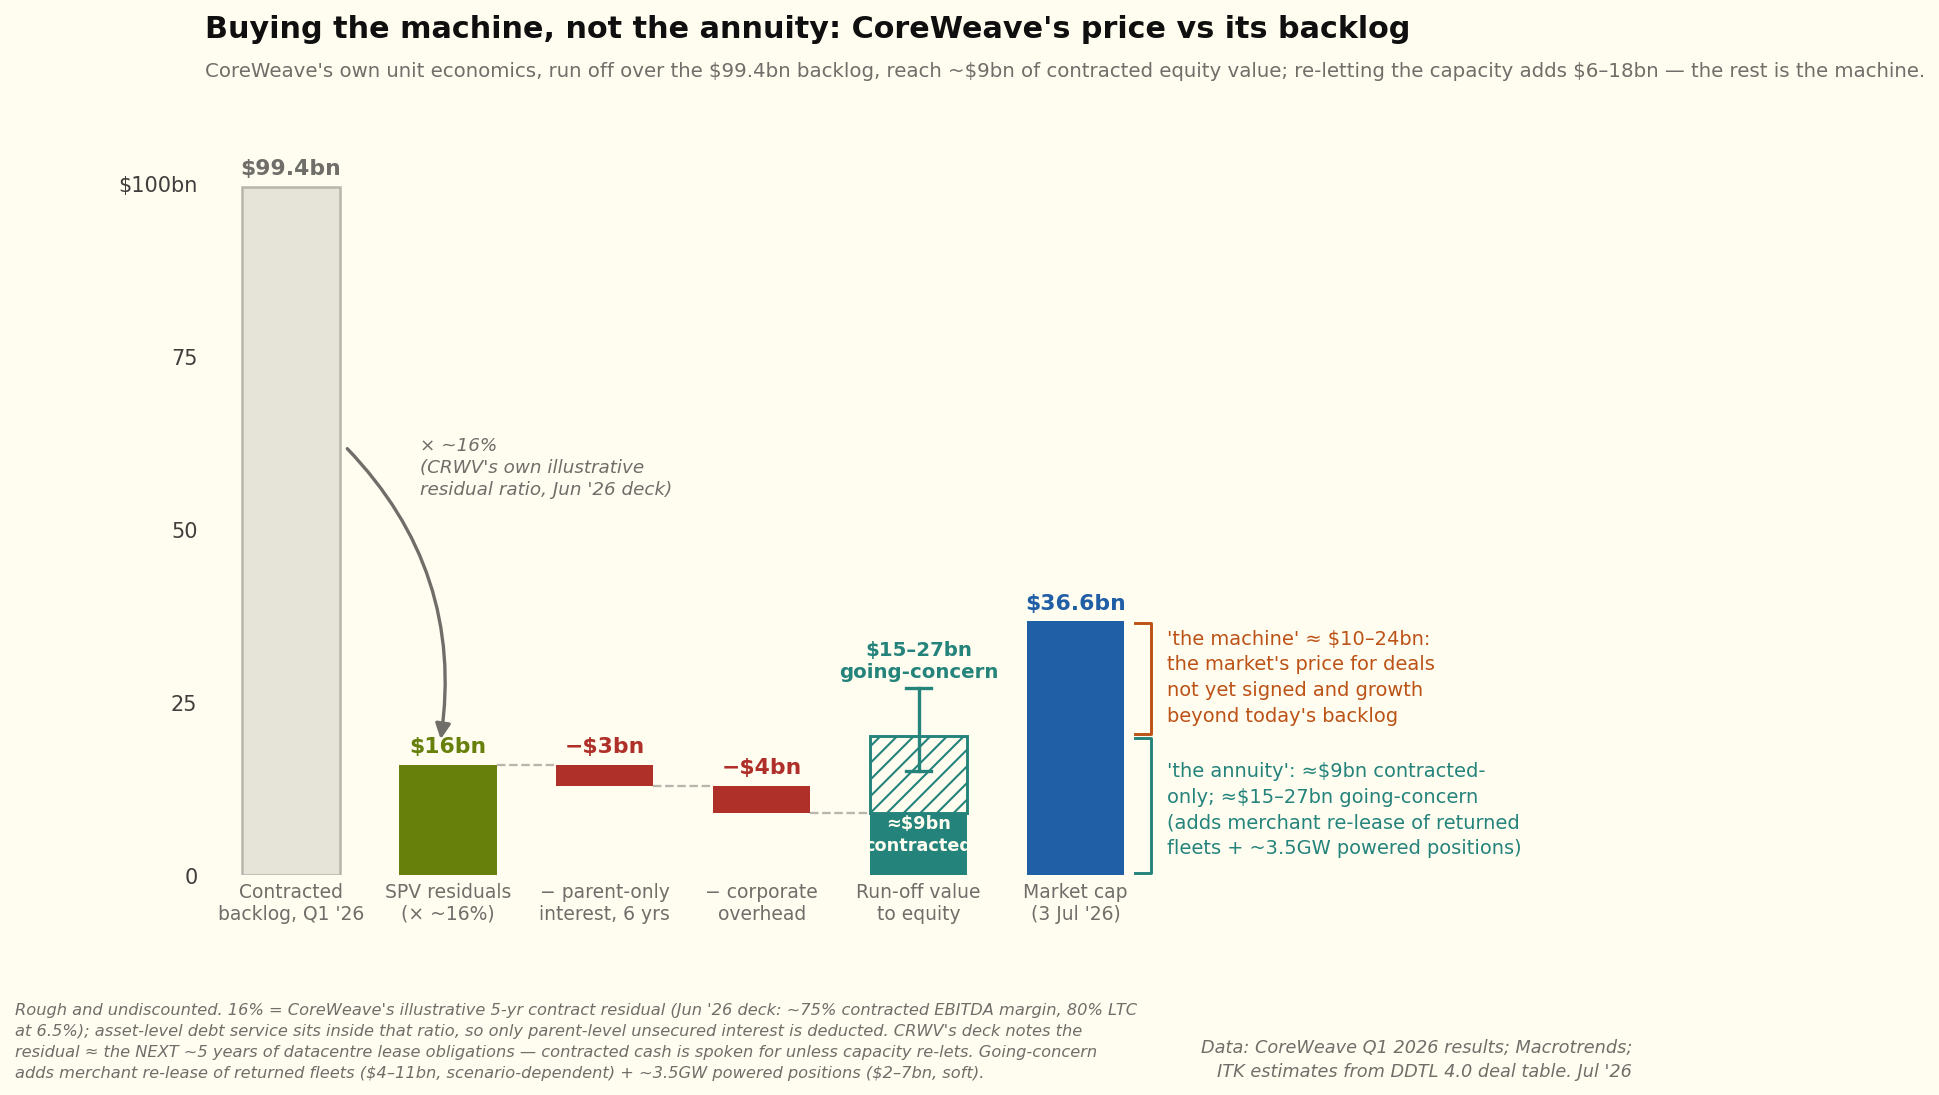
So a pretty good deal. However, even if the entirety of CoreWeave’s revenue book was structured on deals just as good, I estimate that around 50% of the market cap reflects the value of future business not yet written.
Firmus — Batam compared to CoreWeave
My understanding of the Batam deal is shown in the following three diagrams. First the structure:
Second the various Nvidia roles:
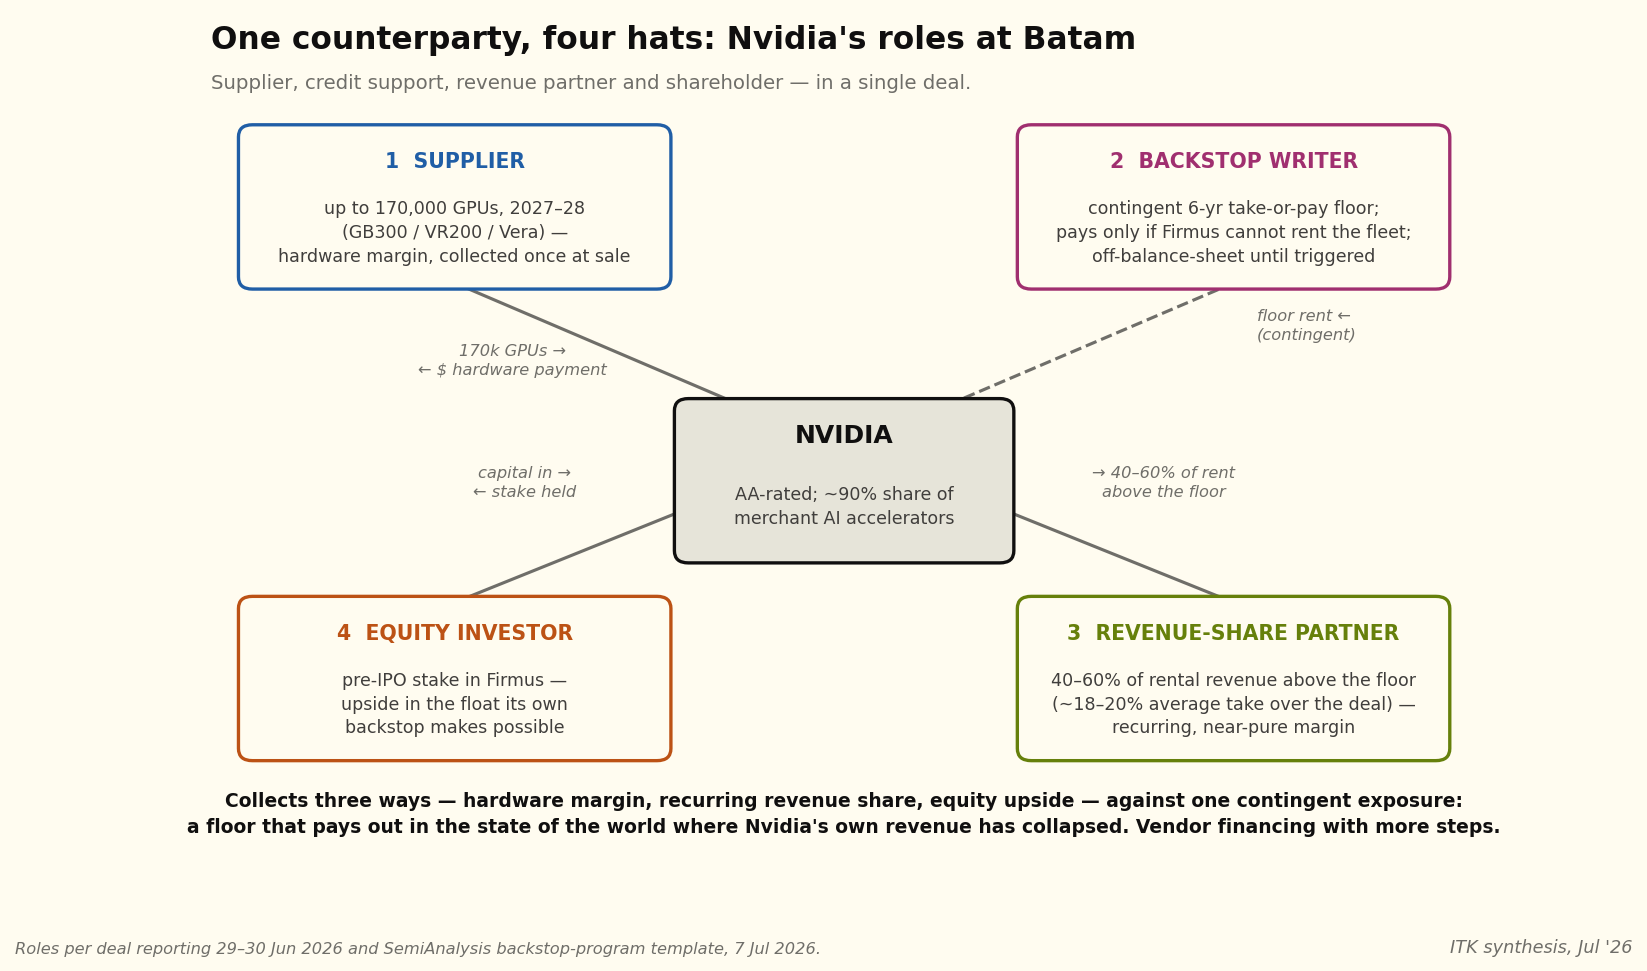
Note that on one view the Nvidia backstop is of low value to equity. It’s not that different to the value of a credit insurer during the housing loan crisis.
The value of any guarantee depends on the guarantor still being solvent on the day you need it. Nvidia’s floor under Firmus’s revenue is only ever called upon in one state of the world: GPU rents have collapsed because nobody wants to hire the fleet. But GPU rents collapsing is also the event that collapses Nvidia’s own sales, cash flow and share price — the guarantor and the guaranteed asset fail together, because they are the same bet. Compare the Meta contract behind CoreWeave’s deal: Meta’s ability to pay its compute bill doesn’t much depend on the price of compute — an advertising business stands behind the promise. Insurance is worth most when the insurer’s fortunes are unrelated to yours; it is worth least when you are, in effect, insured by your own supplier against the failure of the product he sold you.
Investors have seen this before: the monoline insurers and AIG wrote credit guarantees that were rated AAA right up until the housing losses they insured arrived — at which point the guarantors needed rescuing themselves. Nvidia’s balance sheet today is far stronger than AIG’s was, and the modelled exposure is small against it.
A Meta guarantee and a GPU crash are two different events; an Nvidia guarantee and a GPU crash are the same event.
Third a comparison of the revenues and costs to each party:
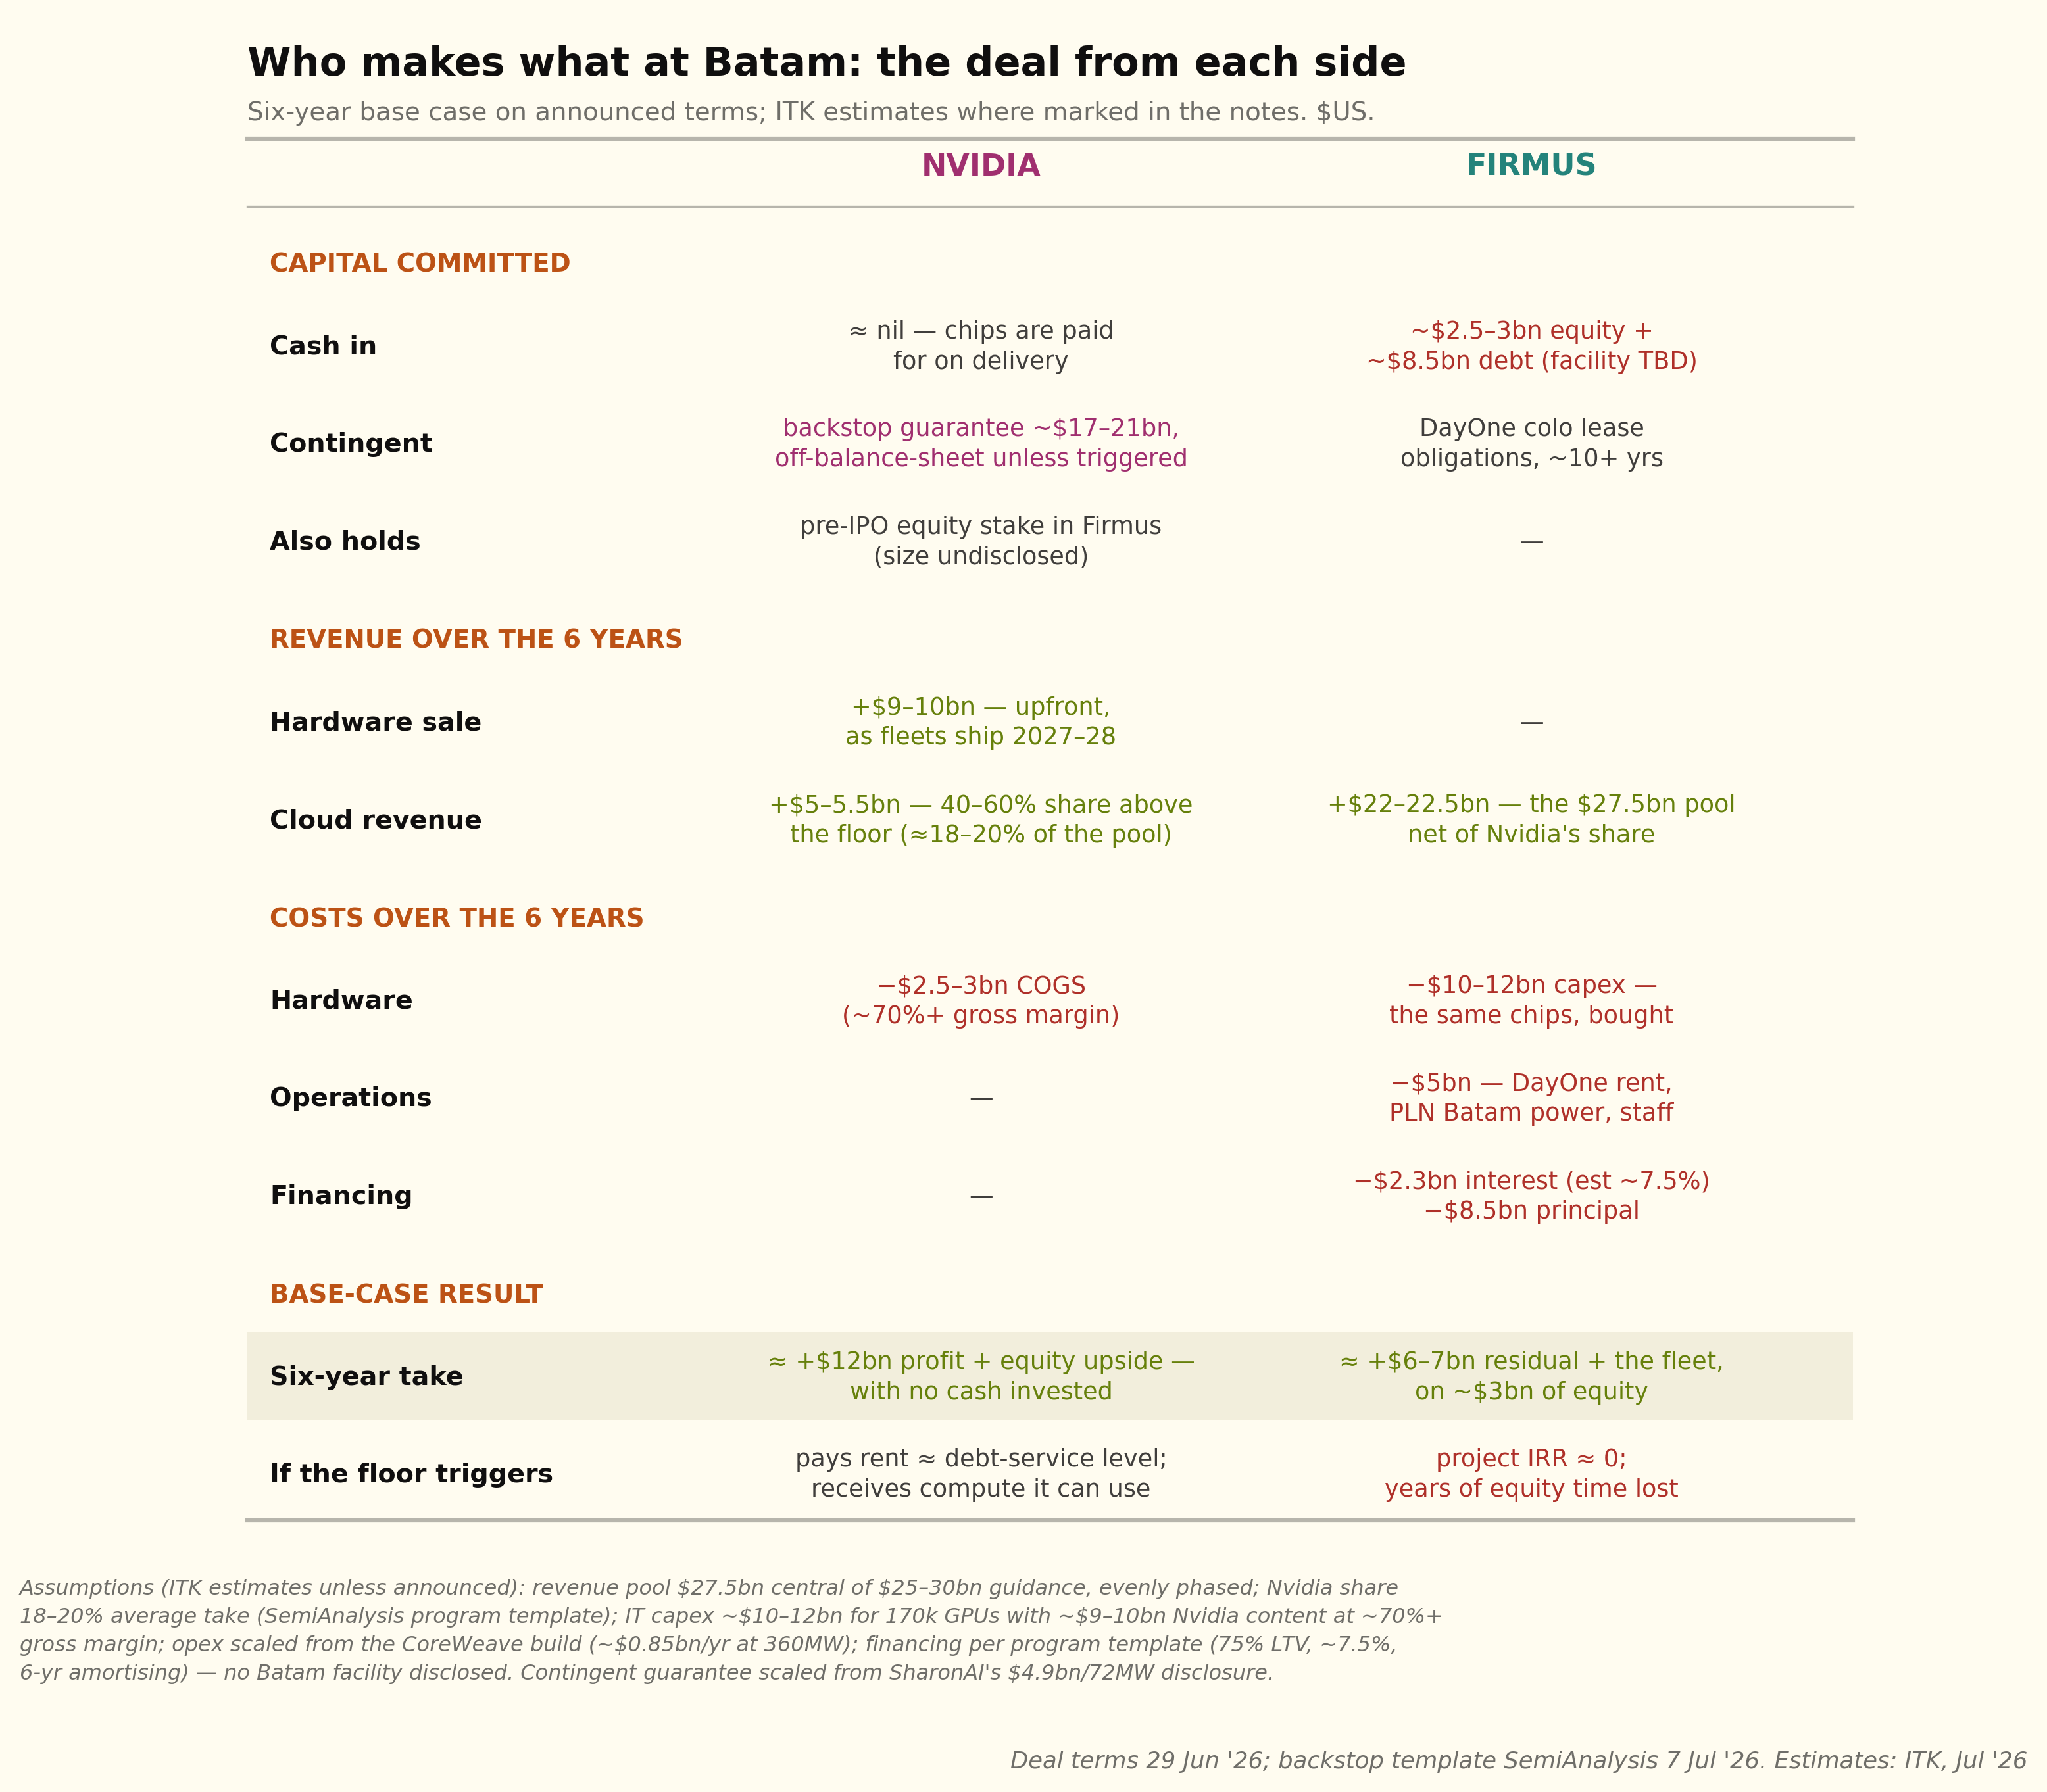
More risk, higher potential return: Batam compared to CoreWeave–Meta
The two are built on different prices. Meta’s ≥US$19bn over six years across roughly 135,000 GPUs implies about US$2.70 per GPU-hour at full utilisation — a wholesale discount, locked for the term, from an A1-rated counterparty.
Firmus’s US$25–30bn guidance across 170,000 GPUs implies about US$3.10 — roughly 15% more per GPU-hour, and US$12.7bn per gigawatt-year against Meta’s US$10.6bn.
CoreWeave sold certainty: one tenant, one locked price, no upside — and in exchange lenders funded effectively the whole project, so its ~US$4.5bn residual is earned on approximately no equity.
Firmus kept the market risk: a multi-tenant, short-tenor book it can reprice upward in a tight market, in exchange for ~US$3bn of equity at risk, a customer list that does not yet exist, and Nvidia taking 40–60% of whatever is earned above the floor.
On the base case the arithmetic favours Firmus equity — US$6–7bn of residual plus the fleet, against CoreWeave’s US$4.5bn — and per contract dollar the two keep almost the same share (23% and 24% respectively). The difference is that CoreWeave’s share is contracted and Firmus’s is forecast.
For me the two keys to Batam are: 1. The revenue contract tenor. At some point GPU supply is going to overtake demand and prices will fall. It’s certain, just a question of when. 2. How debt providers price the Batam debt.
Firmus in South Australia — energy commitment, but no data centre yet
Firmus has signed a 12-year deal for 600 MW of firm power to be supplied by Gunvor Group. Firmus plans up to 2.7 GW at Tailem Bend and Stirling North.
Just to be clear: based on CoreWeave and implied Batam capital costs, a data centre requiring 600 MW of power is likely to cost in excess of A$35 bn. Its fill would also absorb about 8% of current world GB300 production. Still, that supply is for post-2028, when there will be more global capacity and perhaps the capex shown in Table 7 will have moderated.
So you’ll excuse me if my advice is for South Australians not to get too excited just yet.
Table 7 — Indicative capital cost, 600MW AI campus (GB300-era prices)
| Layer | Basis | US$bn | A$bn |
|---|---|---|---|
| IT fill — ~285k GPUs, servers, networking | US$28–31m/MW (CoreWeave / Batam metrics) | 17–18.5 | 26–28 |
| Shell, cooling, power infrastructure | US$10–13m/MW, AI-class liquid-cooled | 6–8 | 9–12 |
| Total, first fill | ~23–26 | ~35–40 |
Source: ITK estimates from CoreWeave DDTL 4.0 (~US$28m/MW over ~300MW) and Firmus Batam (~US$28–33m/MW over 360MW); shell costs from ITK US data centre capex work. AUD at ~0.66. IT layer refreshes every ~5 years; range A$30–45bn depending on GPU generation and fill phasing.
Nevertheless no renewable energy or data centre announcement is complete without at least one associated battery.
In this case Greenpoint, a subsidiary of Equis, has reached financial close on the Koolunga 200 MW / 4-hour battery with the output sold to Gunvor. Gunvor is expected to use the battery as part of the data centre supply when that, eventually, kicks into action.
In addition the supply agreement allows for 220 hours of demand response (2.5% of hours per year).
I was going to analyse the implications of this deal for South Australia’s electricity market since 600 MW of flat load is roughly 40% of South Australia’s average operational demand. But I think I’d be getting ahead of myself. I’ll wait for the data centre FID announcement, no doubt to come in stages, before thinking about the power implications.
All that said, 600 MW of flat demand, the data centre capex and the required renewable investment are exciting — and much more credible than the Gupta GFG Bluescope debacle.
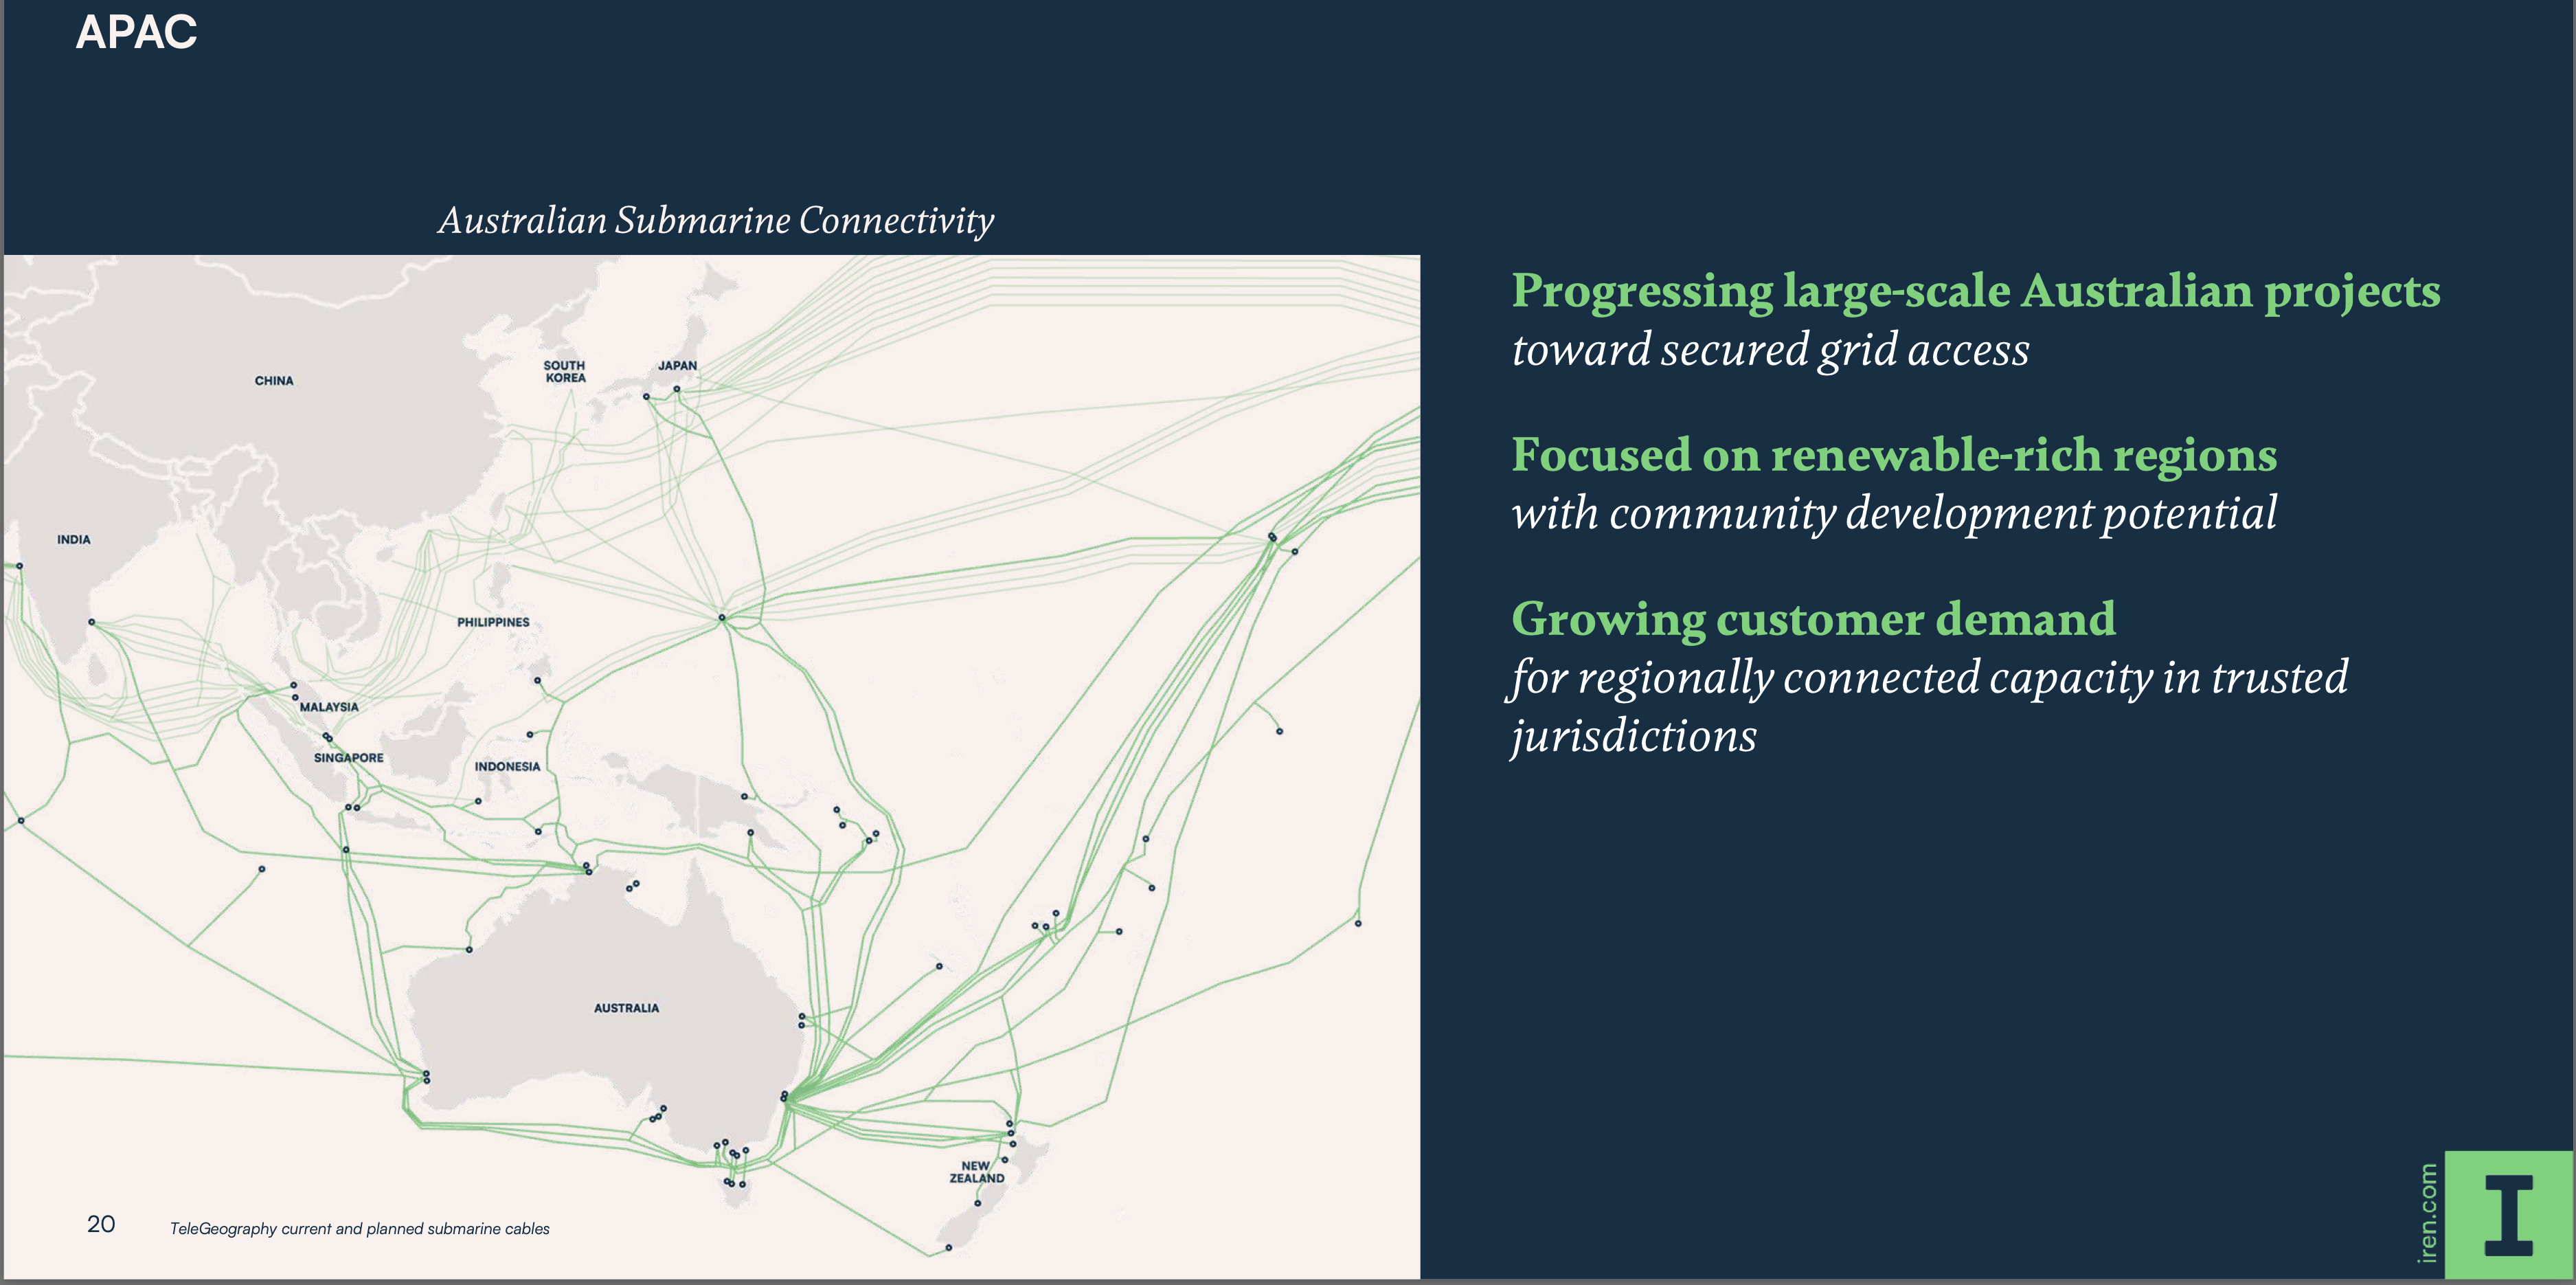
I include a screenshot from IREN’s latest quarterly presentation that shows the fibre optic connections — alongside power, connectivity is the other siting requirement. The map shows only the routes to the coastal capitals; there are inland routes as well. As you would expect connections to South Australia are limited at present.
Investor watch list
Ordered by how much each item would move the view, most to least.
- Hyperscaler token prints — Google (I/O and quarterly CEO remarks), Microsoft Foundry, Meta. Two consecutive prints below ~4x year-on-year confirm deceleration on schedule and bring the supply-demand crossover forward; prints holding ~7x+ delay it.
- GPU rental prices — SemiAnalysis index, monthly (H100 1-yr contract; B200 composite). The market thermometer for the whole thesis. H100 1-yr resuming its decline while B200 falls toward it says supply is catching up; both rising says shortage persists. The end-state test: old-generation rates converging toward cash cost (~$0.60–0.90/hr).
- First rated backstopped debt — a Batam (or any Nvidia-backstopped) facility priced in public or reported markets. The market’s verdict on a vendor floor as credit support, bracketed by CoreWeave’s benchmarks: A3 / SOFR+225 (hyperscaler offtake) vs Ba2 / +450 (non-IG book).
- METR task-horizon curve — metr.org/time-horizons, quarterly. The leading indicator for demand duration. Doubling time holding at ~3–4 months means new problem classes (and revenue) keep arriving and deceleration gets postponed; the curve bending is the first reliable sign the demand story matures.
- Hyperscaler capex guidance — quarterly earnings, Big-5. A pause or cut from any of the five flips the market from shortage to surplus within quarters, faster than any supply-side signal.
- Contract tenor drift — deal announcements. Whether the SpaceX 90-day-cancellation form spreads (worse for GPU debt everywhere), and the specific tell: Meta or SpaceX signing away compute long-term without claw-back rights signals the frontier-lab ambitions behind their capex are being shelved.
- The CoreWeave credit complex — parent unsecured yield (~10%) vs facility spreads (+225); DDTL 5.0 secondary prices (the first publicly traded GPU-backed paper). Compression of the ~400bp gap means the market is re-rating platform/residual risk — the single best proxy for how an ASX market should value Firmus’s equity layer.
- Nvidia backstop flow — new program deals, and any invocation anywhere. Volume of new backstops tracks how dependent the buildout is on vendor support.
Limitations of amateur research
Disclaimer: I am working on my own, absolutely zero exposure to Firmus management, have not attended any investor briefings or any pre-deal investor education roadshow.
This note likely contains both factual and opinion errors. It’s published on a read-it-for-your-own-interest basis and was written to help me personally come to an understanding of data centre economics and particular deals. As I am not being paid it’s an amateur’s note. No-one should rely on anything in this note other than that it certainly will contain typos.