Fortescue’s Pilbara electrification
Fortescue has taken a number of expensive “space cadet” wrong directions in its decarbonisation journey, principally around hydrogen. But on a reasonable set of numbers Pilbara electrification and in particular electrification of diesel trucks looks like it could deliver a close to 16% pretax IRR. ITK expects the Chinese suppliers will price well below normal — it’s a big market and Fortescue can serve as the showcase project. So I’ve used two sets of capex numbers. Some very, very low numbers implied from the most recent Fortescue press release and some more, but not necessarily sufficiently, conservative numbers. It’s the conservative numbers in the headline table. Our estimated savings are at the top end of the range mentioned by FMG but essentially consistent. For a desktop study it’s a reasonable result. More due diligence would no doubt result in more conservative estimates.
It’s the trucks that justify the project economics. The other uses of the solar and wind to replace existing gas generation and avoid new gas generation are nice to have but would struggle to earn IRR. But the truck electrification benefits appear to be excellent. There is also an interesting competition between in-truck batteries and battery swap. In this application I expect battery swap to be the winner.
More detail on these numbers is provided below. For me the two key risks are the wind turbines used, not really commercially tried and tested particularly in high wind conditions or as to actual cost, and the Iron Bridge magnetite scale up, already well over budget and years behind schedule. And I could easily be underestimating the transmission capex but it’s still unlikely to change the overall economics materially. The numbers in the above table are not this year’s diesel costs. The payback is far better at current diesel costs but then the project will take until 2030 to complete.
$4 bn of wind, solar, battery and transmission capex
Fortescue is building 1.2 GW of solar and 0.6 GW of wind, and maybe another 190 km of transmission and some batteries at a total cost of at least A$4 bn to:
- Replace about 13 PJ of gas consumed in Hematite processing, magnetite processing, Port, and other operations. In total that’s between 300 and 350 MW of demand on my estimates. This is a relatively low IRR project in the absence of a carbon cost and will eventually strand a gas pipeline and the Solomon power station. Or at least reduce them to standby.
- A much higher IRR truck electrification program. ITK estimates that if the electric trucks cost roughly the same as diesel trucks (I used higher capex than that), until recently a laughable assumption, but no longer, then given an electricity cost of maybe A$95/MWh and diesel delivered cost net of rebate at around A$157/l then the cash savings are in the order of $0.5 bn per year. Those electricity prices depend on a few optimistic assumptions.
- In the process of electrification Fortescue will have the chance to improve the economics of its troubled Magnetite plant, plagued by water pipeline leaks and more worrying air separation opex issues. The Magnetite plant (Iron Bridge) uses novel dry rolling instead of wet crushing. As with many a new process it hasn’t gone smoothly (particularly the dry ore has been highly abrasive on the air separation circuit media) and so capital costs increased from US$1.9 bn to over US$4 bn requiring a book value write-down, and output for a plant announced in 2019 remains far below capacity and is not currently scheduled to hit full capacity until 2028.
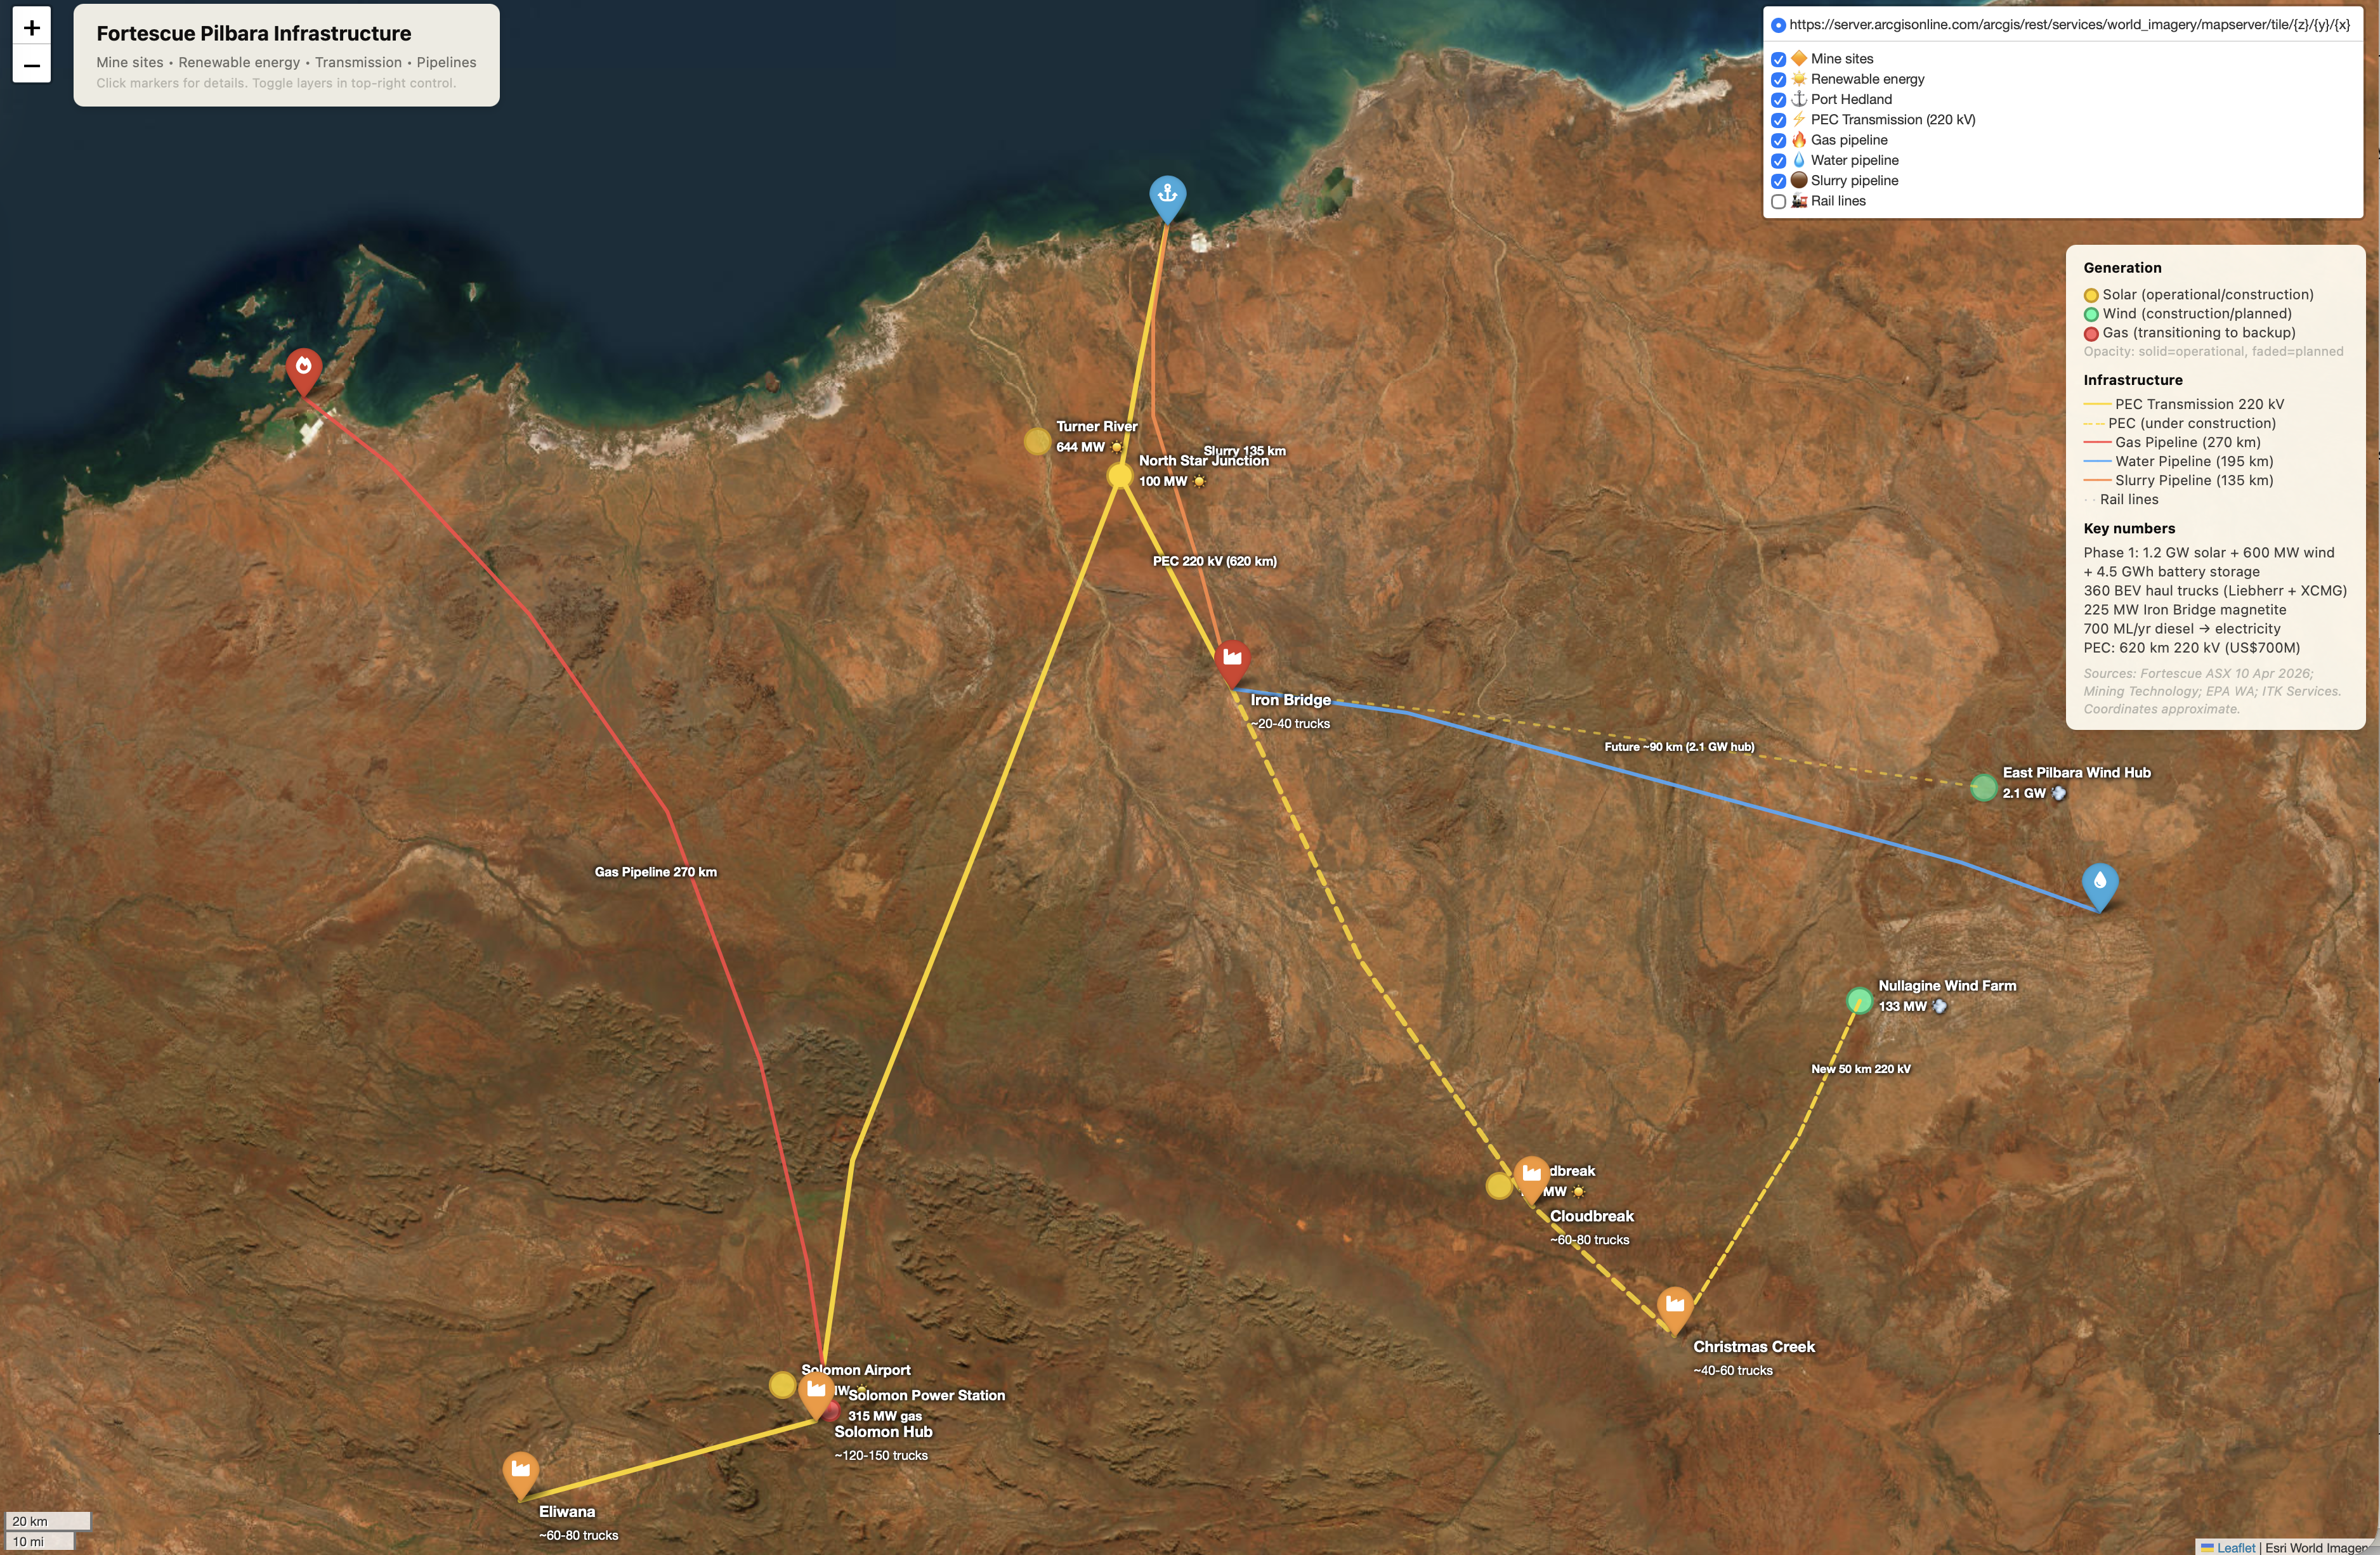
The map below shows the scale of the Pilbara operations and the distances involved.
Demand 530 MW all up
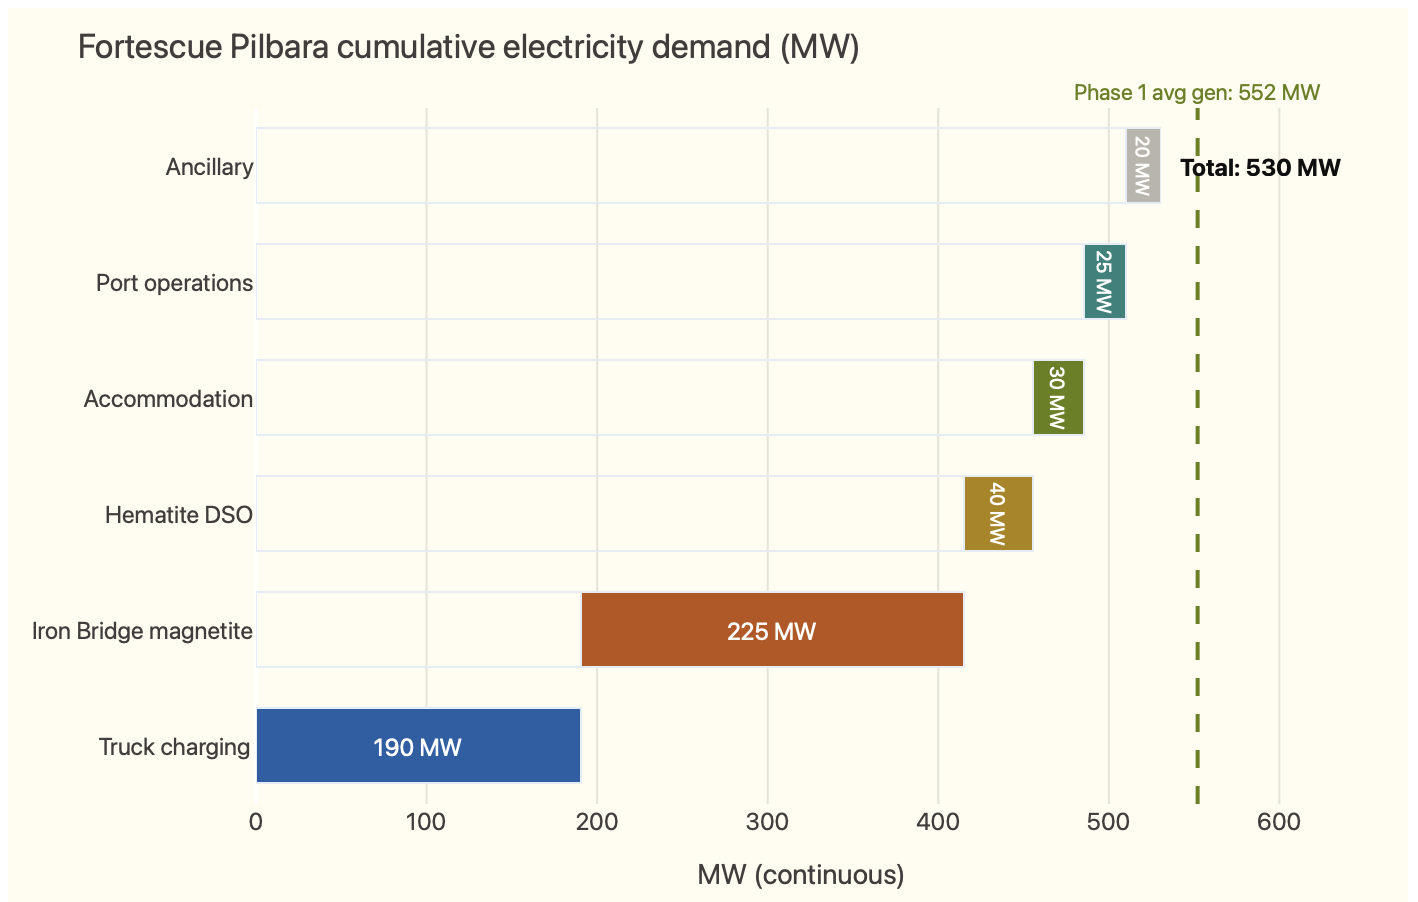
All of the electricity demand already exists other than the truck charging. The accommodation for 10,000 people, port and ancillary are both full-on seat-of-the-pants estimates and incidental to the main story. The Iron Bridge demand is at full capacity. Fortescue has still not proved the novel dry process is capable of reaching full capacity.
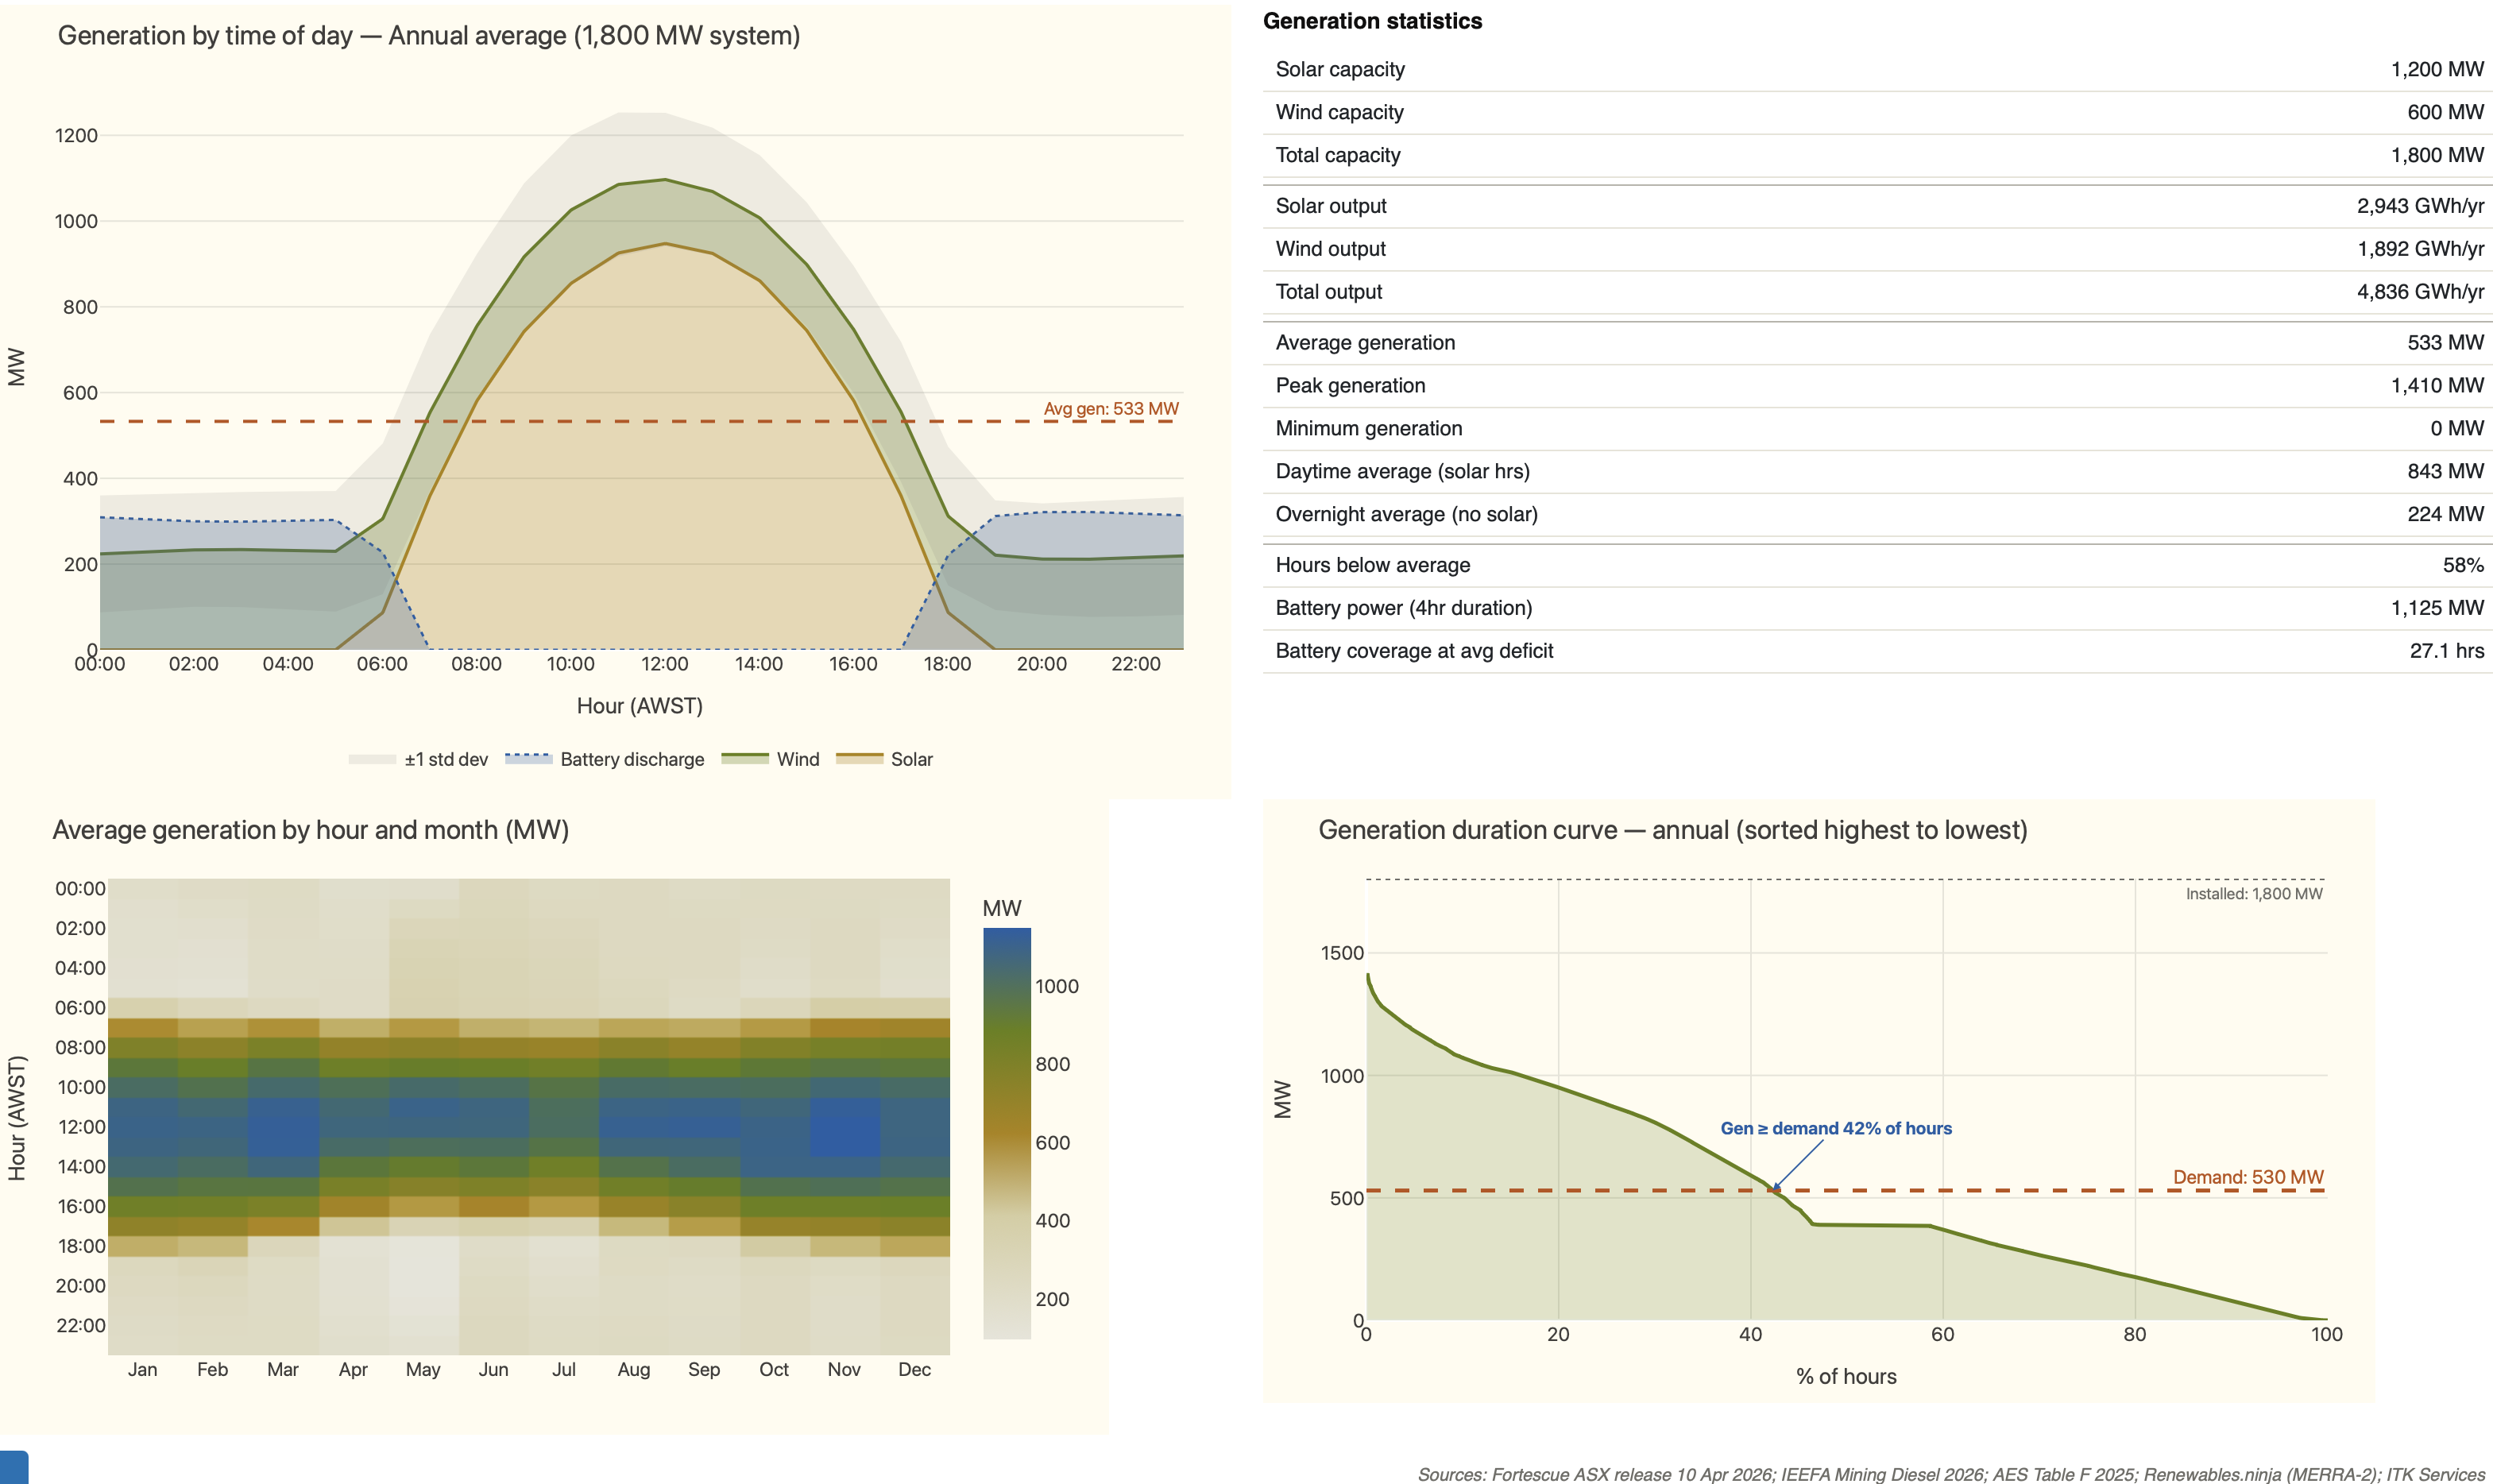
The new generation system
A summary of the generation system is:
Most of the existing supply comes from the 315 MW Solomon Power Station, which consists of gas reciprocating engines supplied by the 270 km Fortescue River Gas Pipeline. The pipeline delivers around 15 PJ per year, which at $8/GJ costs say A$130 m a year. The gas cost might be less. In addition from 2025 there is the fully commissioned 100 MW North Star Junction solar farm. I used the renewables-ninja system synthetic wind profiles with standard 6 MW turbines to get a wind profile. Only one year of weather data was provided, but should do for this purpose. The gas system will no doubt remain for backup.
It can be seen that on an average day there are long periods where even with the battery, supply falls below demand. However for an average day this is overcome by adding more swap packs into the system than are strictly needed.
Average day supply and demand balance
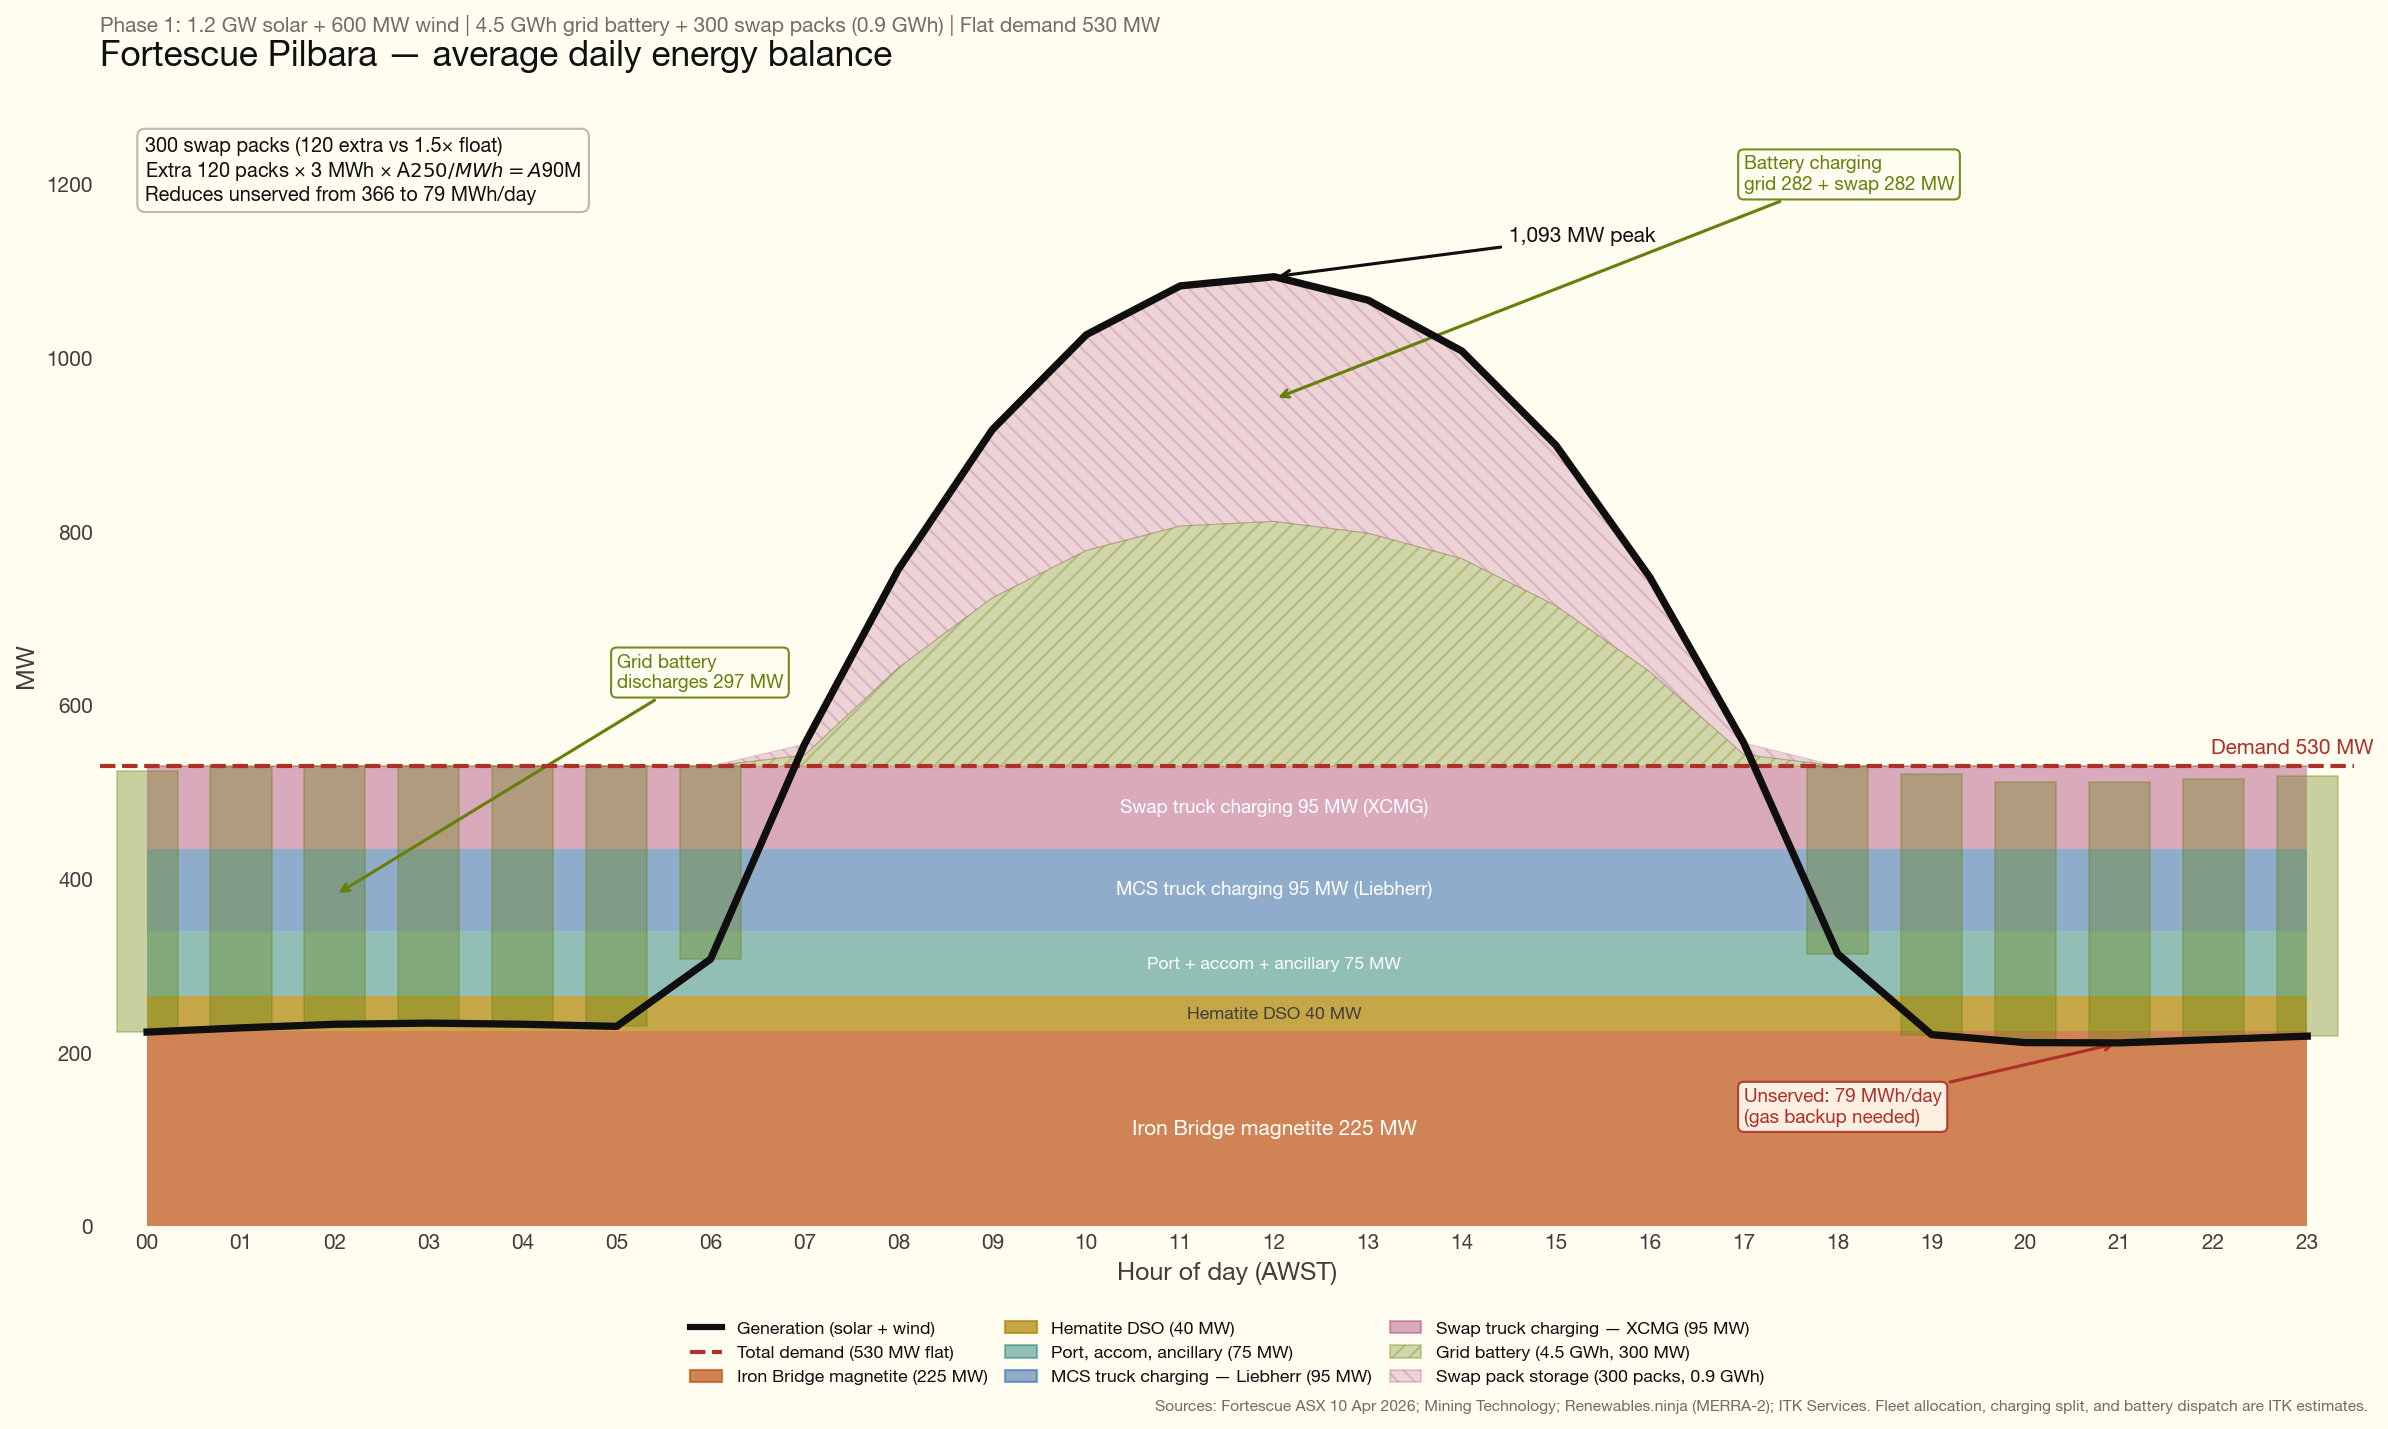
Note this is very much the average day. Wind output varies quite a lot as can be seen in the generation system figure above. Gas will supply the missing output. At the moment the assumption is that surplus generation is spilled.
Diesel electrification
The overall picture is very simple. It costs a lot less to run a truck on electricity for an hour than it does on diesel.
In chapter and verse…
The Diesel Baseline
Fortescue consumes approximately 700 million litres of diesel per year across its Pilbara operations, making it one of Australia’s largest diesel consumers. This diesel is delivered by ship from Singapore to Port Hedland, then road-tankered 145–450 km to mine sites. Every 10 cpl movement in diesel prices has a ~$70M impact on operating costs.
Delivered diesel cost (net of Fuel Tax Credit):
| Scenario | Delivered price | Net of FTC (52.6 cpl) | Annual cost (700 ML) |
|---|---|---|---|
| Normal market | $1.80–2.10/L | $1.27–1.57/L | A$890–1,100M |
| Current crisis (Hormuz) | $3.20–3.50/L | $2.67–2.97/L | A$1,870–2,080M |
Sources: AIP terminal gate prices; (Campbell, 2024); Fortescue sensitivity disclosure ($70M per 10 cpl).
The diesel goes almost entirely into the mining fleet — haul trucks (60–70%), excavators and loaders (15–20%), drill rigs, dozers, water carts, and graders (~15–20%). Processing plants, conveyors, and accommodation are already electrically powered.
Fleet Composition by Mine Site
Fortescue has ordered 360 battery-electric haul trucks from two suppliers — Liebherr (T264 BEV) and XCMG (XDE240 BEV) — plus 100+ ancillary electric vehicles (Fortescue Ltd, 2024a, 2024b; International Mining, 2025).
The allocation across sites is not publicly disclosed. The following estimates are based on relative production volumes, pit complexity, and haul distances:
Table: Estimated fleet and charging infrastructure by mine site
| Mine site | Production (Mtpa) | Est. trucks | Charging model | Est. chargers or swap bays | Est. infra cost |
|---|---|---|---|---|---|
| Solomon Hub (Firetail + Kings) | ~70 | 120–150 | MCS + swap | 18–22 chargers + 1–2 swap stations | US$100–140M |
| Cloudbreak / Christmas Creek | ~60 | 100–120 | MCS + swap | 15–18 chargers + 1–2 swap stations | US$85–120M |
| Eliwana | ~30 | 60–80 | MCS (first BEV trials here) | 9–12 chargers | US$45–65M |
| Iron Bridge | ~22 | 20–40 | Swap (shorter hauls) | 1 swap station | US$15–25M |
| Rail, port, ancillary | — | 60+ ancillary | Depot charging | Various | US$30–50M |
| Total | ~190 | ~360 trucks + 100+ ancillary | US$275–400M |
Note: Truck allocations are ITK estimates based on production volumes and material movement. Charging infrastructure costs from McKinsey (US$700k–1M per truck) and ICMM/Mining3 benchmarks.
Truck Economics
The following are just internet search estimates. As with the rest of this note no humans were interviewed. Traditional due diligence it definitely is not. The capital costs are sheer guesses and might reflect actual or introductory prices and/or be wrong.
Table: 240-tonne class haul truck comparison
| Specification | Cat 793F (diesel) | Liebherr T264 BEV | XCMG XDE240 BEV |
|---|---|---|---|
| Payload (tonnes) | 227 | 240 | 230 |
| Engine/motor power (kW) | 1,976 | 3,200 (peak) | 1,865 |
| Battery capacity (MWh) | — | 3.2 | Not disclosed (BYD Blade LFP) |
| Fuel/energy consumption | 137–182 L/hr diesel | ~86% lower cost/tonne | Not disclosed |
| Charging method | Refuel ~15 min | 6 MW MCS (~30 min) | Battery swap (~15 min) |
| Purchase price (est.) | ~US$5–6M | ~US$6–8M | ~US$3–4.5M |
Sources: Cat 793F OEM specifications; Liebherr T264 product data; LECTURA specs (XCMG XDE240); (Fortescue Ltd, 2024a) (implied pricing).
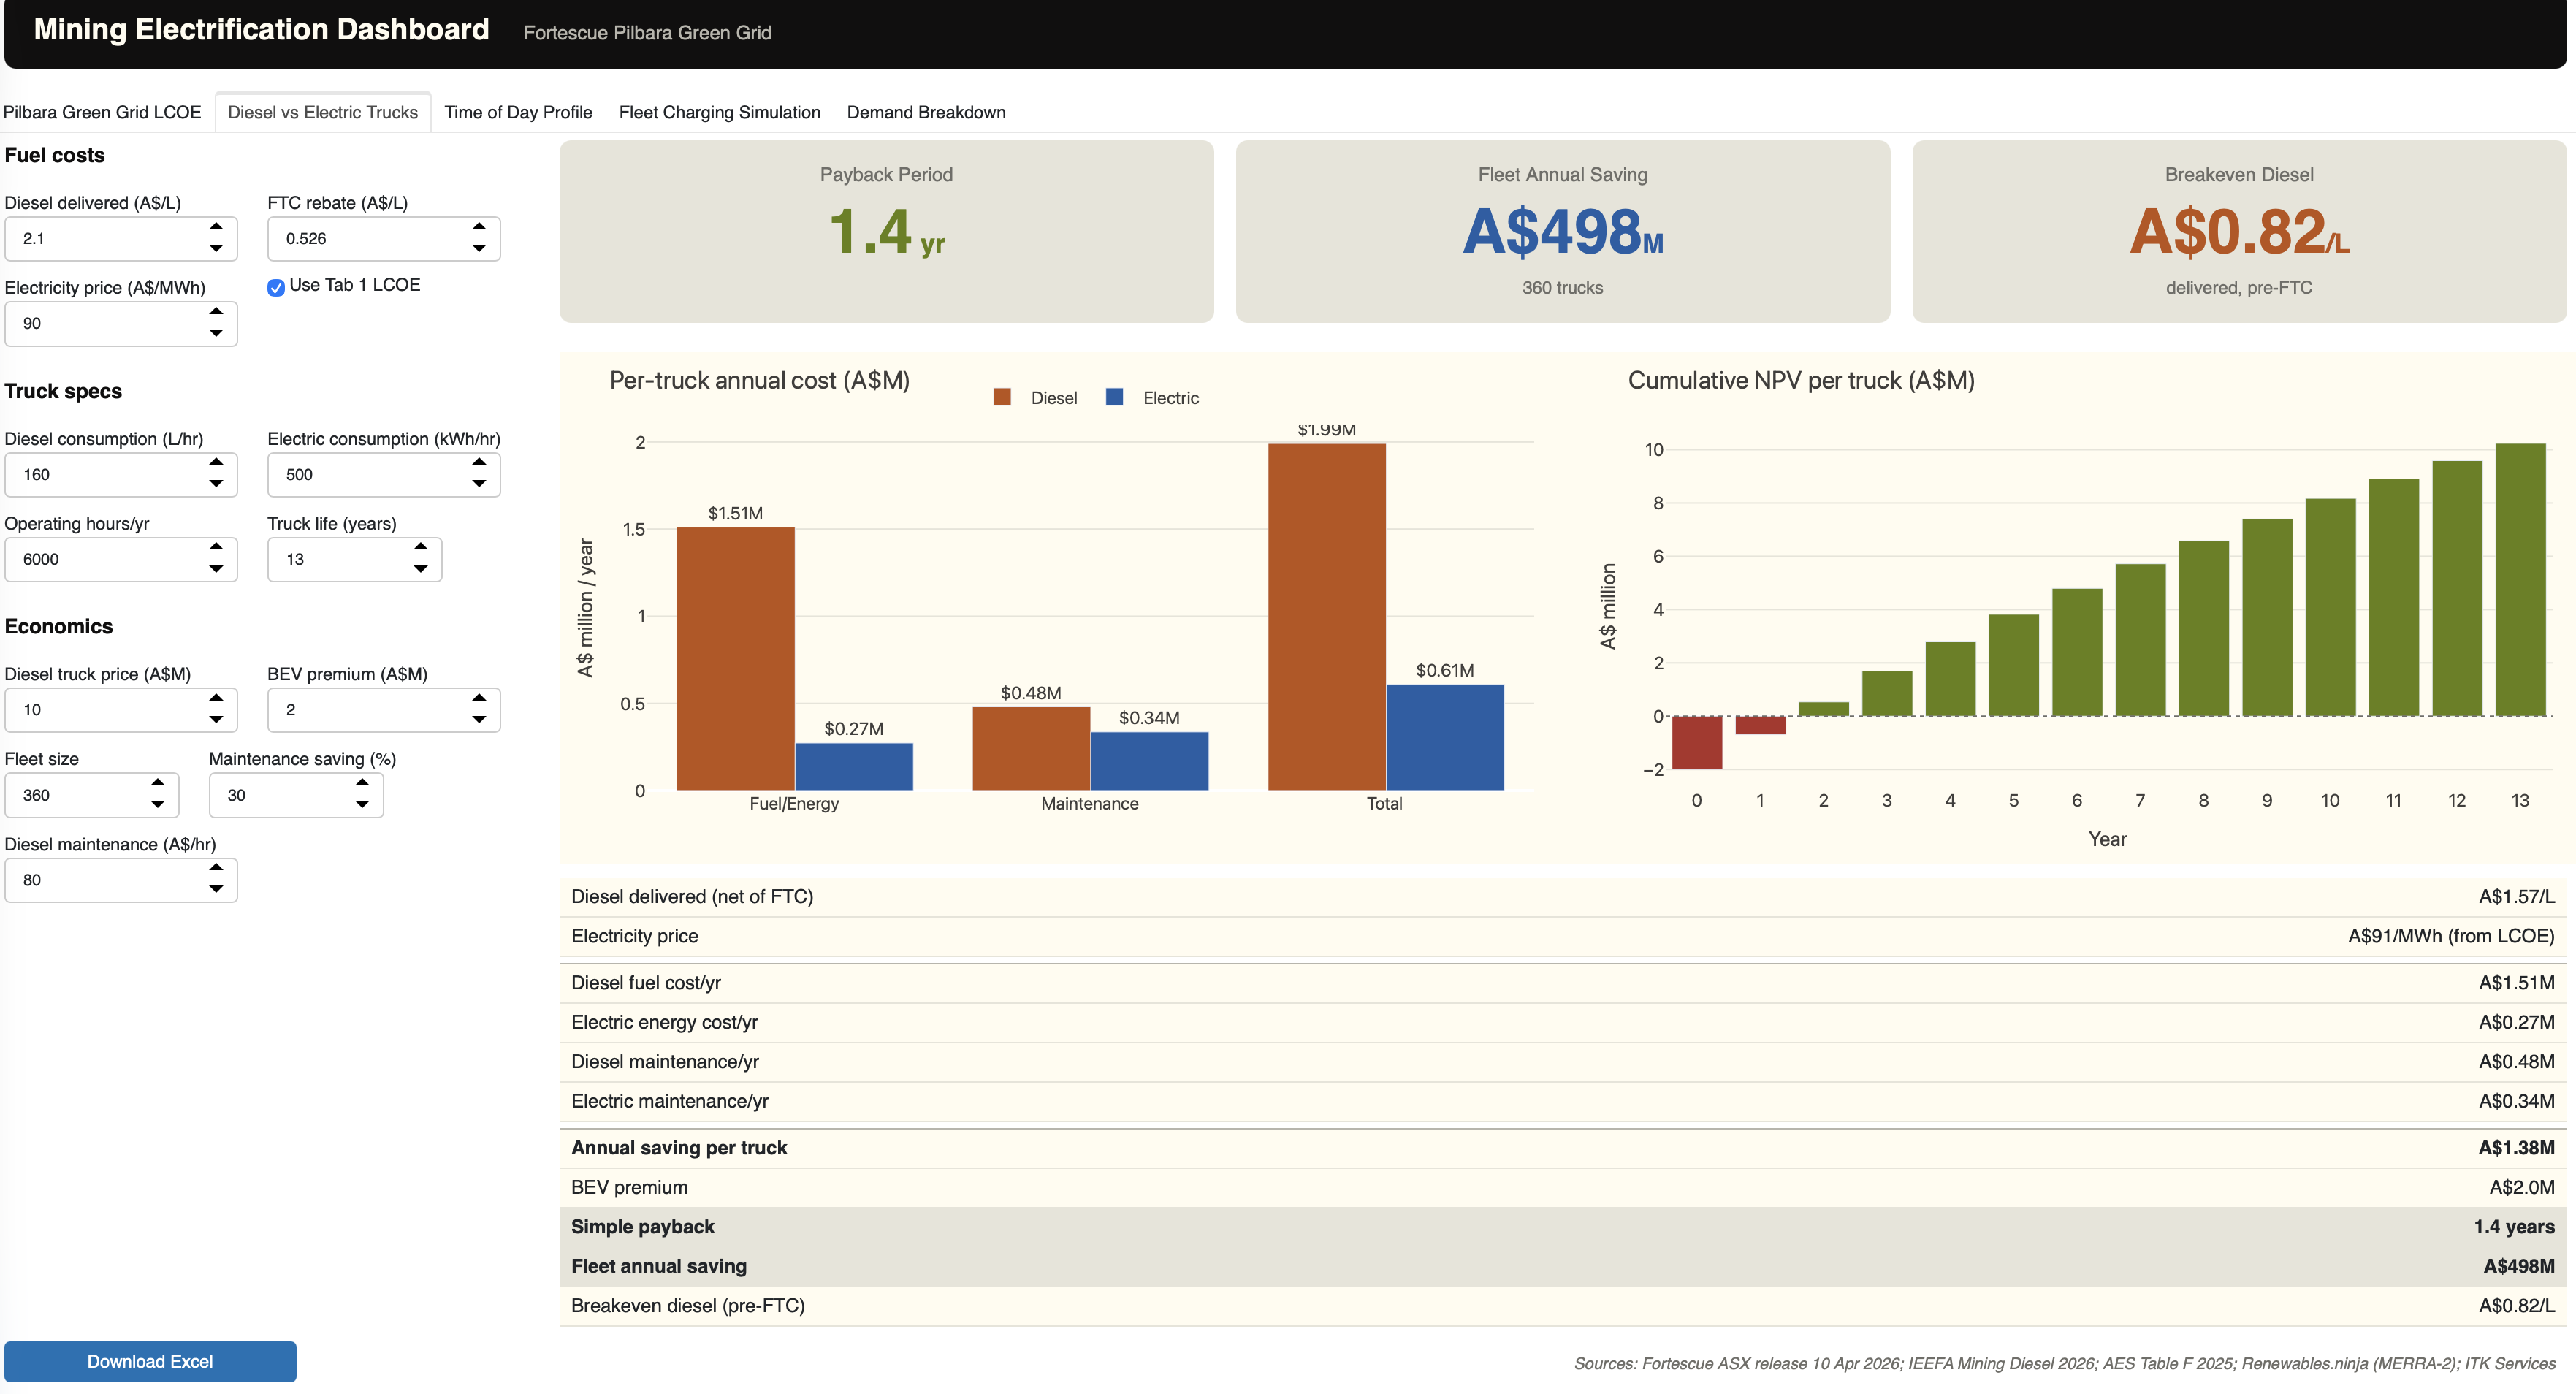
Per-truck annual economics
| Item | Diesel (Cat 793F) | Electric (BEV) |
|---|---|---|
| Fuel/energy cost | ~A$1.5M/yr | ~A$0.25M/yr |
| Maintenance | ~A$0.48M/yr | ~A$0.34M/yr |
| Total operating | ~A$2.0M/yr | ~A$0.59M/yr |
| Annual saving | ~A$1.4M/truck |
Assumptions: 6,000 operating hrs/yr, diesel 160 L/hr at $1.57/L net of FTC, electricity at A$91/MWh (Phase 1 LCOE), 500 kWh/hr electric consumption, 30% maintenance saving on BEV.
BEV premium: ~A$2–3M per truck (Liebherr ~A$3M, XCMG ~A$1–2M over diesel equivalent).
Simple payback: 1.5–2 years per truck at normal diesel prices. Under 1 year at crisis prices.
Fleet-wide economics
| Metric | Value |
|---|---|
| Fleet size | 360 trucks |
| Annual diesel saving (fleet) | ~A$450M/yr |
| Annual maintenance saving (fleet) | ~A$50M/yr |
| Total annual saving | ~A$500M/yr |
| BEV premium (fleet) | ~A$900M |
| Charging infrastructure | ~A$400–600M |
| Total incremental investment | ~A$1.3–1.5B |
| Fleet payback | 2.6–3.0 years |
In general I believe in-truck batteries will out compete battery swapping. However for this particular integrated operation battery swapping provides an ideal way to take advantage of a flat load with solar-heavy generation. I won’t personally be surprised therefore if over time fewer Liebherr and more XCMG trucks end up in the fleet. This is sheer speculation.
Charging Infrastructure
Two models in the fleet
Fortescue will operate two charging approaches, matching the two truck suppliers:
Liebherr T264 BEV — MCS fast charging:
- 6 MW Megawatt Charging System with robotic connection (ABB/Liebherr)
- ~30 minute charge for 3.2 MWh battery
- Chargers located at pit-edge and dump-side
- US$3–5M per charger installed (US$2–3.5M at scale)
- 1 charger per 6–8 trucks (with redundancy)
XCMG XDE240 BEV — battery swap:
- Robotic swap station: depleted pack out, charged pack in
- ~15 minute swap time (vs 30 min MCS charge)
- Standardised 400 kWh BYD Blade LFP packs — same pack across trucks, excavators, and loaders
- US$5–10M per swap station + US$250–400k per spare pack
- Float ratio: 1.3–1.5 packs per truck
Why not trolley assist?
Trolley assist — a tram line powering trucks up the pit ramp via overhead catenary or Liebherr Power Rail — was considered. In this case I don’t think it makes sense, and there is no mention of it in the releases.
Swap Packs as Distributed Energy Storage
The spare packs at swap stations represent additional storage that helps the renewable system manage the solar/wind intermittency problem.
Fortescue’s Phase 1 renewable system (1.2 GW solar + 600 MW wind) produces ~4,836 GWh/yr against ~530 MW average demand. But generation and demand don’t match hour by hour:
- Midday: solar produces ~1,000 MW. Demand is ~530 MW. Surplus of ~470 MW — needs to be stored or curtailed.
- Overnight: solar is zero. Wind averages ~216 MW. Demand is still ~530 MW. Deficit of ~314 MW — needs to come from storage.
- Multi-day low wind: if wind drops below 20% CF for 48 hours, the 4.5 GWh grid battery depletes in ~10 hours at 450 MW discharge.
The grid battery (4.5 GWh at 4-hour duration) can shift ~4–5 hours of daytime surplus to the evening, but it cannot cover a full 12-hour overnight gap, let alone a multi-day low-wind event.
Swap packs can add ~0.36 GWh of storage
Each spare battery pack at a swap station is ~3 MWh. We model about 120 surplus packs above normal requirements to help keep the trucks operating say 6,000 hours a year.
But the real flexibility comes from scheduling when the packs charge:
- Low-wind events: maintain a buffer of fully charged packs (say 50 packs = 150 MWh) that can extend truck operations for 4–6 hours beyond normal, buying time for wind to recover.
The swap model turns 120 spare packs into a flexible 120 MW / 360 MWh demand response resource.
If Fortescue wanted to extend the swap buffer specifically for grid resilience, additional packs are cheap:
- 50 extra packs × 3 MWh × A$250/kWh = A$37.5M for 150 MWh of additional storage
- 100 extra packs = A$75M for 300 MWh
Total Diesel Replacement Investment
Table: Fortescue diesel replacement — total cost summary
| Component | Cost (A$) | Notes |
|---|---|---|
| 360 BEV trucks (premium over diesel) | ~900M | Liebherr ~A$3M premium, XCMG ~A$1.5M premium |
| 100+ ancillary BEV equipment | ~570M | XCMG US$400M contract (loaders, dozers, water carts) |
| 50+ electric drill rigs | ~500M | Epiroc US$350M contract |
| MCS chargers (~45 units) | ~250M | US$3.5M avg installed |
| Swap stations (~5 units) | ~75M | US$10M avg + spare packs |
| Grid connection and distribution | ~100M | Substations, HV cable at each site |
| Total diesel replacement | ~A$2.4B | All USD converted at AUD/USD 0.70 |
Annual savings:
| Item | A$/yr |
|---|---|
| Diesel fuel avoided (700 ML at $1.57/L net) | ~1,100M |
| Maintenance reduction (~30% on BEV fleet) | ~50M |
| Less: electricity cost (at A$91/MWh LCOE) | (350M) |
| Net annual saving | ~800M |
Simple payback on diesel replacement: ~3.0 years.
The payback calculation also excludes the $90 m of additional capex for surplus swap packs. Those packs barely move the payback needle.
Timeline to zero diesel
| Date | Milestone |
|---|---|
| Sep 2024 | US$2.8B Liebherr partnership announced (360 T264 BEV trucks) |
| Nov 2024 | US$400M XCMG ancillary equipment contract |
| Apr 2025 | US$350M Epiroc electric drill rig contract |
| Sep 2025 | XCMG added as second haul truck supplier (150–200 units) |
| Early 2026 | 4 autonomous BEV trucks in validation at Eliwana |
| 2026 | First BEV production trucks operational in Pilbara |
| 2026–2028 | Progressive fleet replacement across all sites |
| 2028–2030 | XCMG BEV deliveries (phased) |
| 2030 | Real Zero target — no diesel in Pilbara operations |
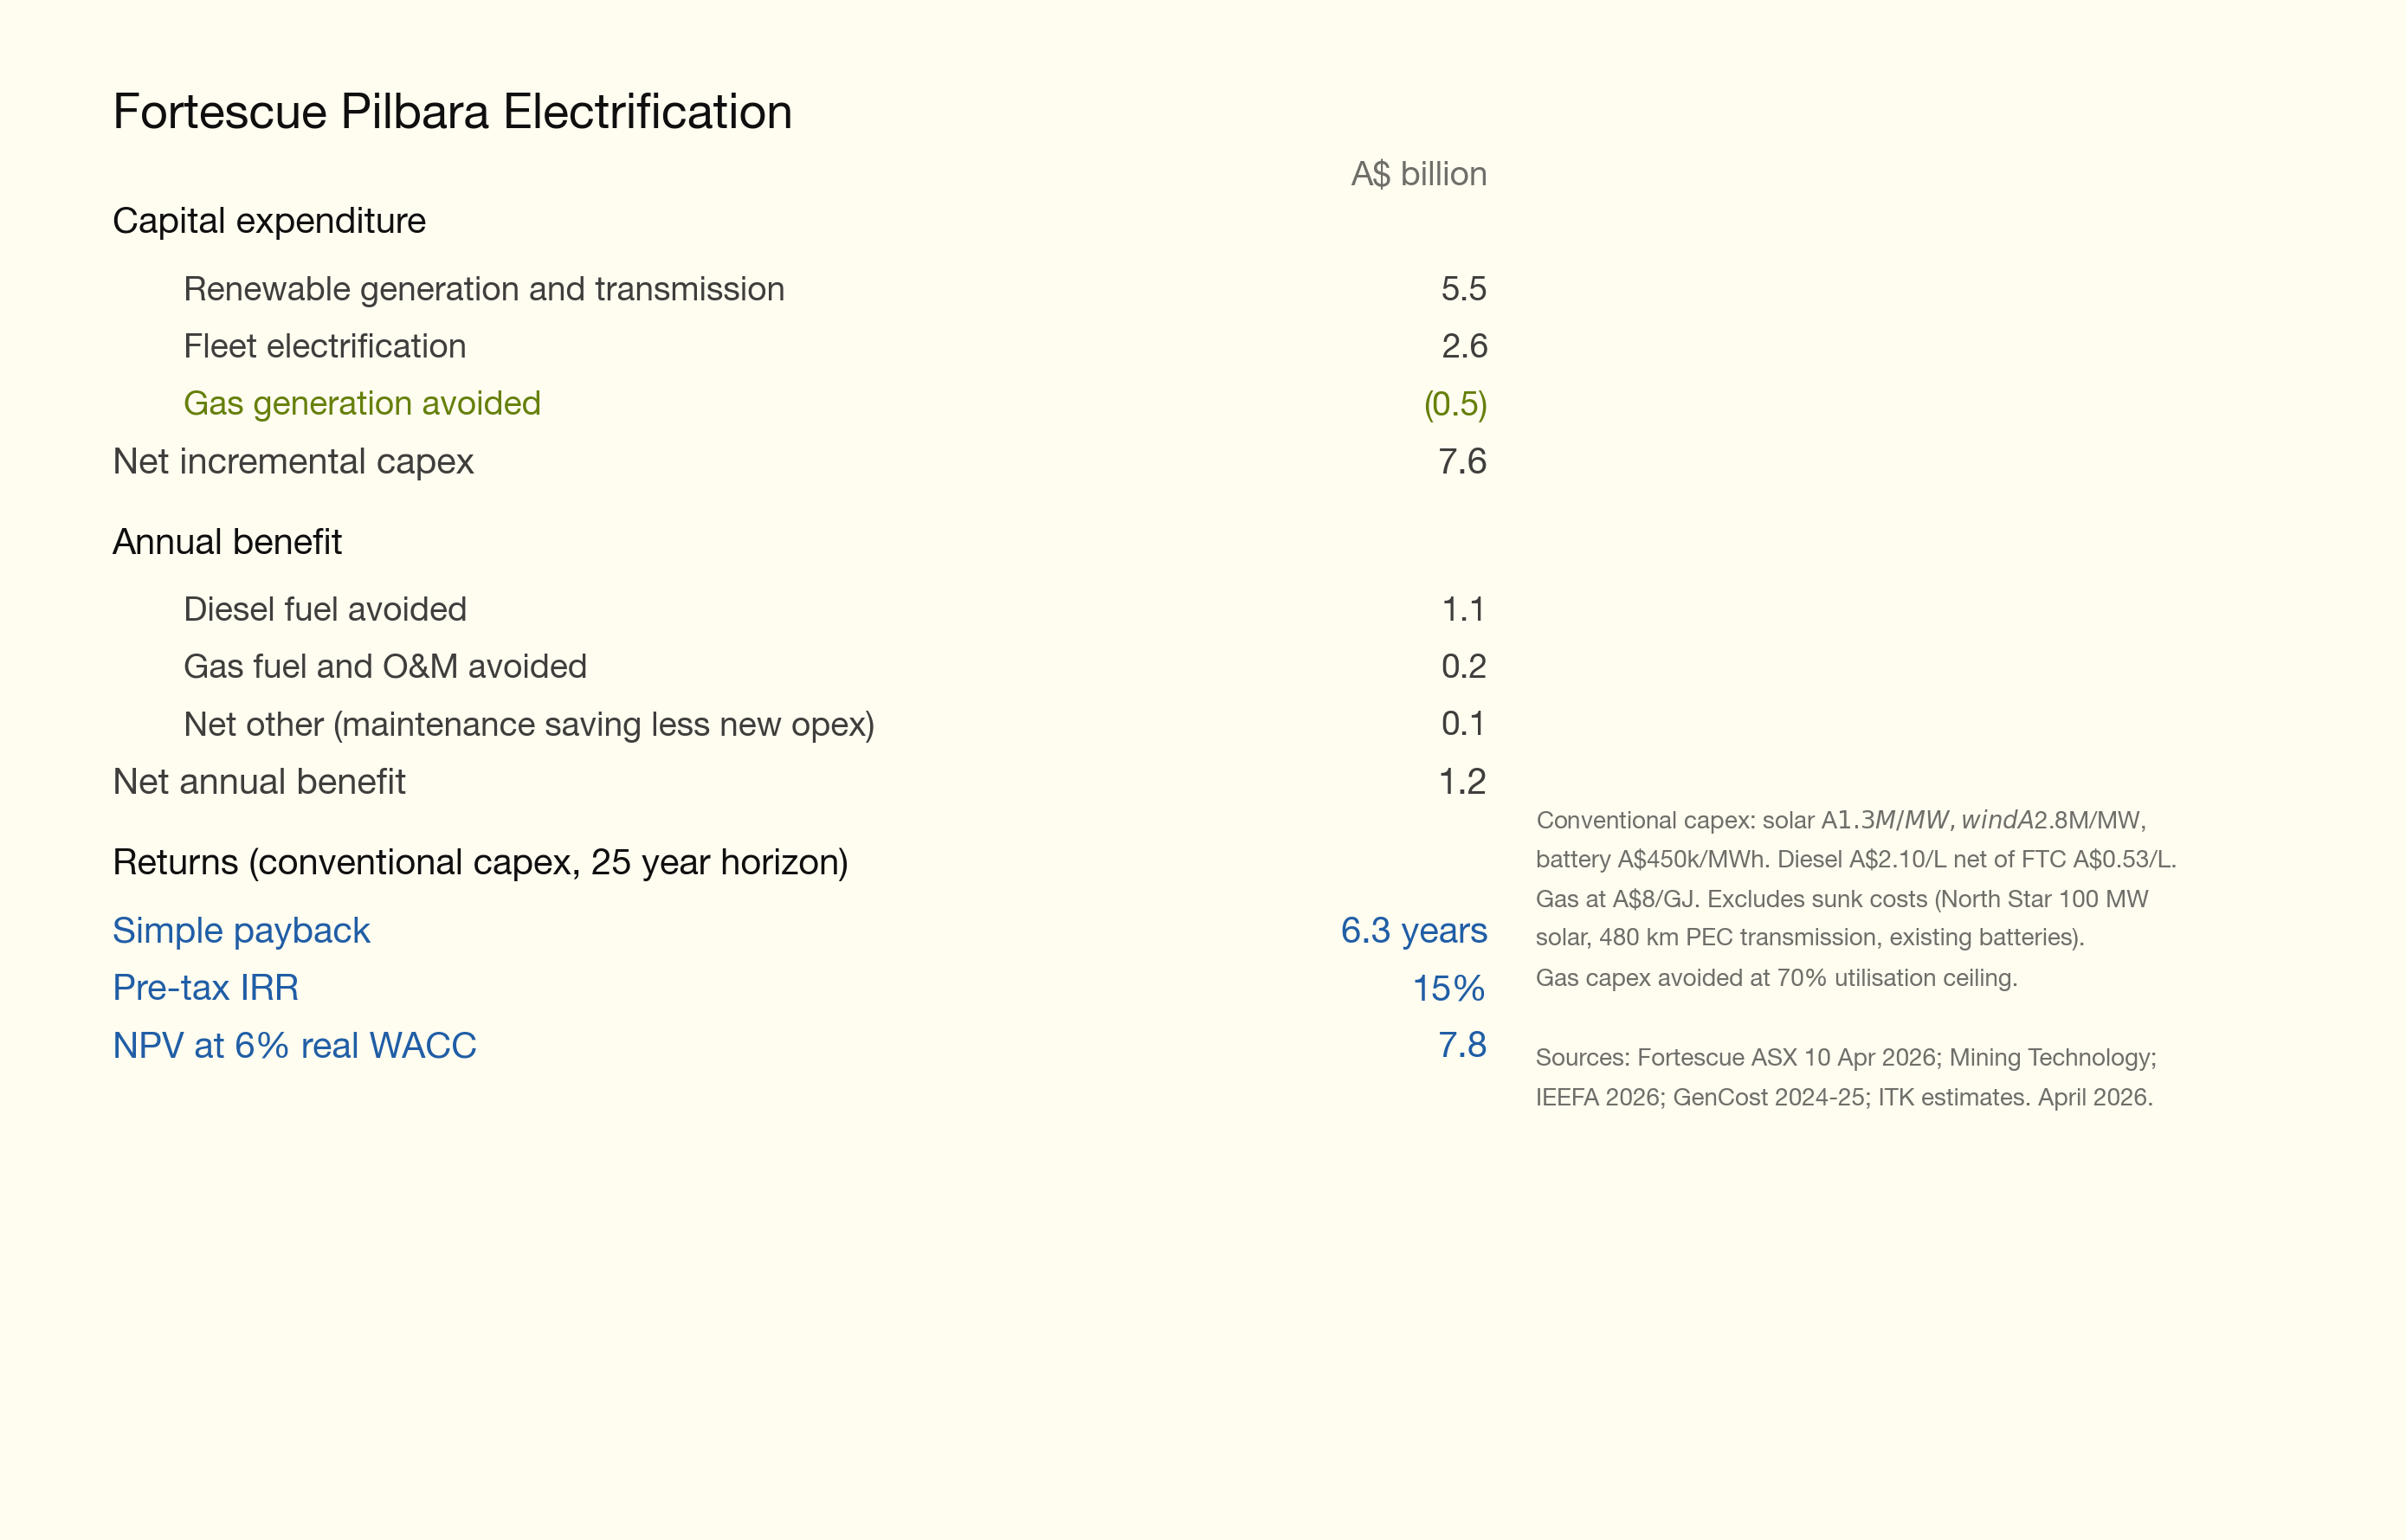
Detailed summary of costs and benefits
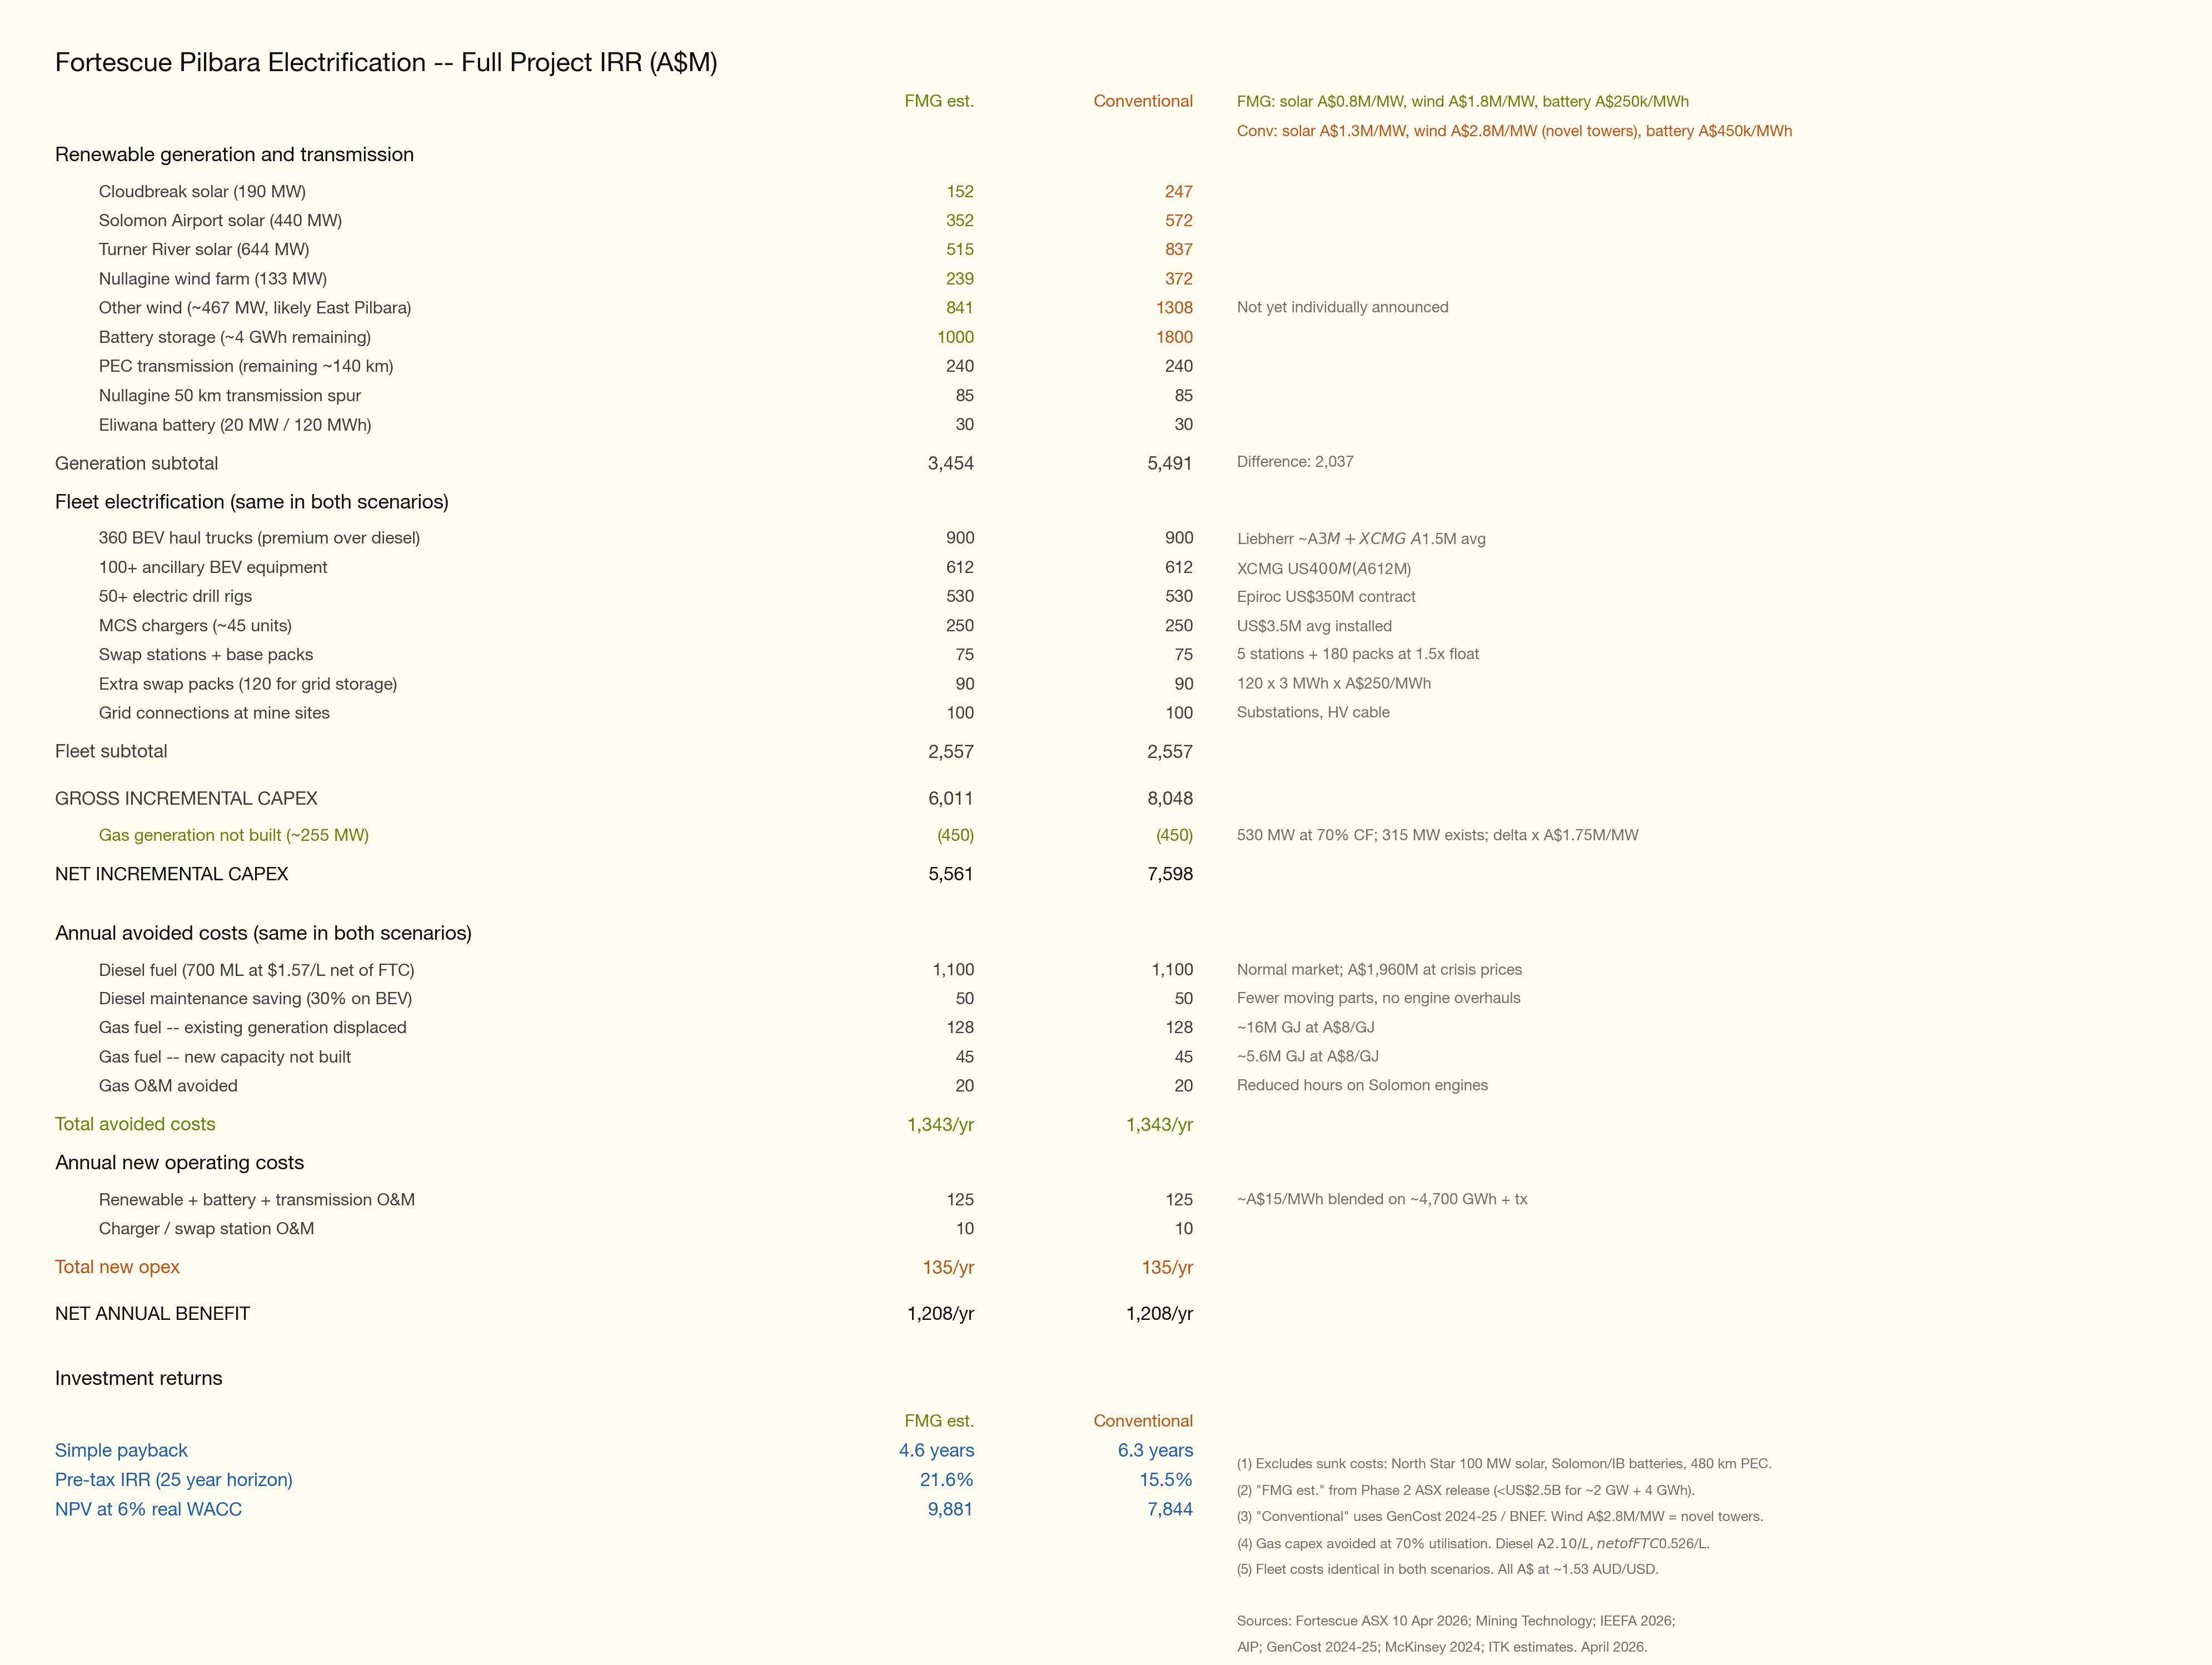
The table above brings together the full capex and benefit picture. The optimistic capex numbers are those implied in phase 2 of FMG’s asx release
On the conservative set of numbers the combined renewables-plus-diesel-replacement program delivers a pretax IRR around 16%, driven overwhelmingly by truck electrification savings. The key risks remain wind turbine performance, Iron Bridge ramp-up, transmission cost and whether XCMG pricing holds at scale.
Note: Savings Reconciliation
Three different annual saving figures appear in this analysis. They measure different scopes:
| Metric | A$/yr | Scope |
|---|---|---|
| Truck fleet operating saving | 550M | 360 trucks only. Fuel + maintenance saving. Gross of electricity cost |
| Diesel replacement net saving | 800M | All diesel (700 ML — trucks + excavators + drills + ancillary). Net of electricity at A$91/MWh LCOE. Excludes gas |
| Full project net benefit | 1,208M | All diesel + all gas displaced. Net of all new opex (renewable O&M, charger O&M). Used in IRR model |
Bridging from A$550M to A$1,208M:
| Step | A$M/yr |
|---|---|
| Truck fleet saving (fuel + maintenance) | 550 |
| Add: non-truck diesel (excavators, drills, ancillary) | 550 |
| All diesel gross saving | 1,100 |
| Add: maintenance saving on all equipment | 50 |
| Less: electricity cost (A$91/MWh × ~3,800 GWh) | (350) |
| Diesel replacement net saving | 800 |
| Add: gas fuel displaced (existing 16M GJ + new 5.6M GJ at A$8/GJ) | 173 |
| Add: gas O&M avoided | 20 |
| Less: additional renewable/charger O&M beyond electricity | (incl above) |
| Adjustment: opex split difference | 215 |
| Full project net benefit | 1,208 |
Note: the A$550M truck-only figure uses per-truck economics (160 L/hr, 6,000 hrs, A$1.57/L net diesel). The A$1,100M all-diesel figure uses the fleet total (700 ML × A$1.57/L). Diesel splits roughly 50:50 between trucks and non trucks.