Ocean heat change update
This section is almost entirely sourced from: Ocean Heat Content sets another record in 2025 This 2025 update is part of series that is promptly updated every year in January of the following year. Considering the many authors from varying countries, primarily China and the USA, its a great example of how things can be done efficiently.
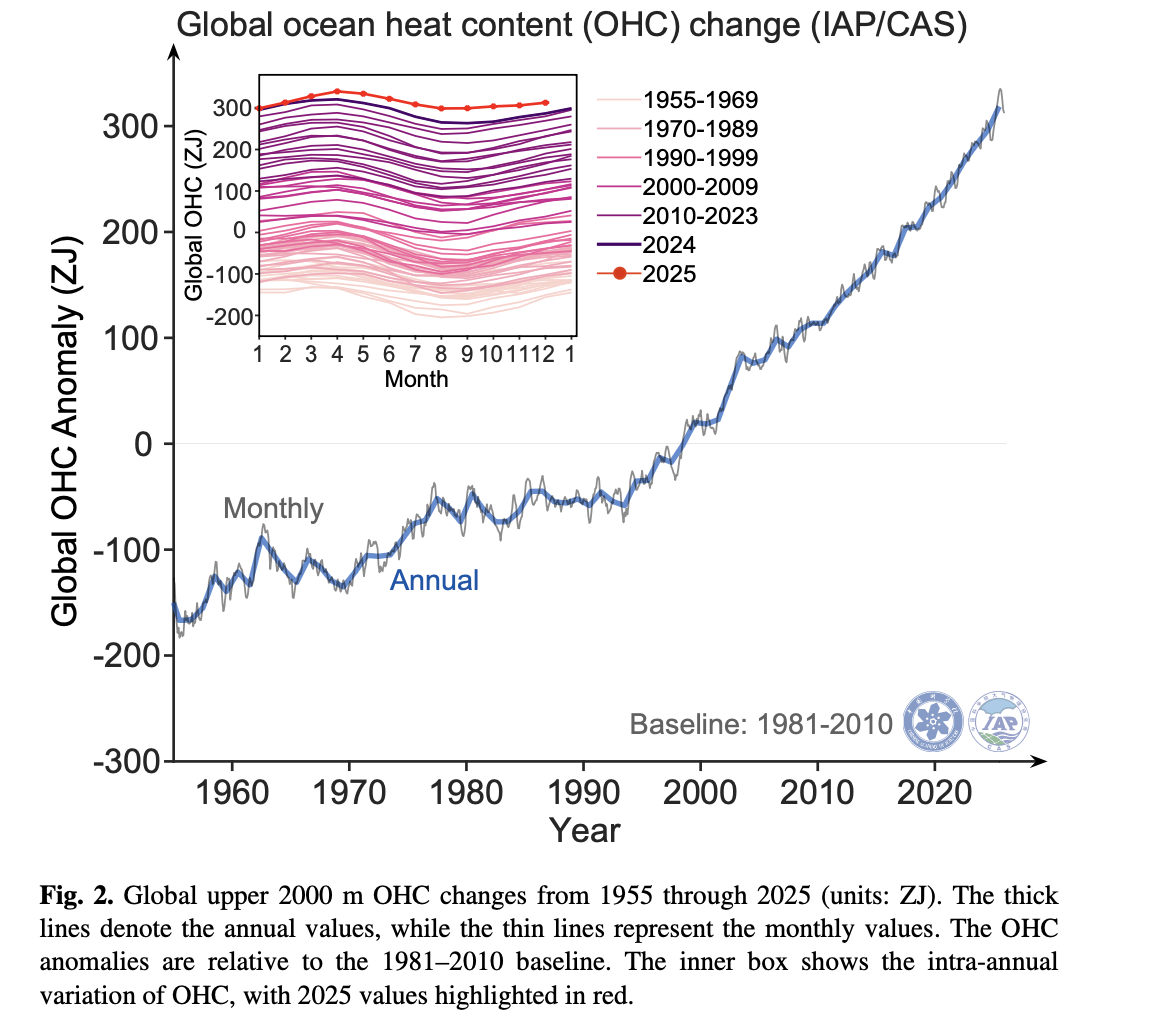
In summary global ocean heat content in the in upper 2km of the ocean increased by about 23 ZJ +- 8 ZJ. 23 ZJ is approximately 40X the amount of global primary energy humans produce each year.
The cumulative change since 1960 is at about 400 ZJ.
There are three different data sets for measuring OHC but two of them go back a lot further. They use a combination of satellite The data comes from the World Ocean Data Base, Argo real time data centre, Argo is about 4000 drifting floats weighing about 30-30 kg at a depth of 1000 metres. Every 10 days they dive to 2000, metres of depth and then surface. They measure conductivity, temperature and pressure. The leading person in the Argo program was Dean Roemmich an American physical oceanographer 
Since 2011 China’s FenYun-3 satellite returns Microwave Radiation Imager Sea Surface temperature and this is used along with ship records and the Argo system to provide data back to 1850.
Ah I guess the point is that the data is validated by multiple source but there is nevertheless a good margin for error.
Unfortunately for Australia some oceans warm more rapidly than others.
Waters off the East Coast in Australia are in the fastest warming waters in the world. First look at 2025 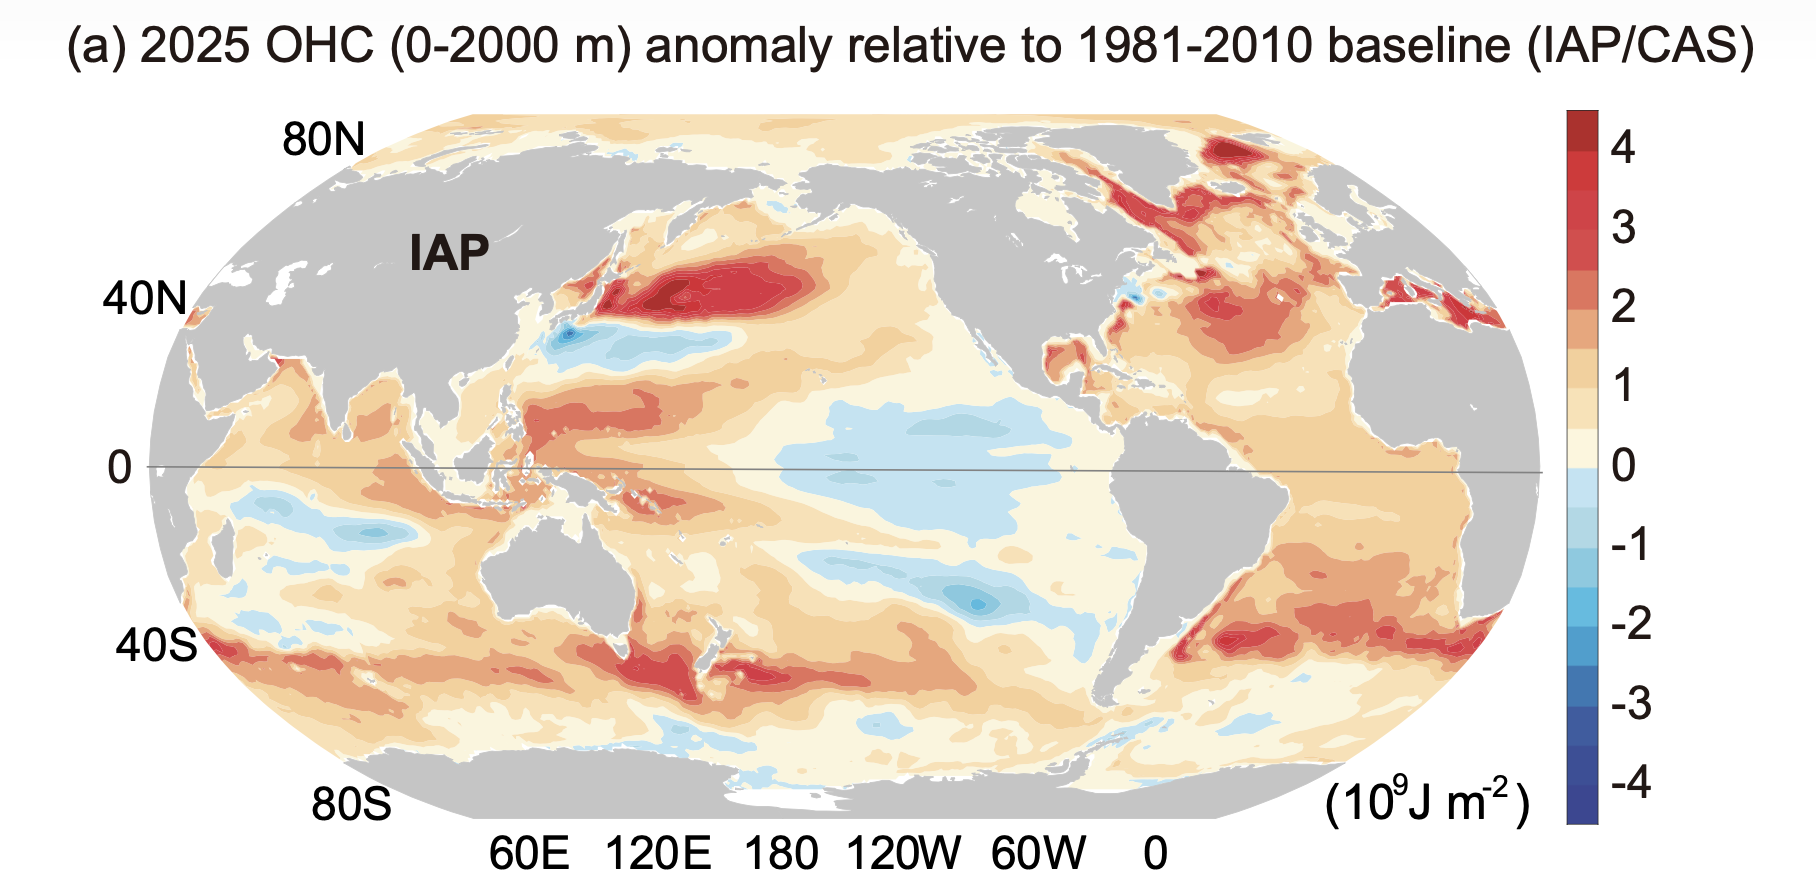
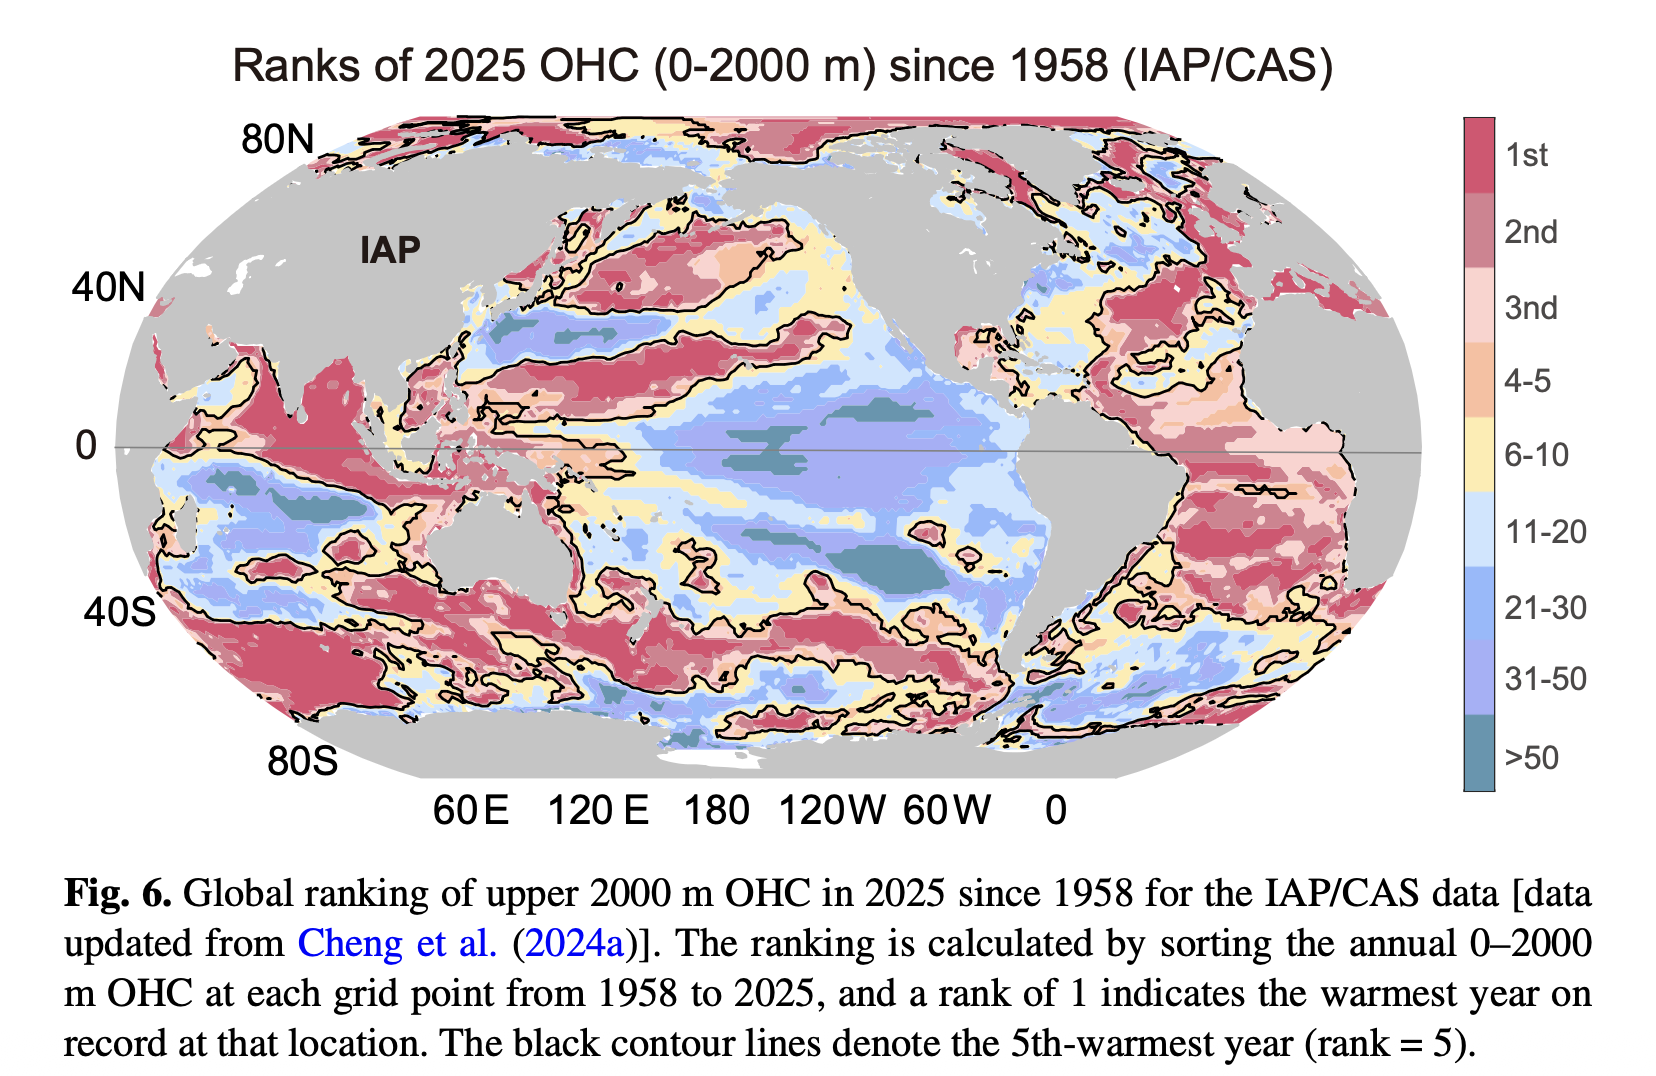
Then you can see from the following map that 2025 is simply another pass of the saw and that warming is consistently high along the Eastern Australian latitudes.
Hadley circulation contributes to Australia’s East Coast Warming
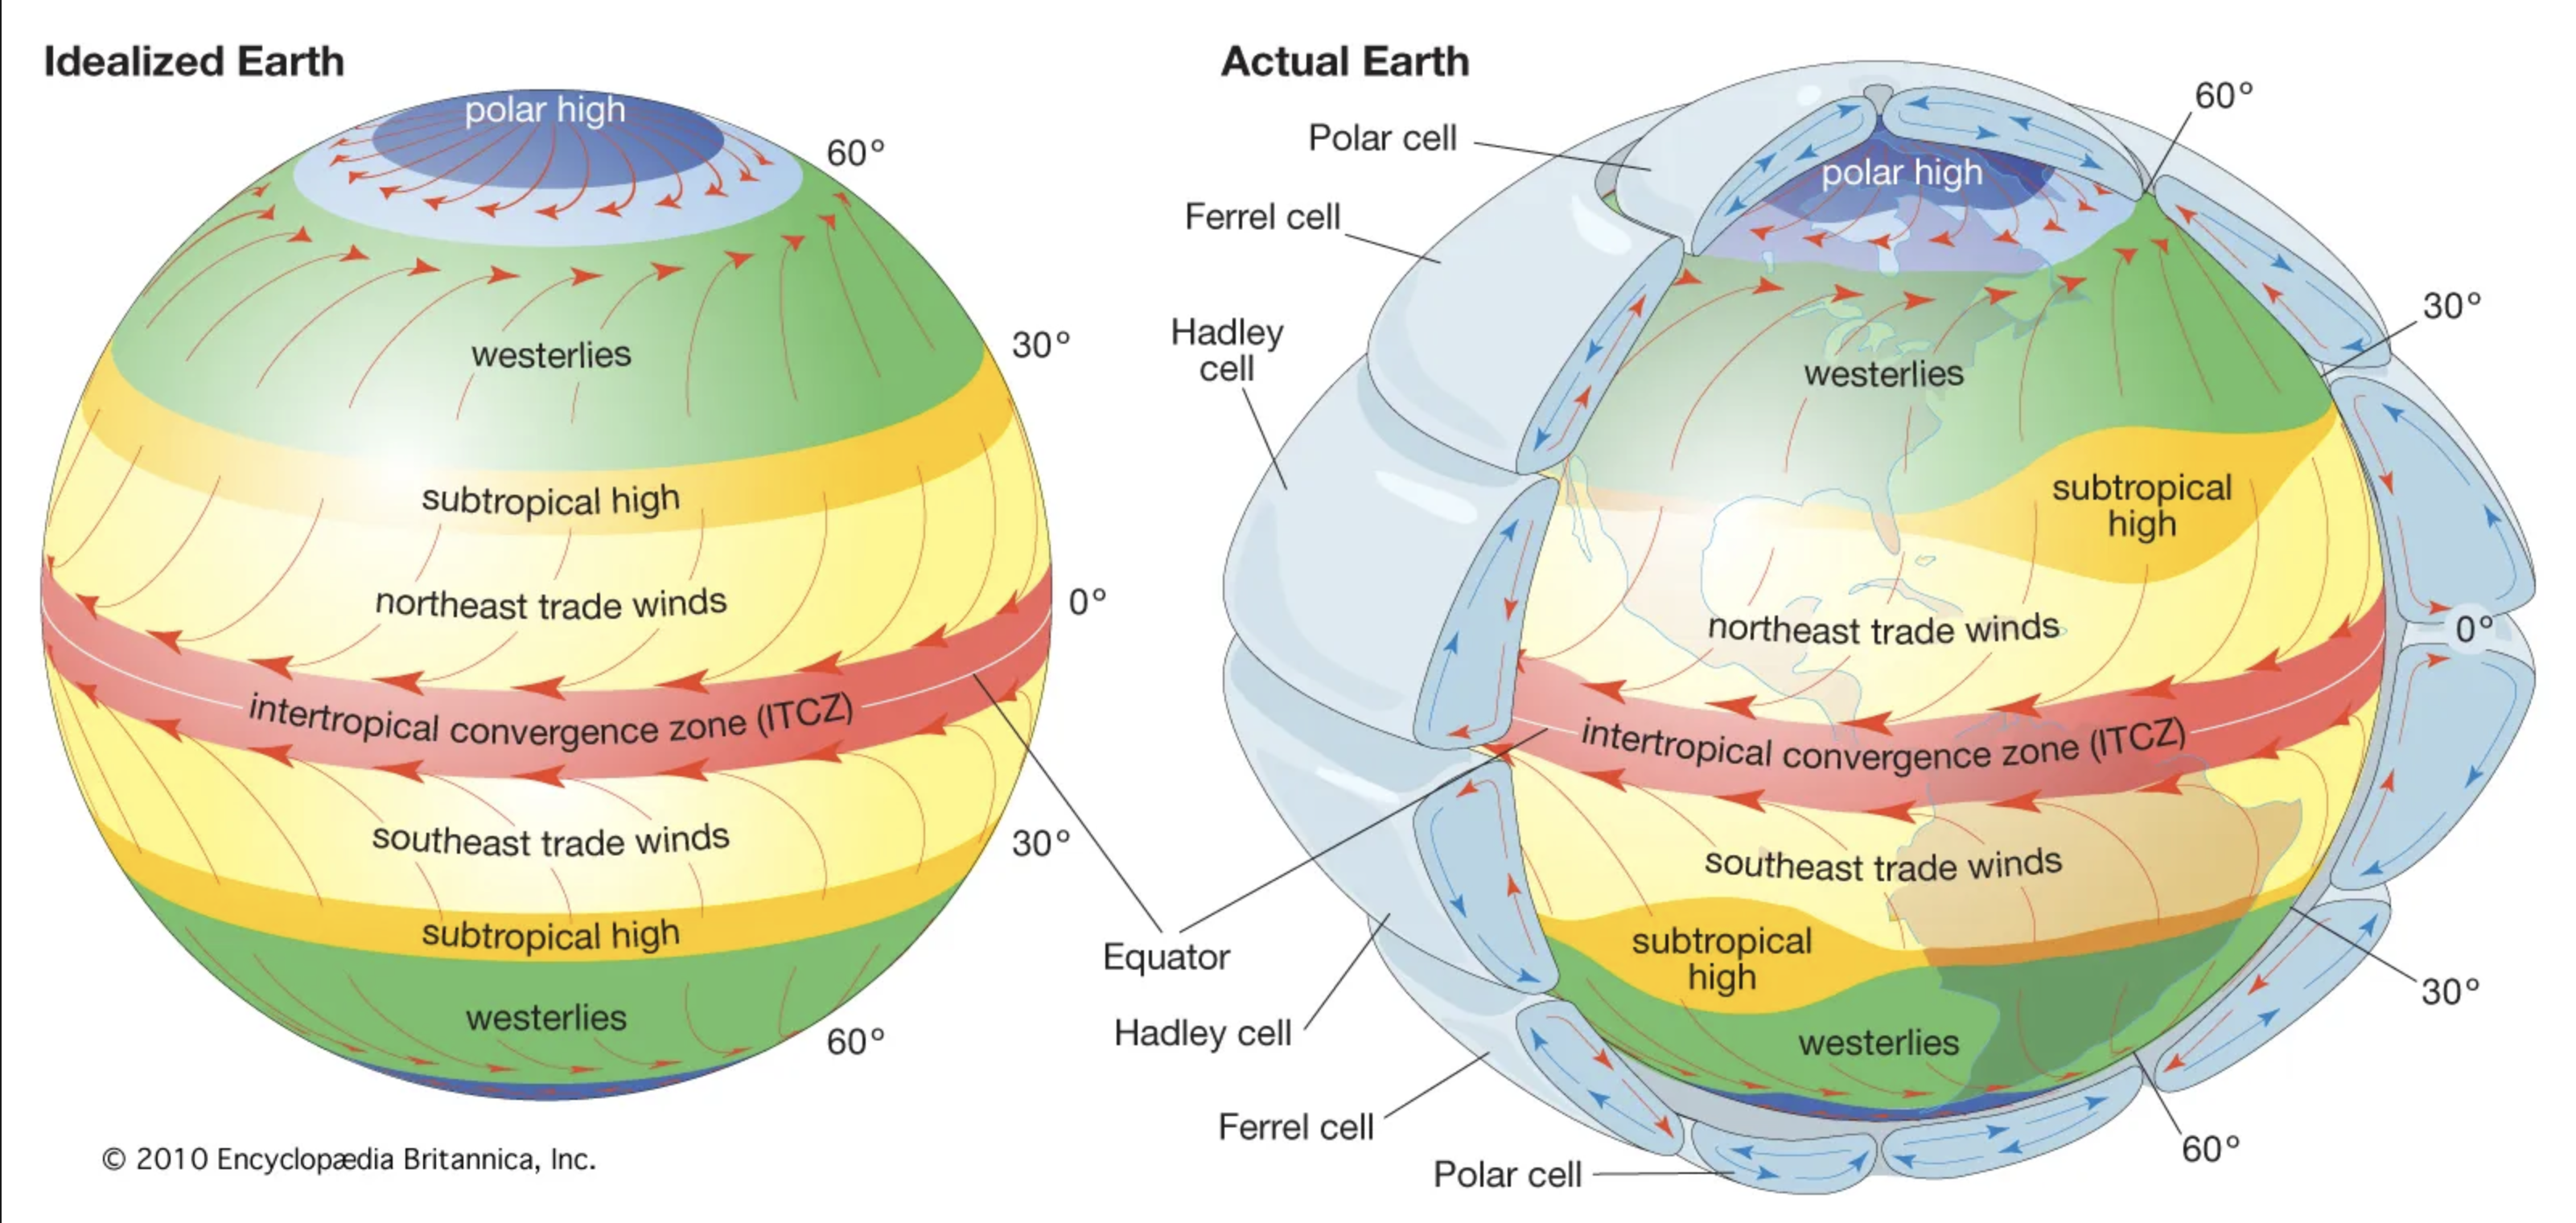
Hadley circulation is a planet-scale system that moves heat from the equator toward the subtropics. Strong sunlight heats the equator, causing warm air to rise. This air flows poleward high in the atmosphere, then sinks around 20–35° latitude in each hemisphere. Surface winds return air toward the equator as the trade winds. Where air sinks, skies are clearer, rainfall is suppressed, and the surface warms more efficiently.
Climate change is pushing the Hadley circulation poleward, especially in the Southern Hemisphere. The tropics are warming faster than higher latitudes, the upper atmosphere is cooling, and the Southern Hemisphere westerly winds are strengthening and shifting south. For eastern Australia, this means more persistent high-pressure systems, fewer clouds, more sunlight reaching the ocean, and less cooling from evaporation—all of which accelerates surface ocean warming.
It’s named Hadley circulation after George Hadley. In the 1700 and 1800s trade winds and their patters of circulation. He published the work in 1735 but it took almost 200 years for it to be fully developed and accepted because there was no way of measuring the upper atmosphere circulation.
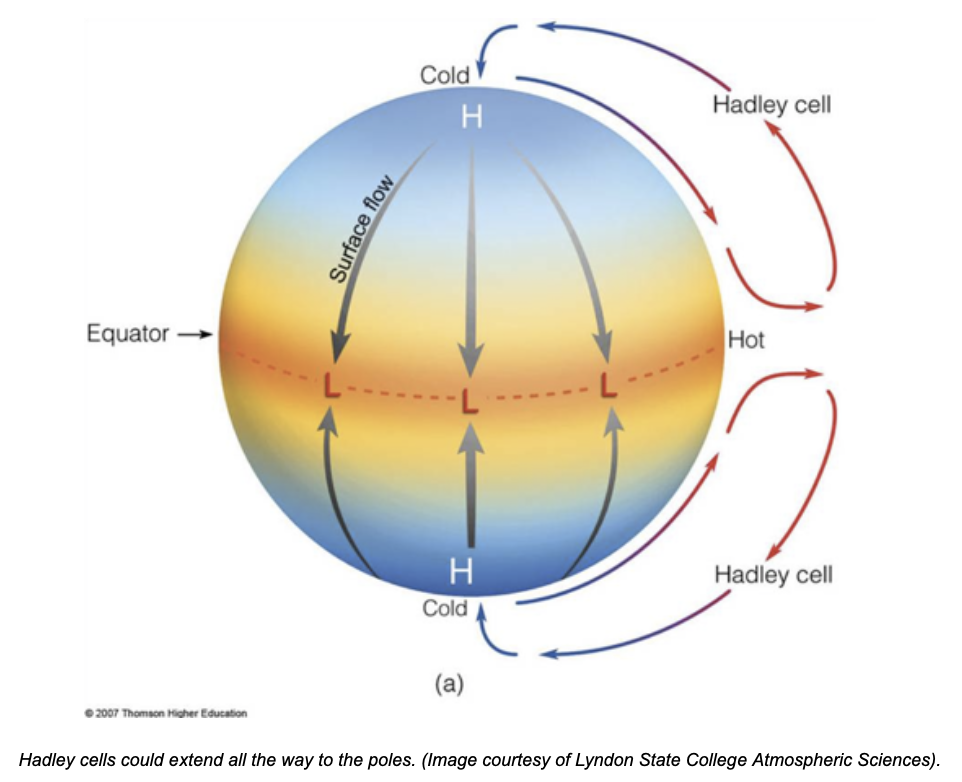
Apparently there are also other cells, polar cells and then “Ferrel cells” in between the polar and Hadley cells.
A good explanation of the world’s main circulations that I watched was from Dr Sylvia Knight “An introduction to atmospheric circulation” 14 very well spent minutes complete with great classroom demos. Took me back to science classes I last attended in the 1960s.
When I read on this topic the “Walker circulation and ENSO” also came up. The Walker circulation is an east–west circulation along the equator across the Pacific Ocean. Warm water piles up in the western Pacific near Indonesia and northern Australia, where warm air rises to produce clouds and rain. Air flows eastward aloft and sinks over the eastern Pacific, with trade winds completing the loop. El Niño shifts warm water eastward and often dries eastern Australia, while La Niña strengthens trade winds and cools the central Pacific. However, La Niña also pushes heat into the subtropics, meaning waters off eastern Australia can continue warming even during La Niña years. Walker circulation is reckoned to contribute to East Coast of Australia ocean warming.
Eastern Australia lies in a subtropical warming band between 20–40°S, where the expanding Hadley circulation, ENSO heat redistribution, and the East Australian Current all concentrate warmth along the coast. Meanwhile, the Southern Ocean—though it absorbs more heat than any other ocean—influences wind patterns and circulation that set the background conditions for this subtropical warming.
The ocean off Australia’s east coast is warming faster because it sits at the intersection of expanding atmospheric circulation, shifting Pacific heat patterns, and strong ocean currents that funnel heat toward the coast. This is a structural, long-term change—not a short-term fluctuation.