CHATTER
30 January Few plots to finish the week.
These graphs are about futures and inflation. I’ll let them speak for themselves. I also added an article on Sharpe ratios and what it means, along with the ESEM to Goverment involvement in the sector.
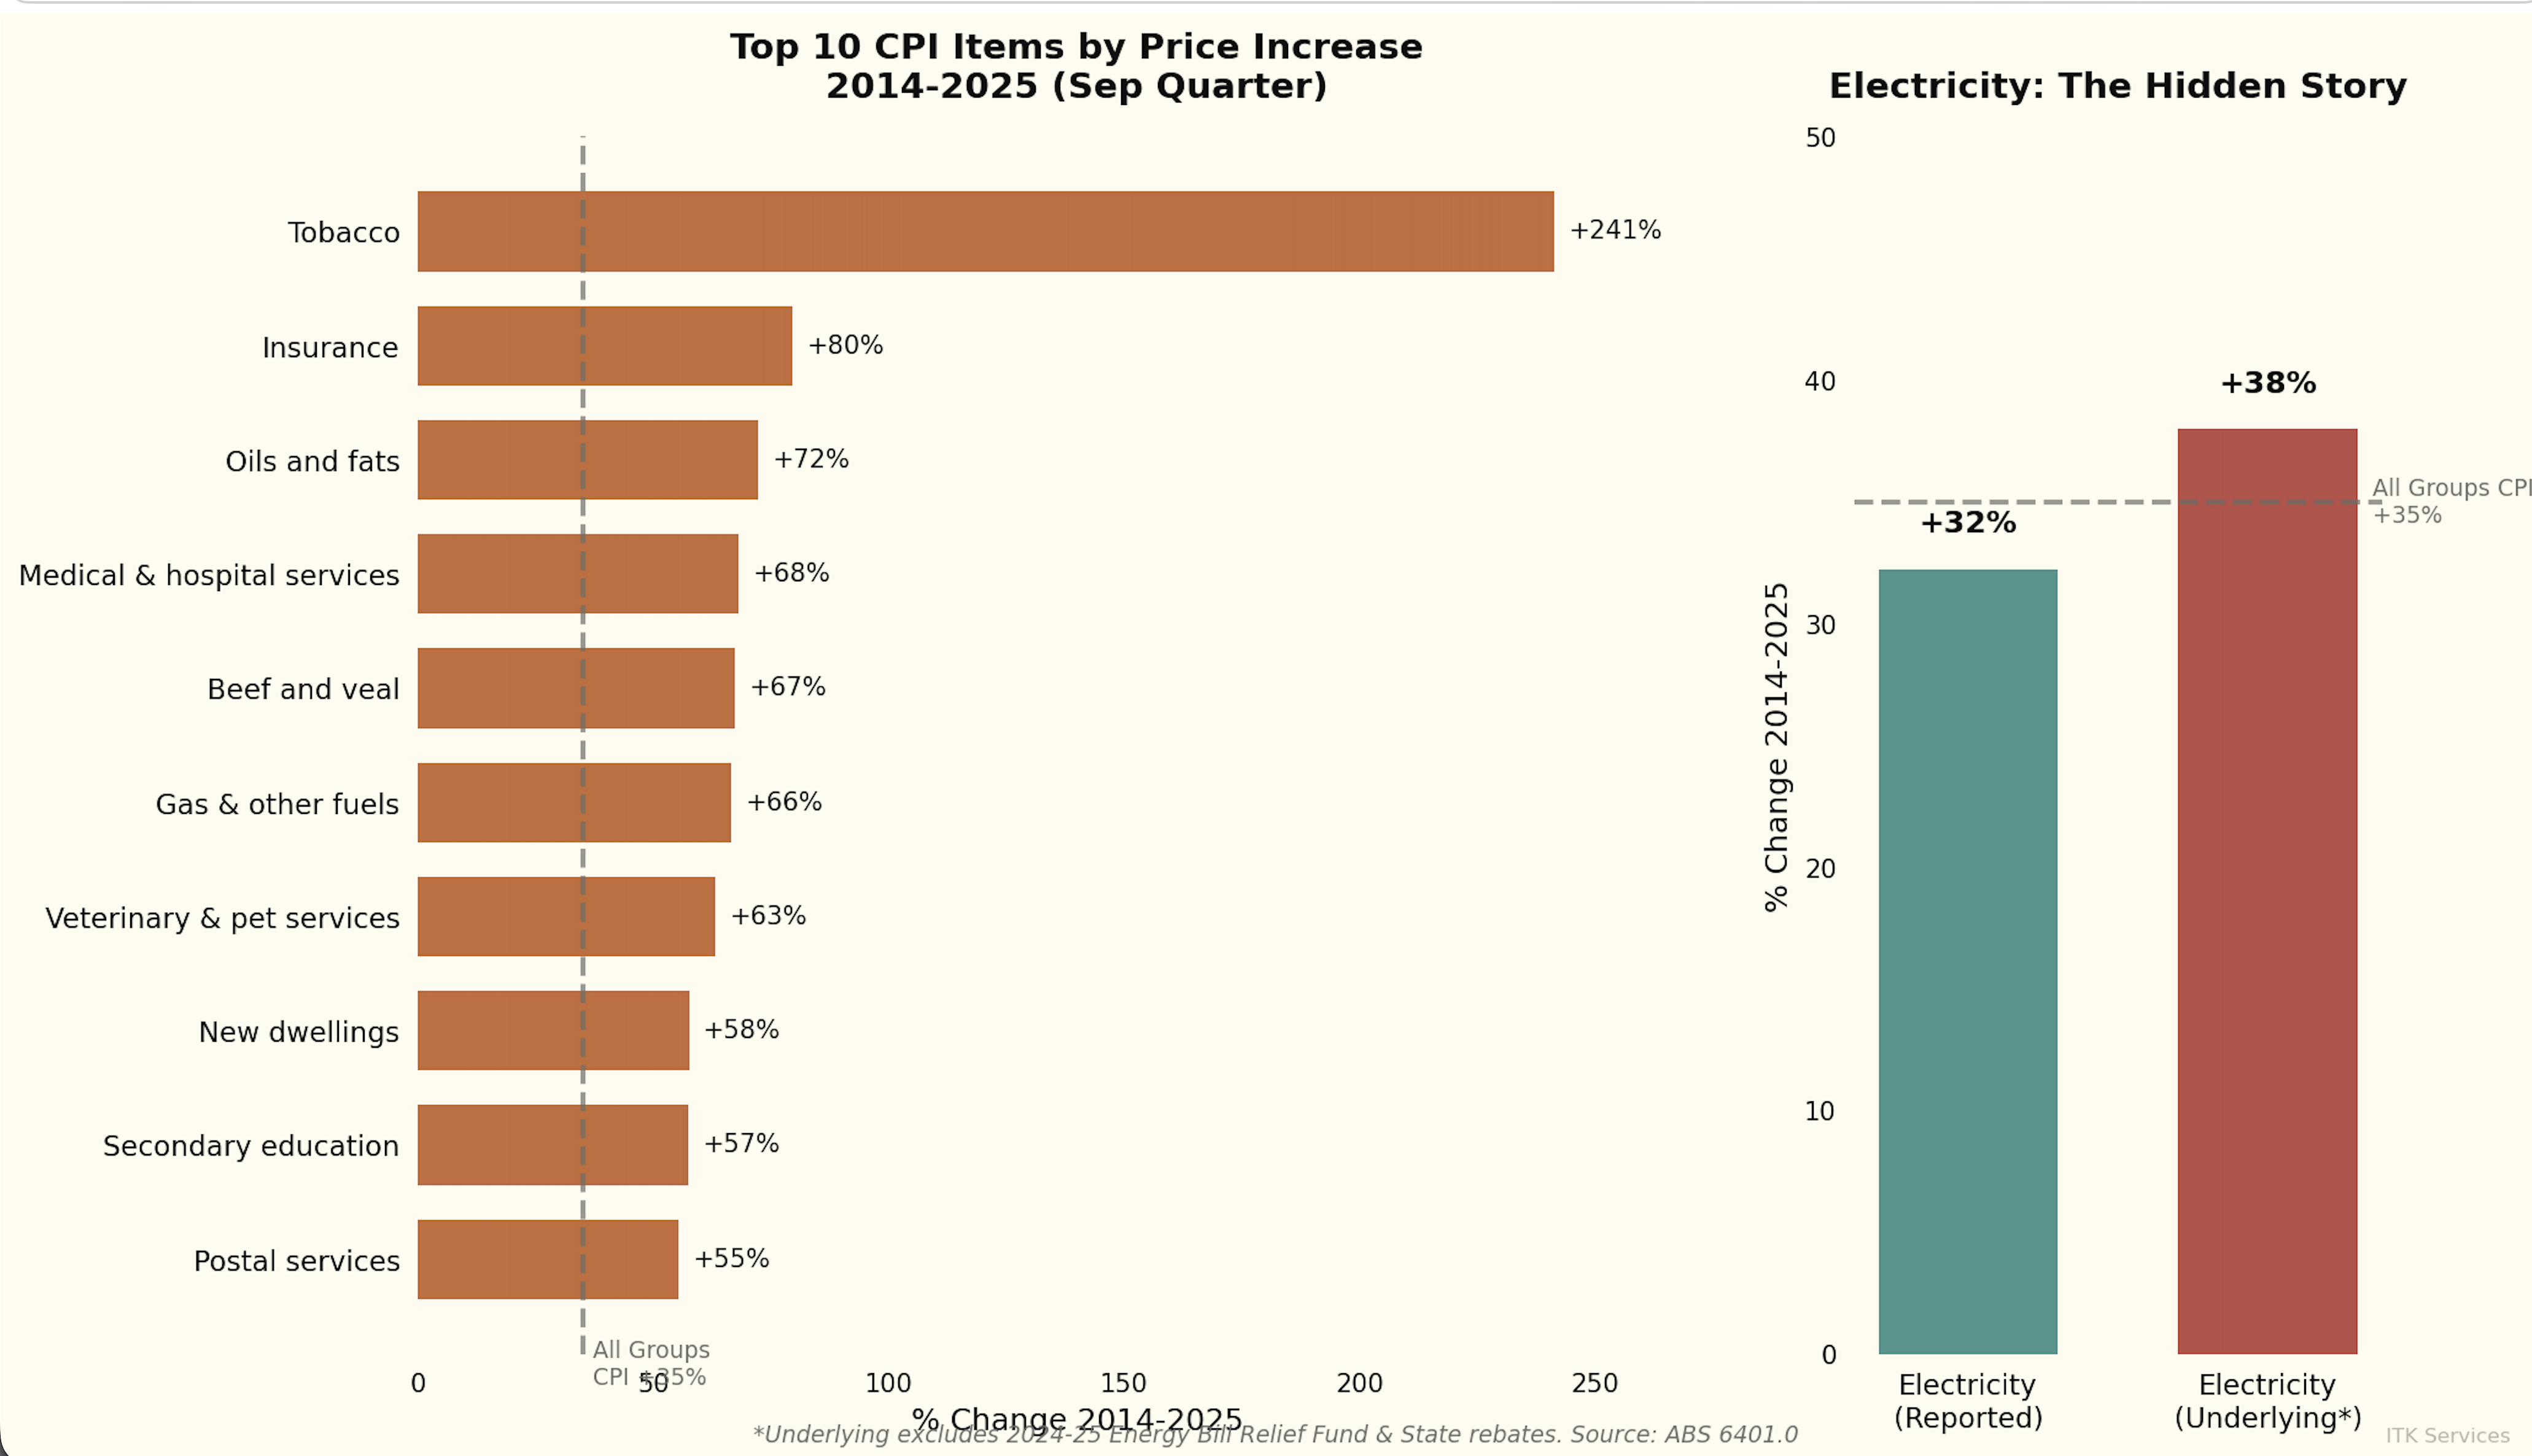
Electricity prices are up about the same as inflation over the past decade.
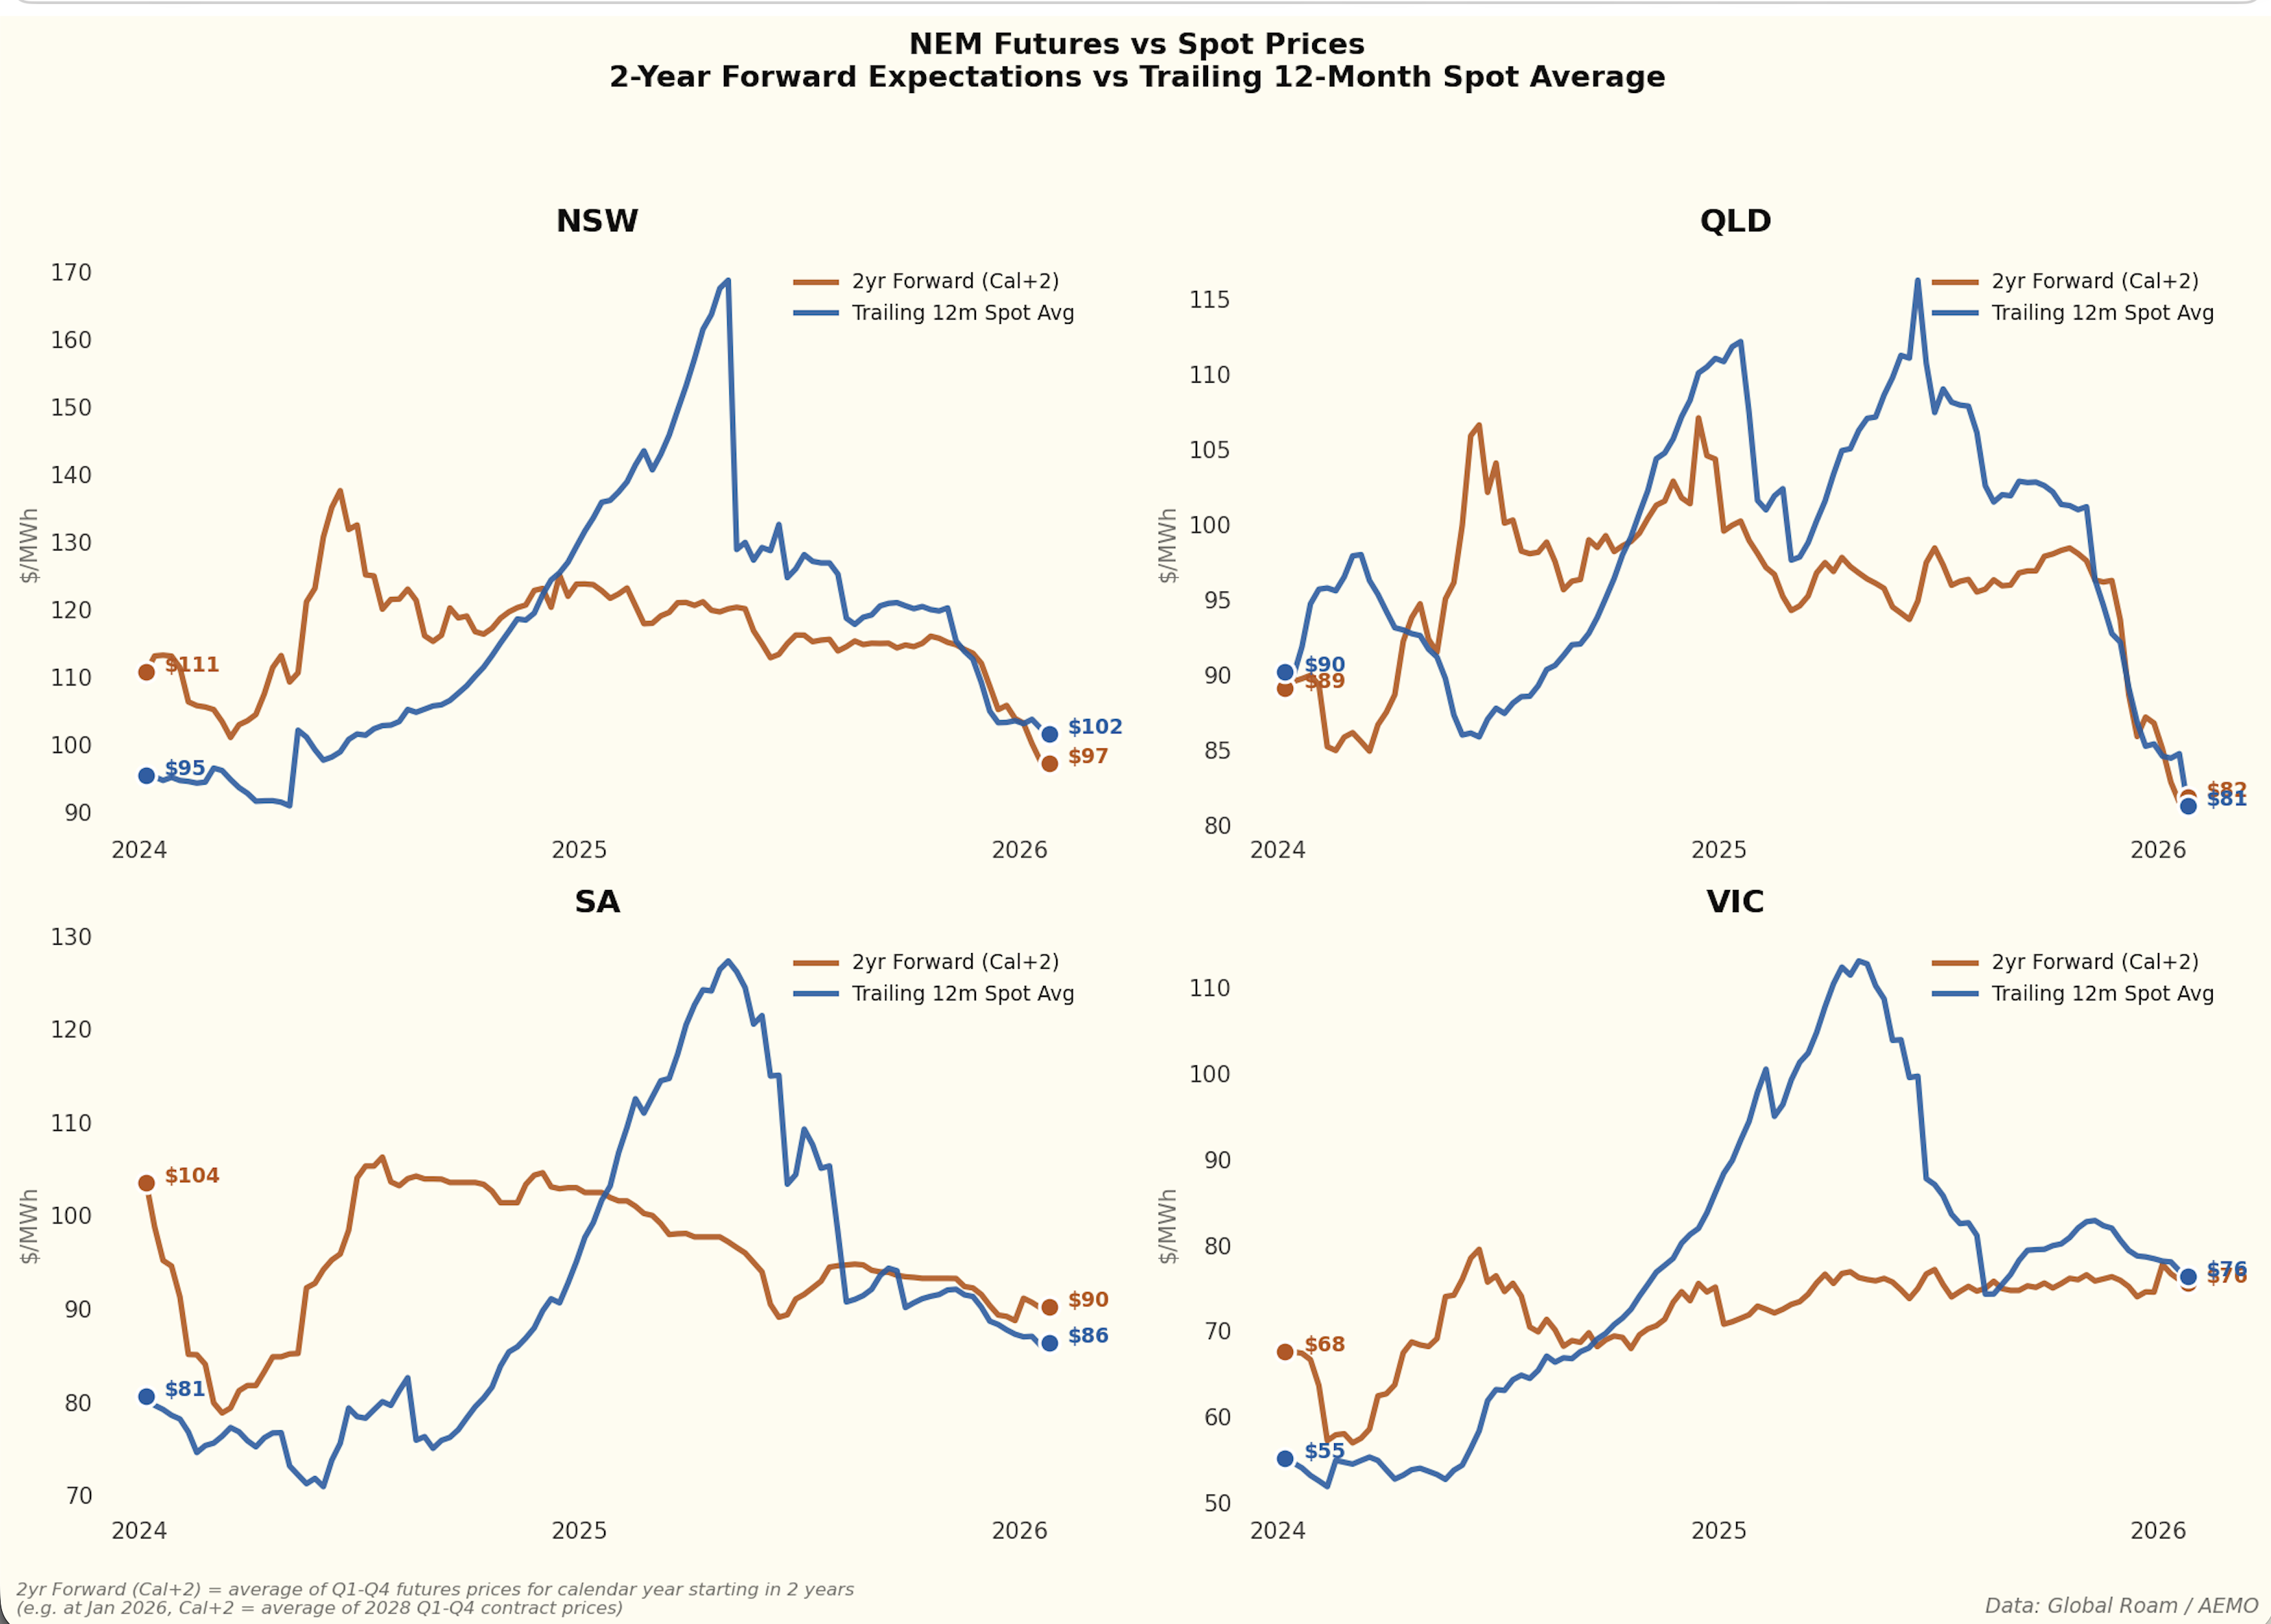
Futures have fallen
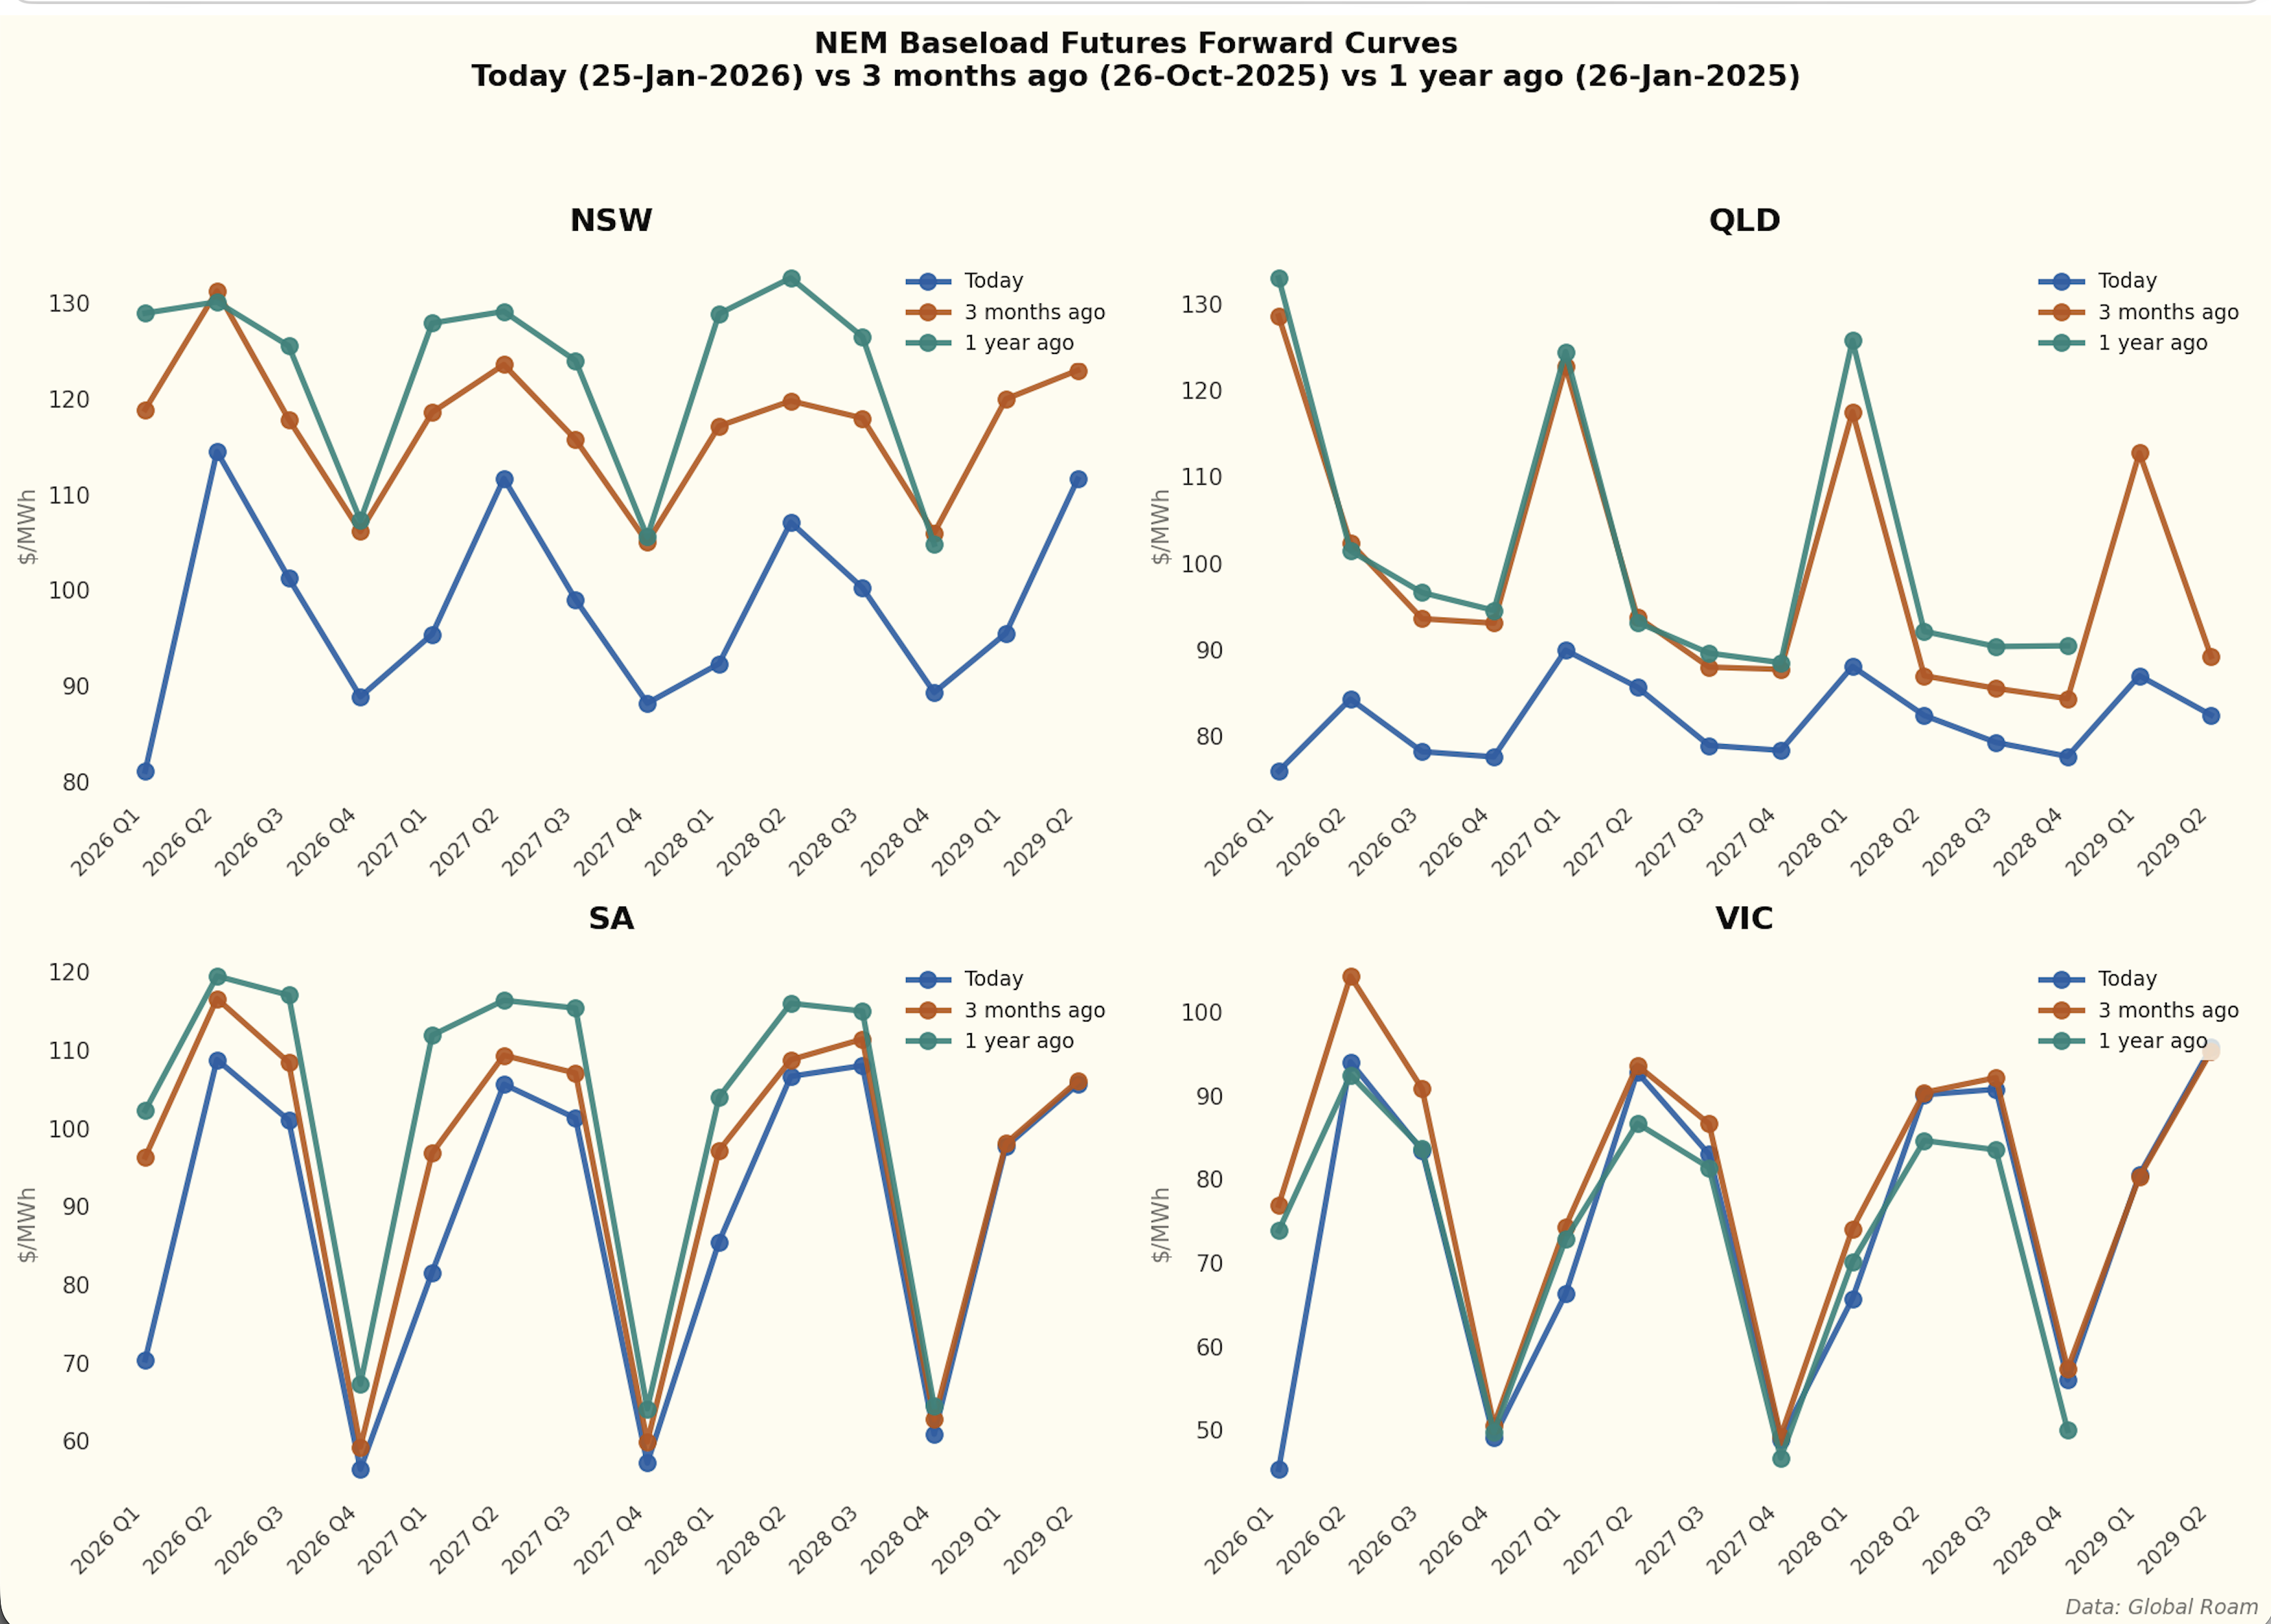
And arguably the market’s expectations are shaped in part by spot prices. Theory basically suggests that futures should sell at a premium to spot (contango)
25 January
Transitioning to a light them “Flexloki” Might be easier on the eye, I dont think it works quite as well for dashboards and plots but the overall look may be easier on the eye.
21 January
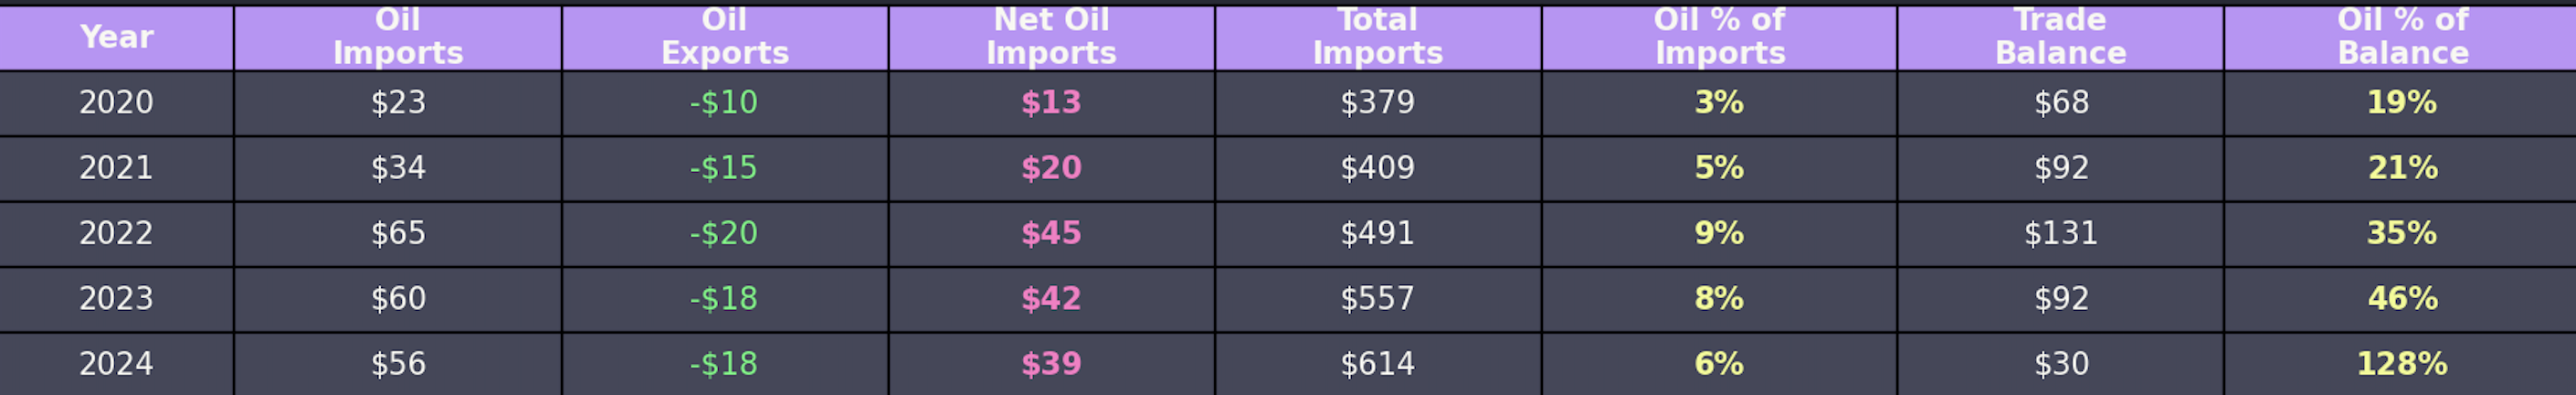
Australia has a massive opportunity esssentially paid for by US$250bn of Chinese subsidies to develop a $40 bn new export industry at zero cost. Well actually not exports but import replacement. Eliminate oil imports by electrifying transport. The policies to do it are first, build lots of high quality charging infrastructure and second eliminate GST on EVs
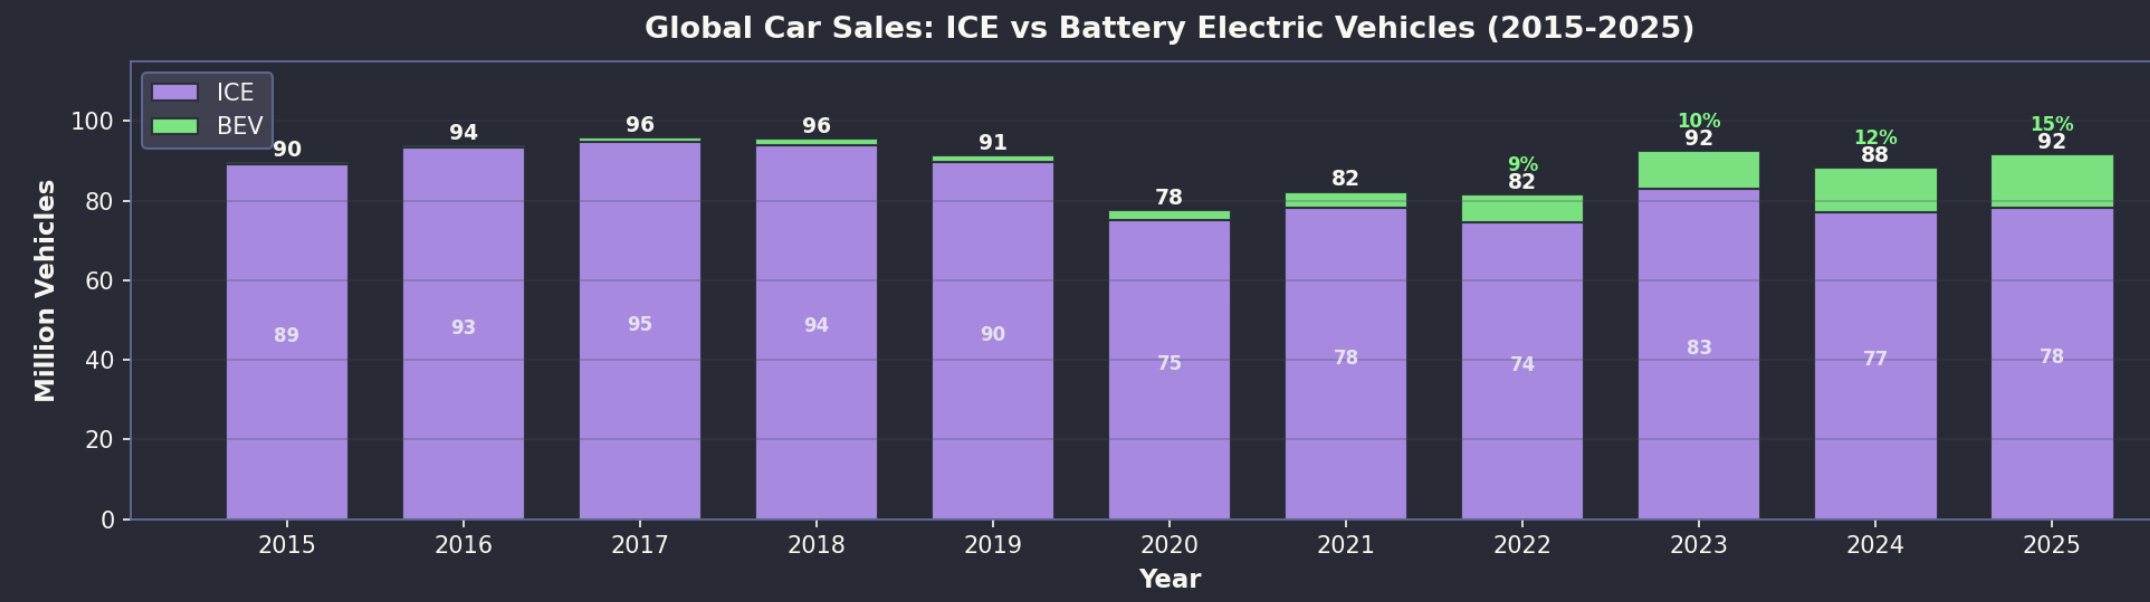
Look how ICE cars have fallen from peak, not just due to EVs to be sure but certainly a factor. Look in Articles for a discussion.
19 January
There are number of areas where I think Australia could sharpen up its data reporting. These include comparative global electricity prices, RIN statements for electricity distributors and even carbon emissions, today’s gripe, where we still only have preliminary data to September 2025.
14 January
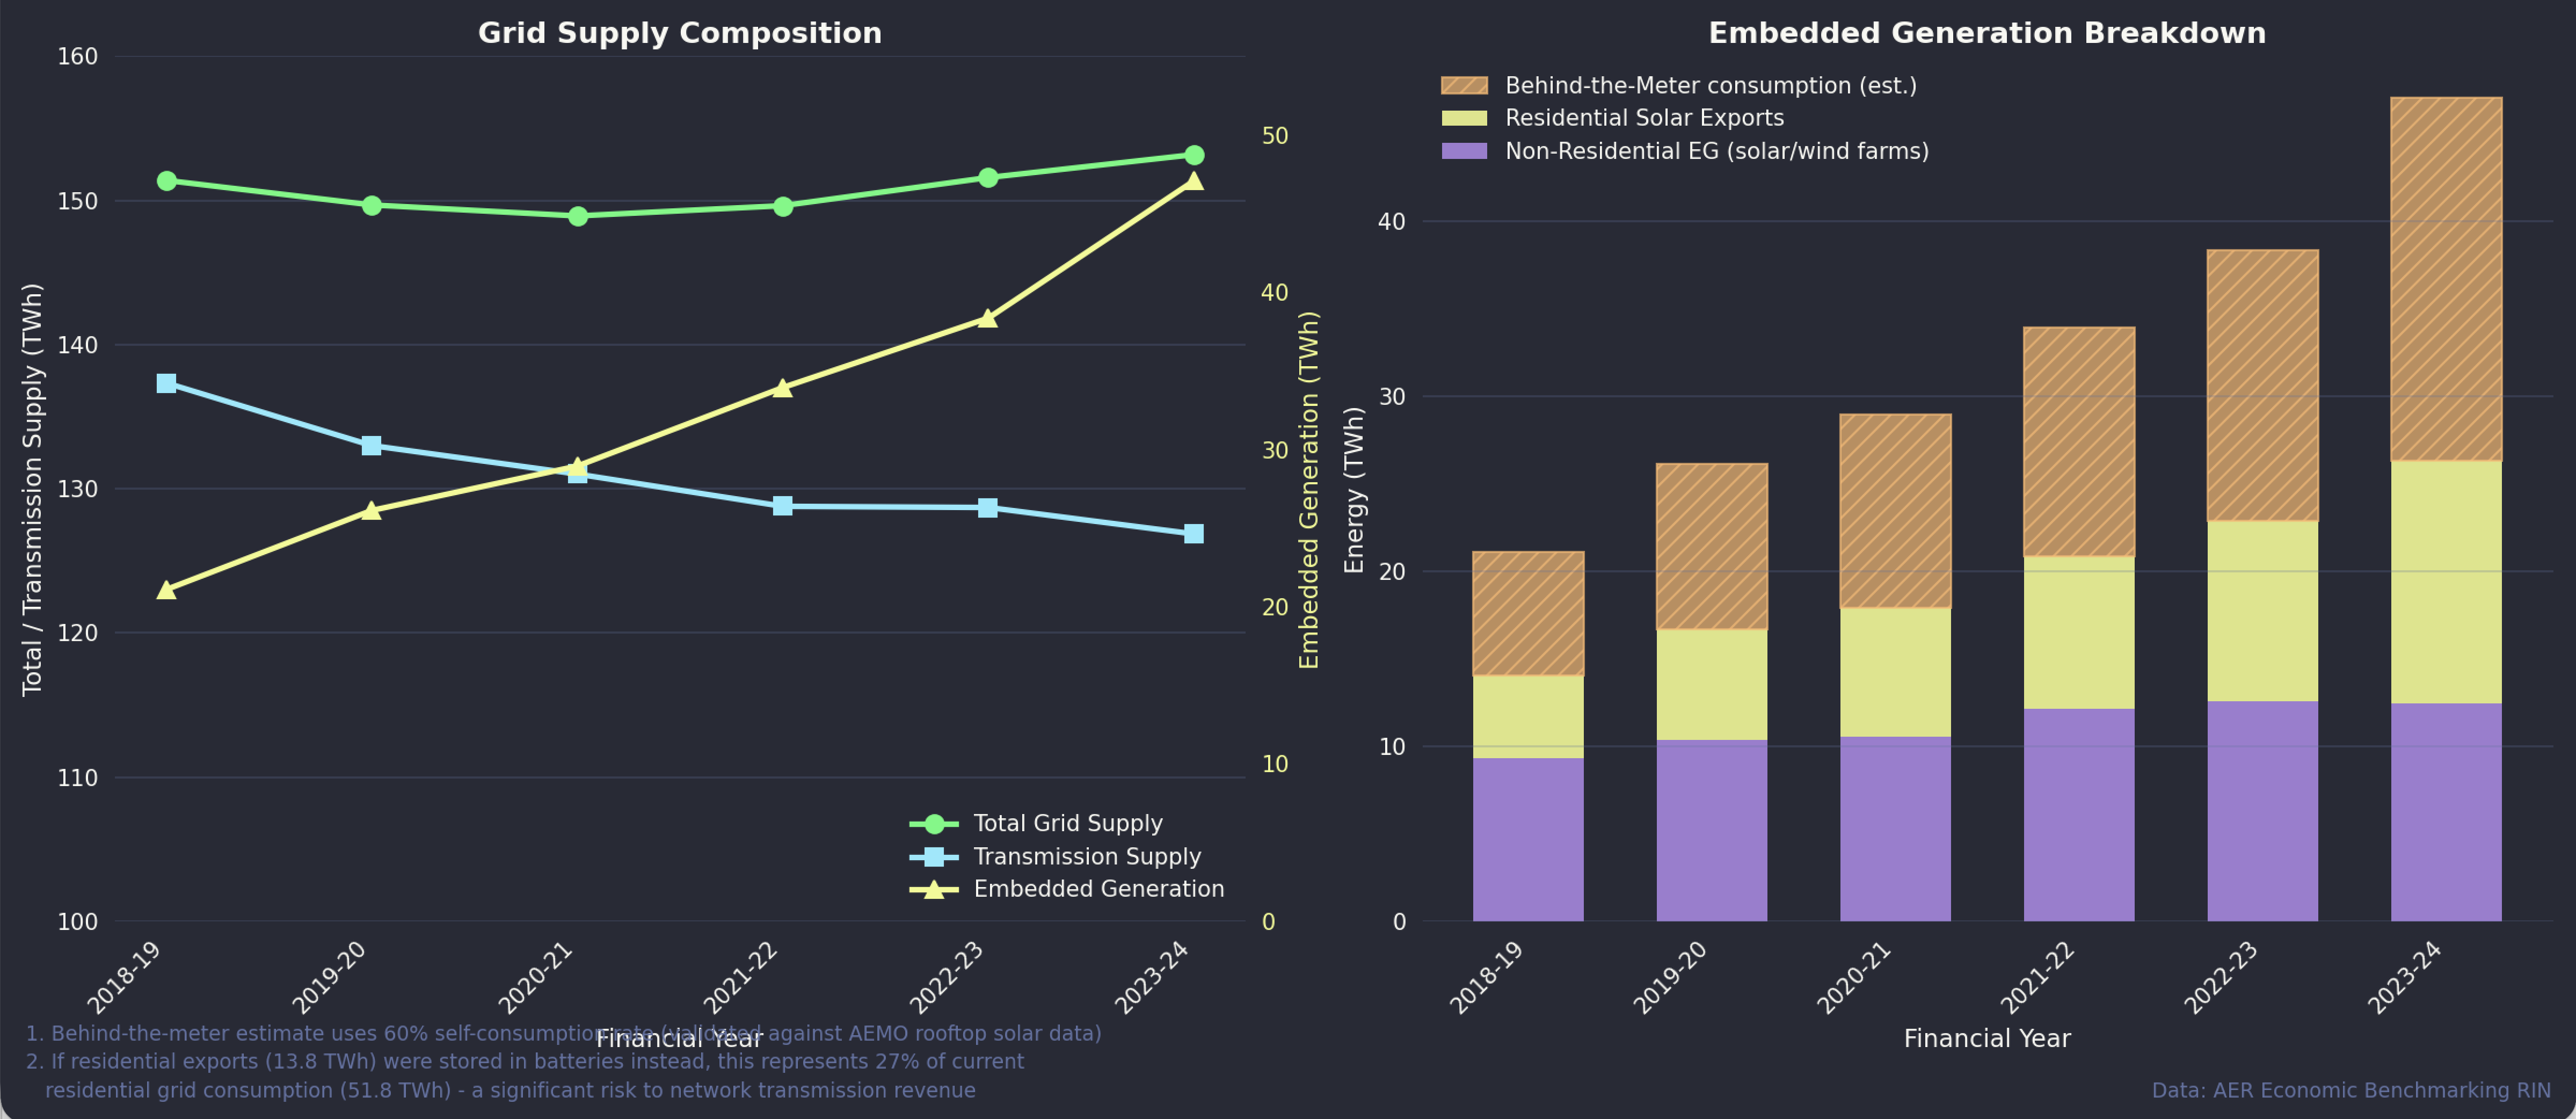
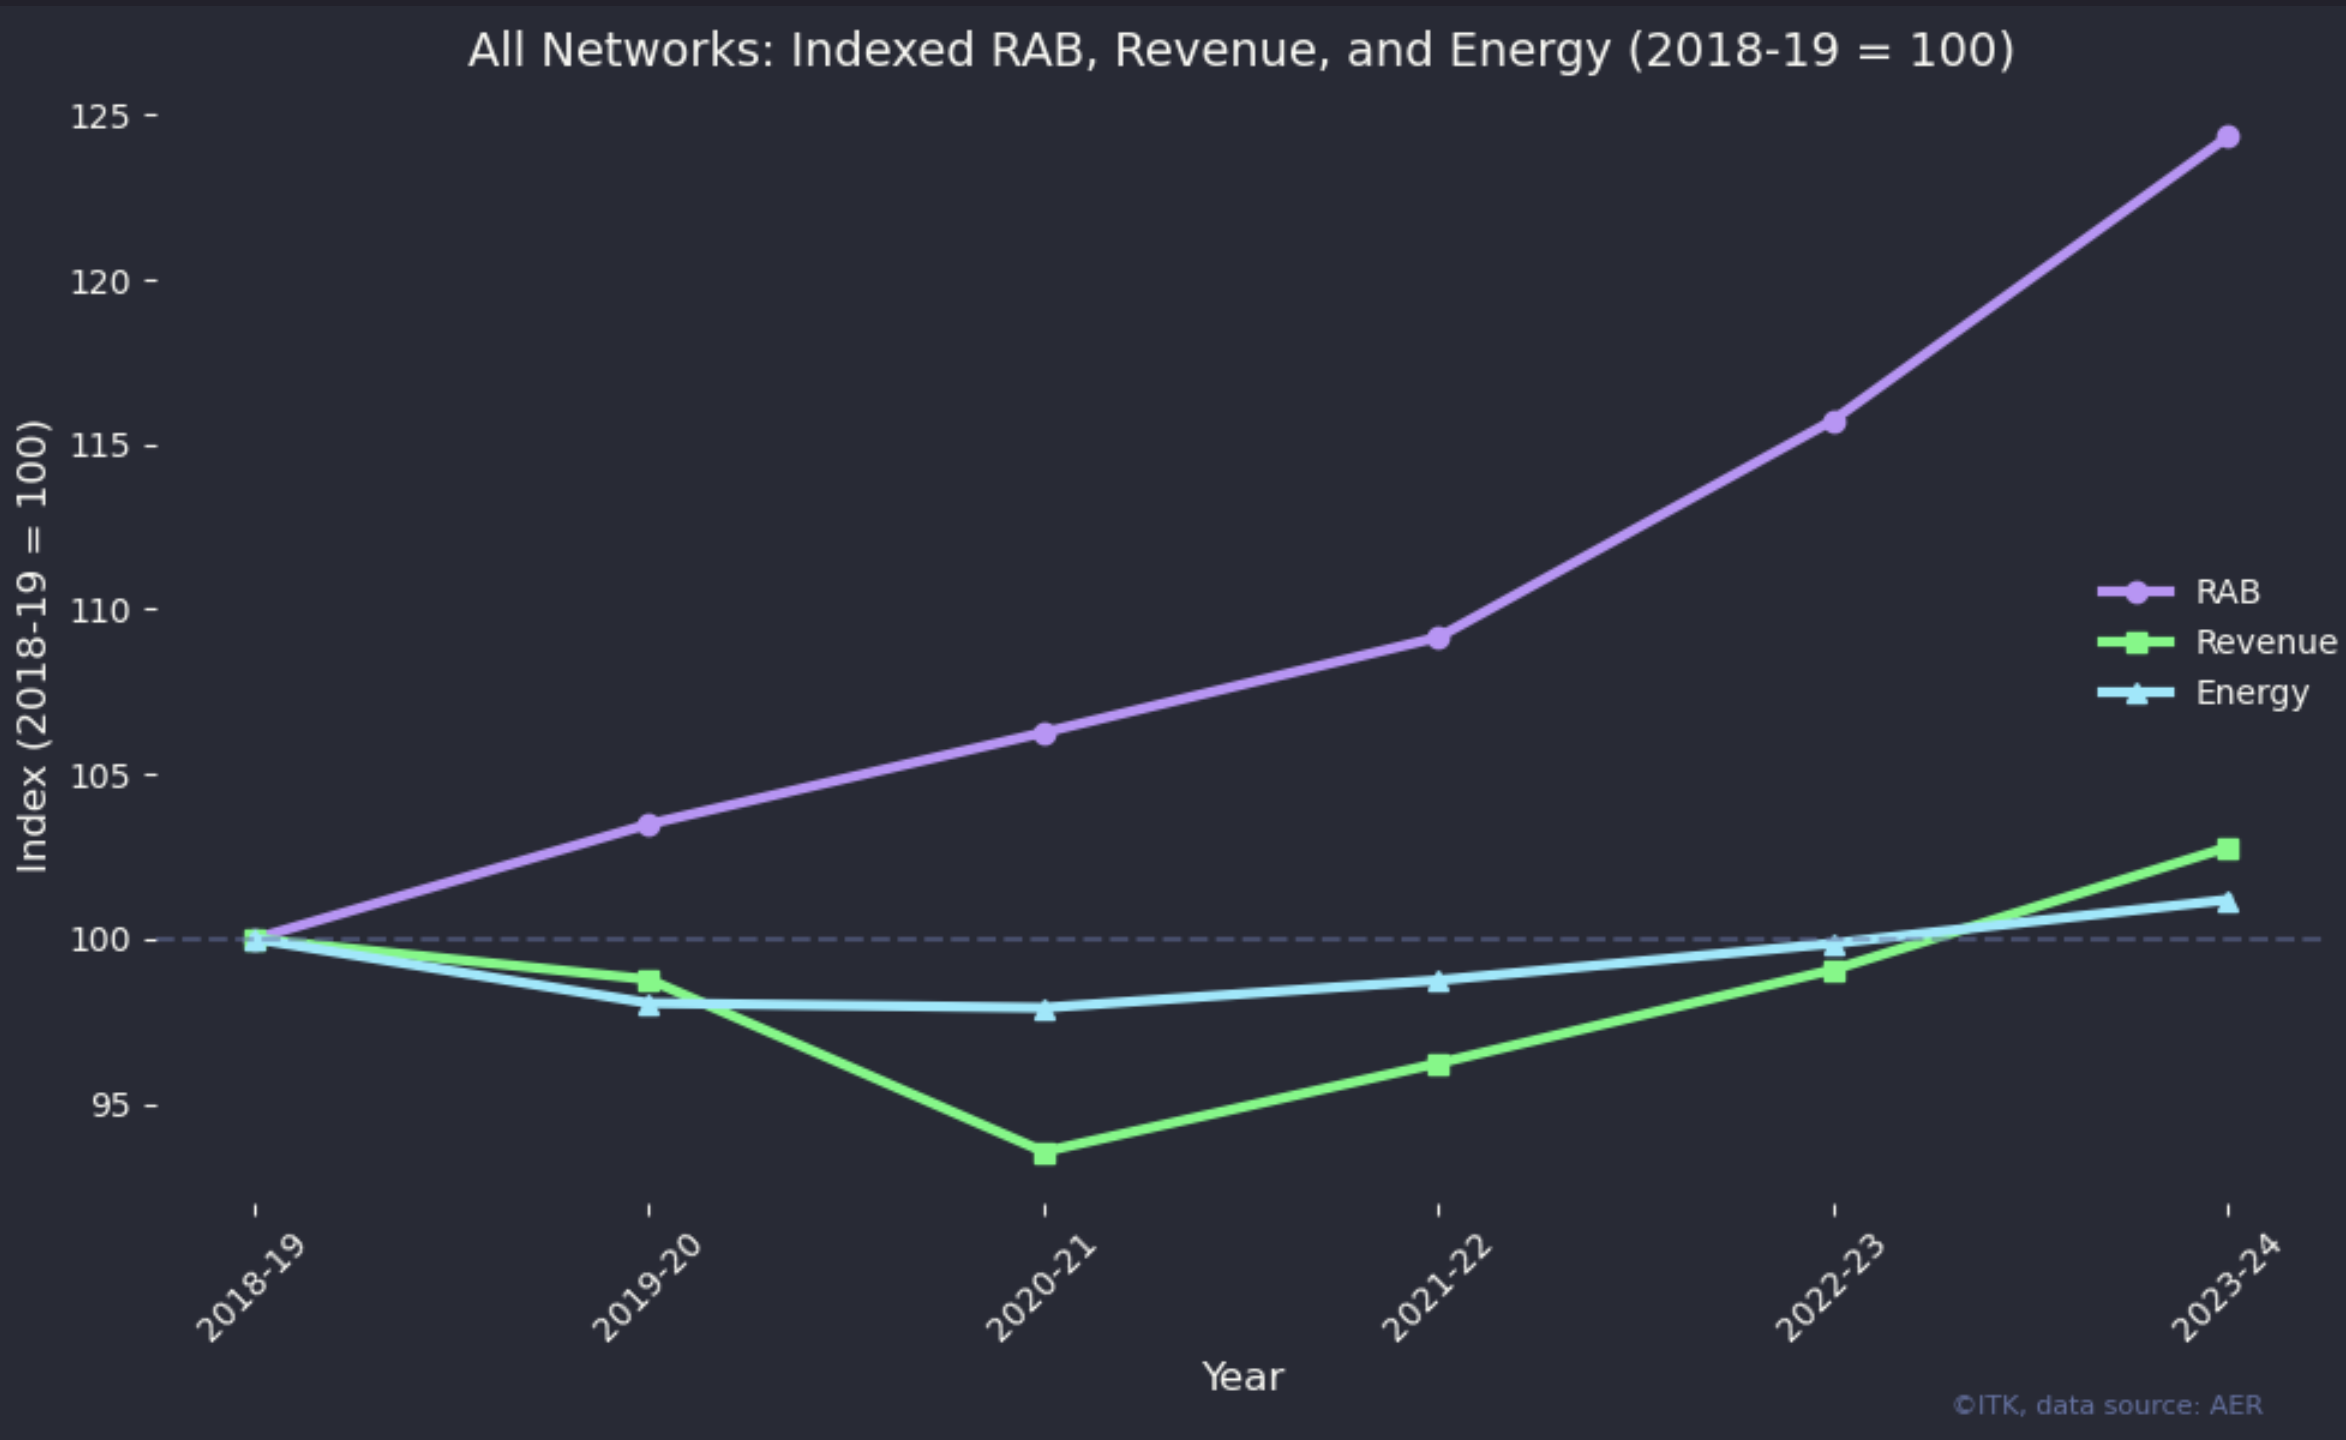
Most interesting chart from my aggregated RAB article.
12 January 2026
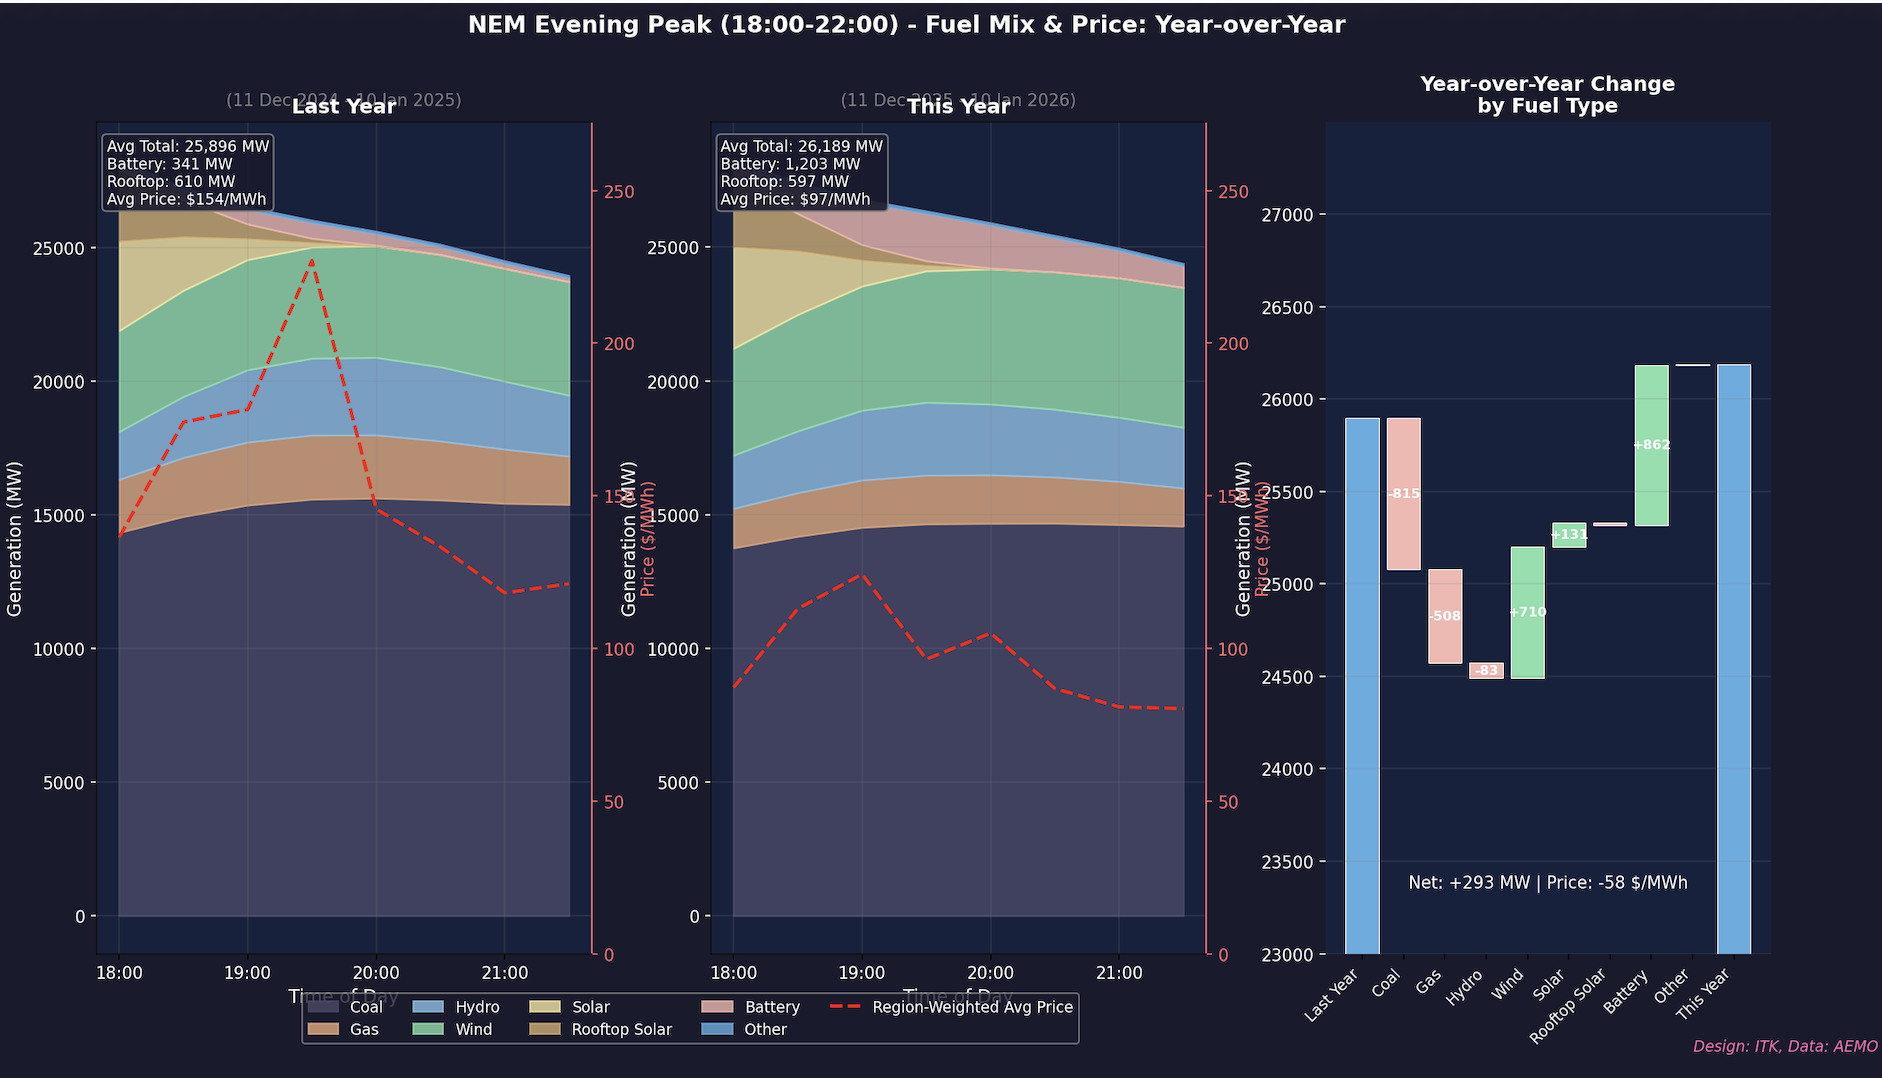
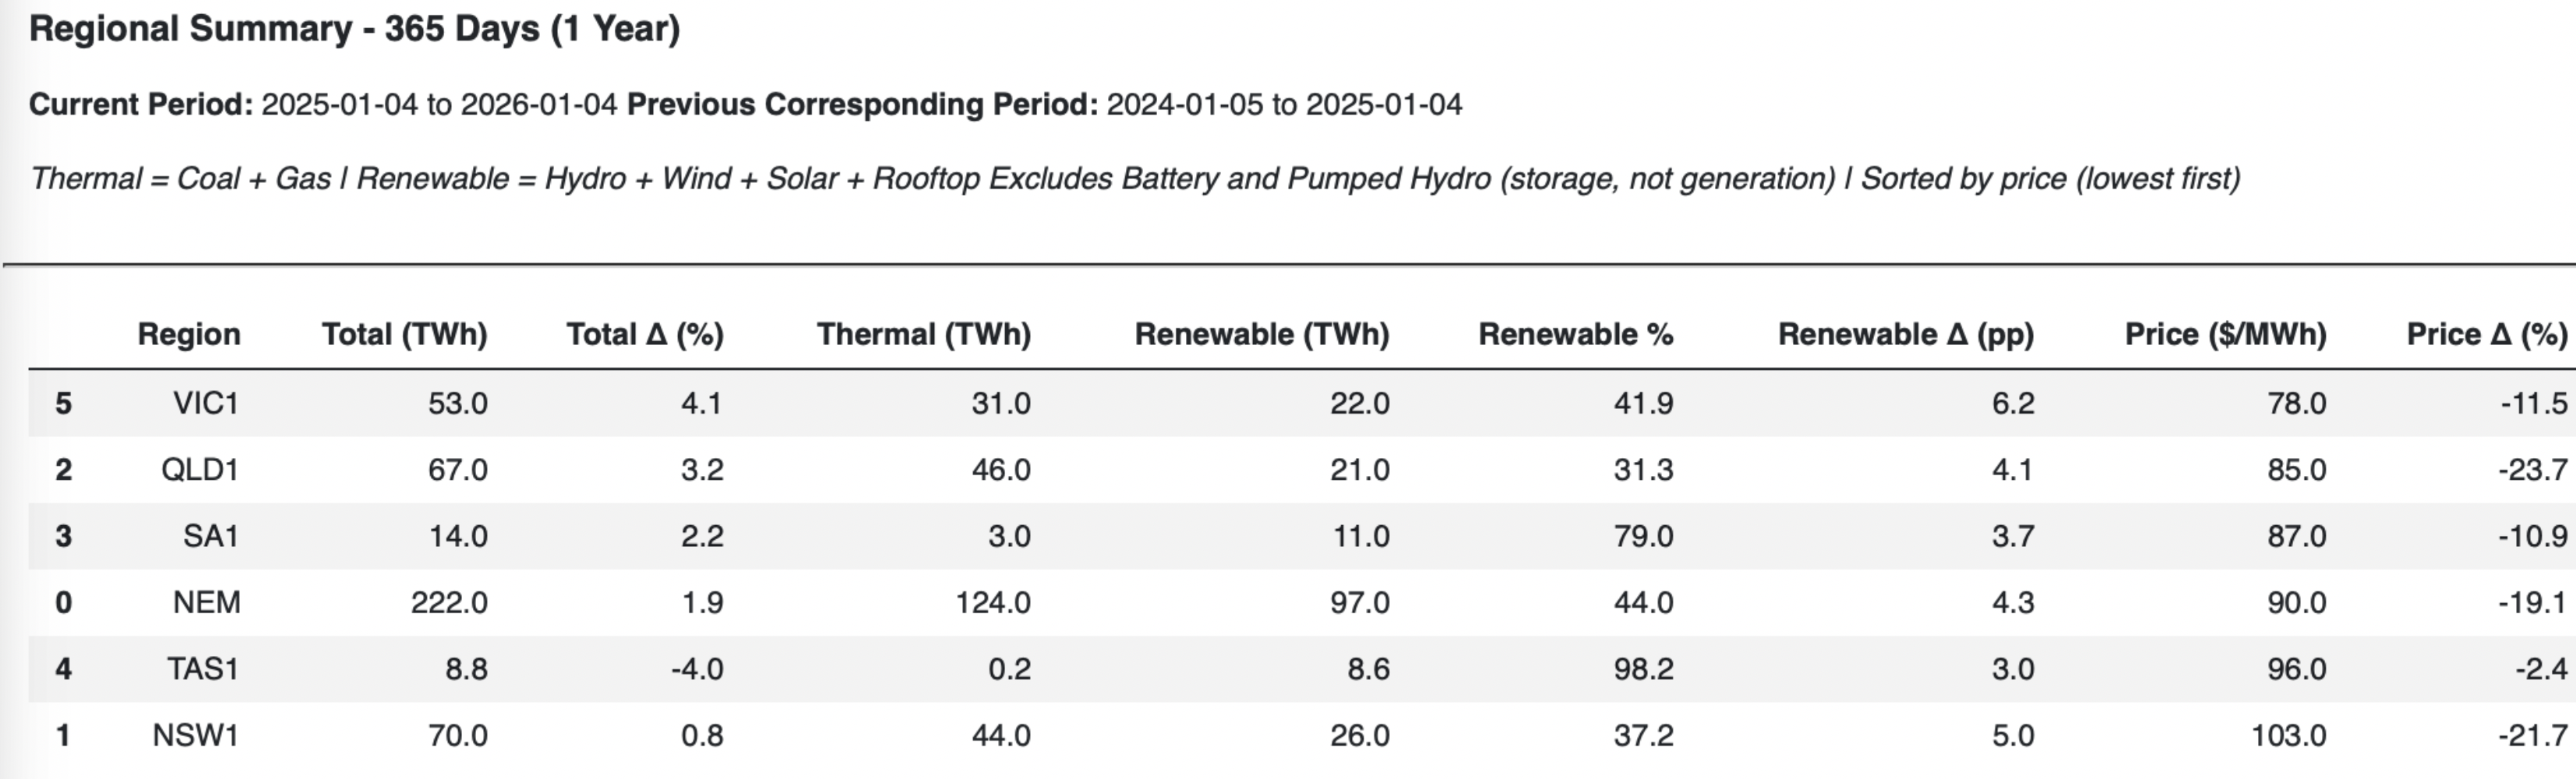
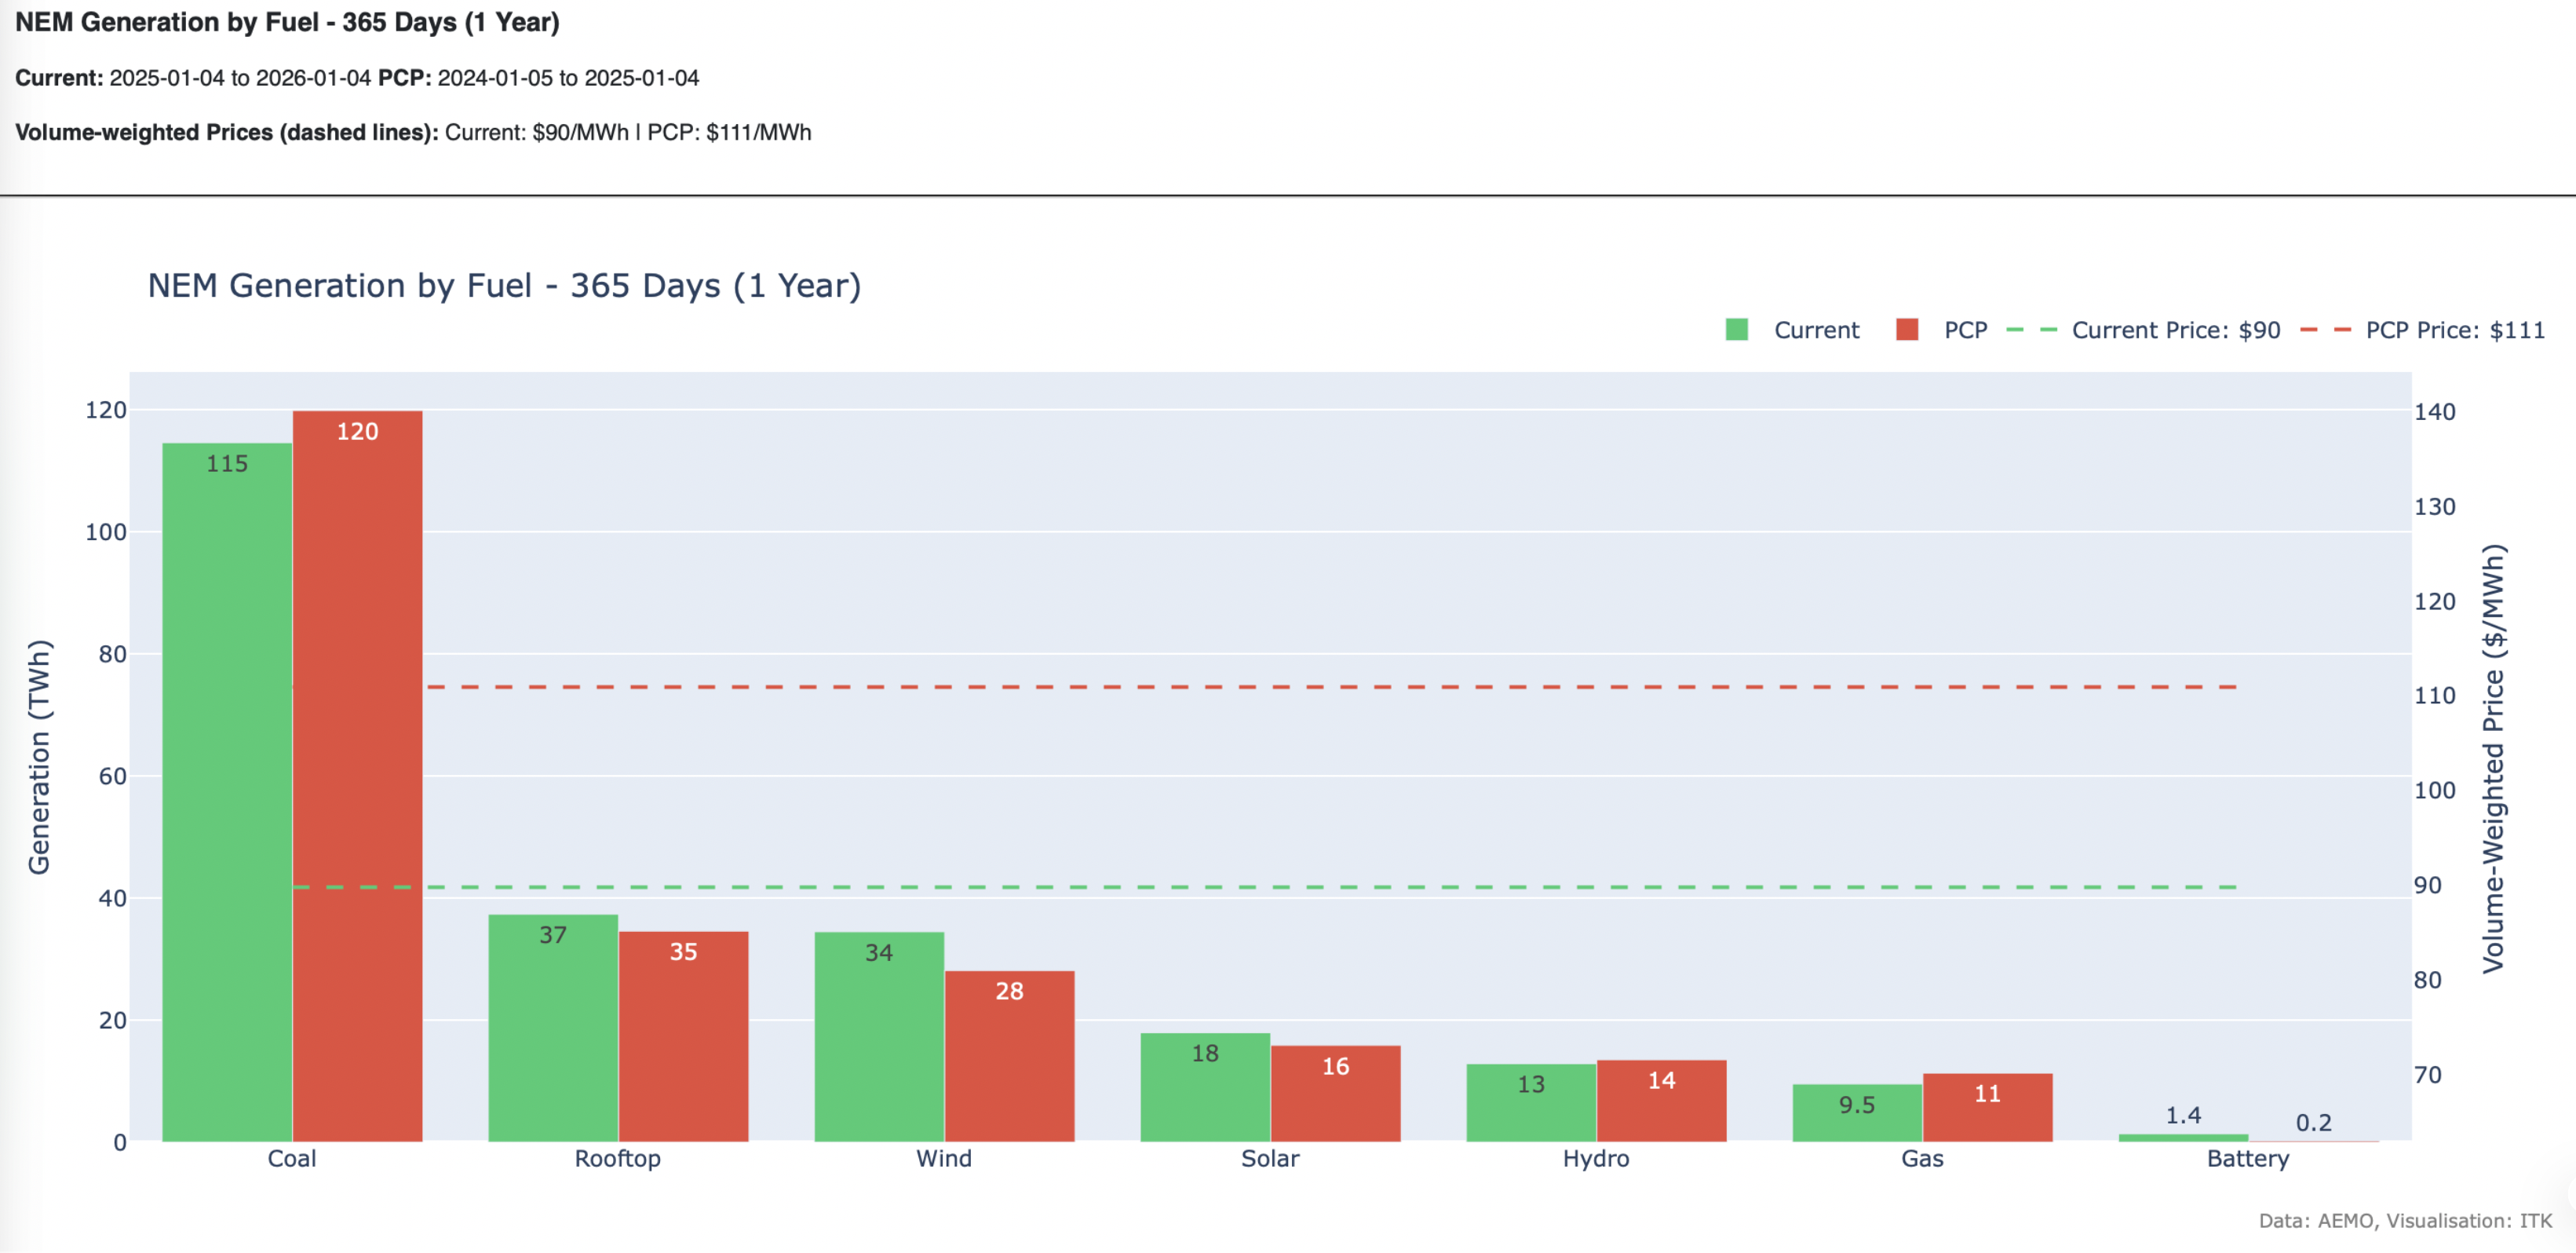
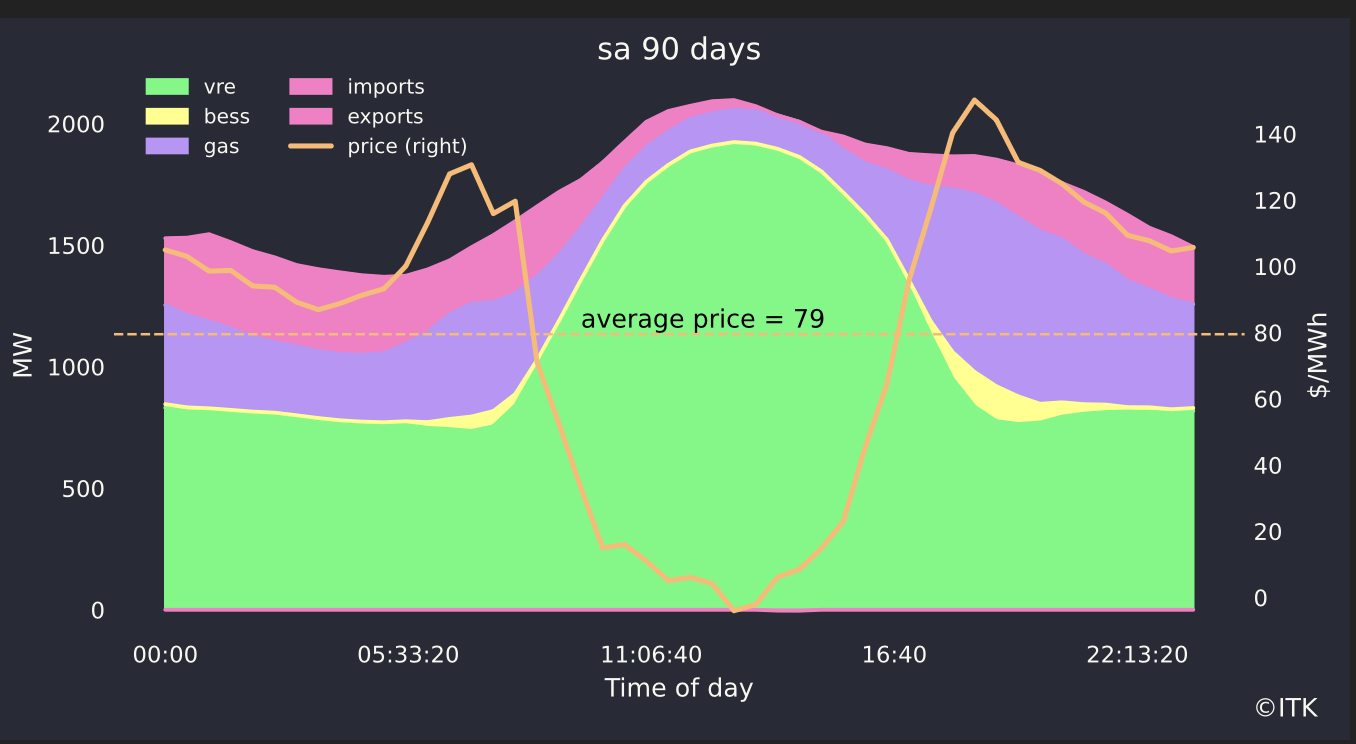
This plot shows that peak evening prices have on average fallen across the NEM in the past 30 days compared to the same period last year, and also that batteries have taken a significant share of that evening production. Wind is also up with the net result that coal and particularly gas are down. My hypothesis is that greater competition in that evening peak supply is the driver of lower prices, and that total supply in this key window will be volatile as lower prices push coal generation out of the system and this causes a fall in supply and a rise in prices, in turn stimulating more batteries and a repeat of the process.
10 January 2026
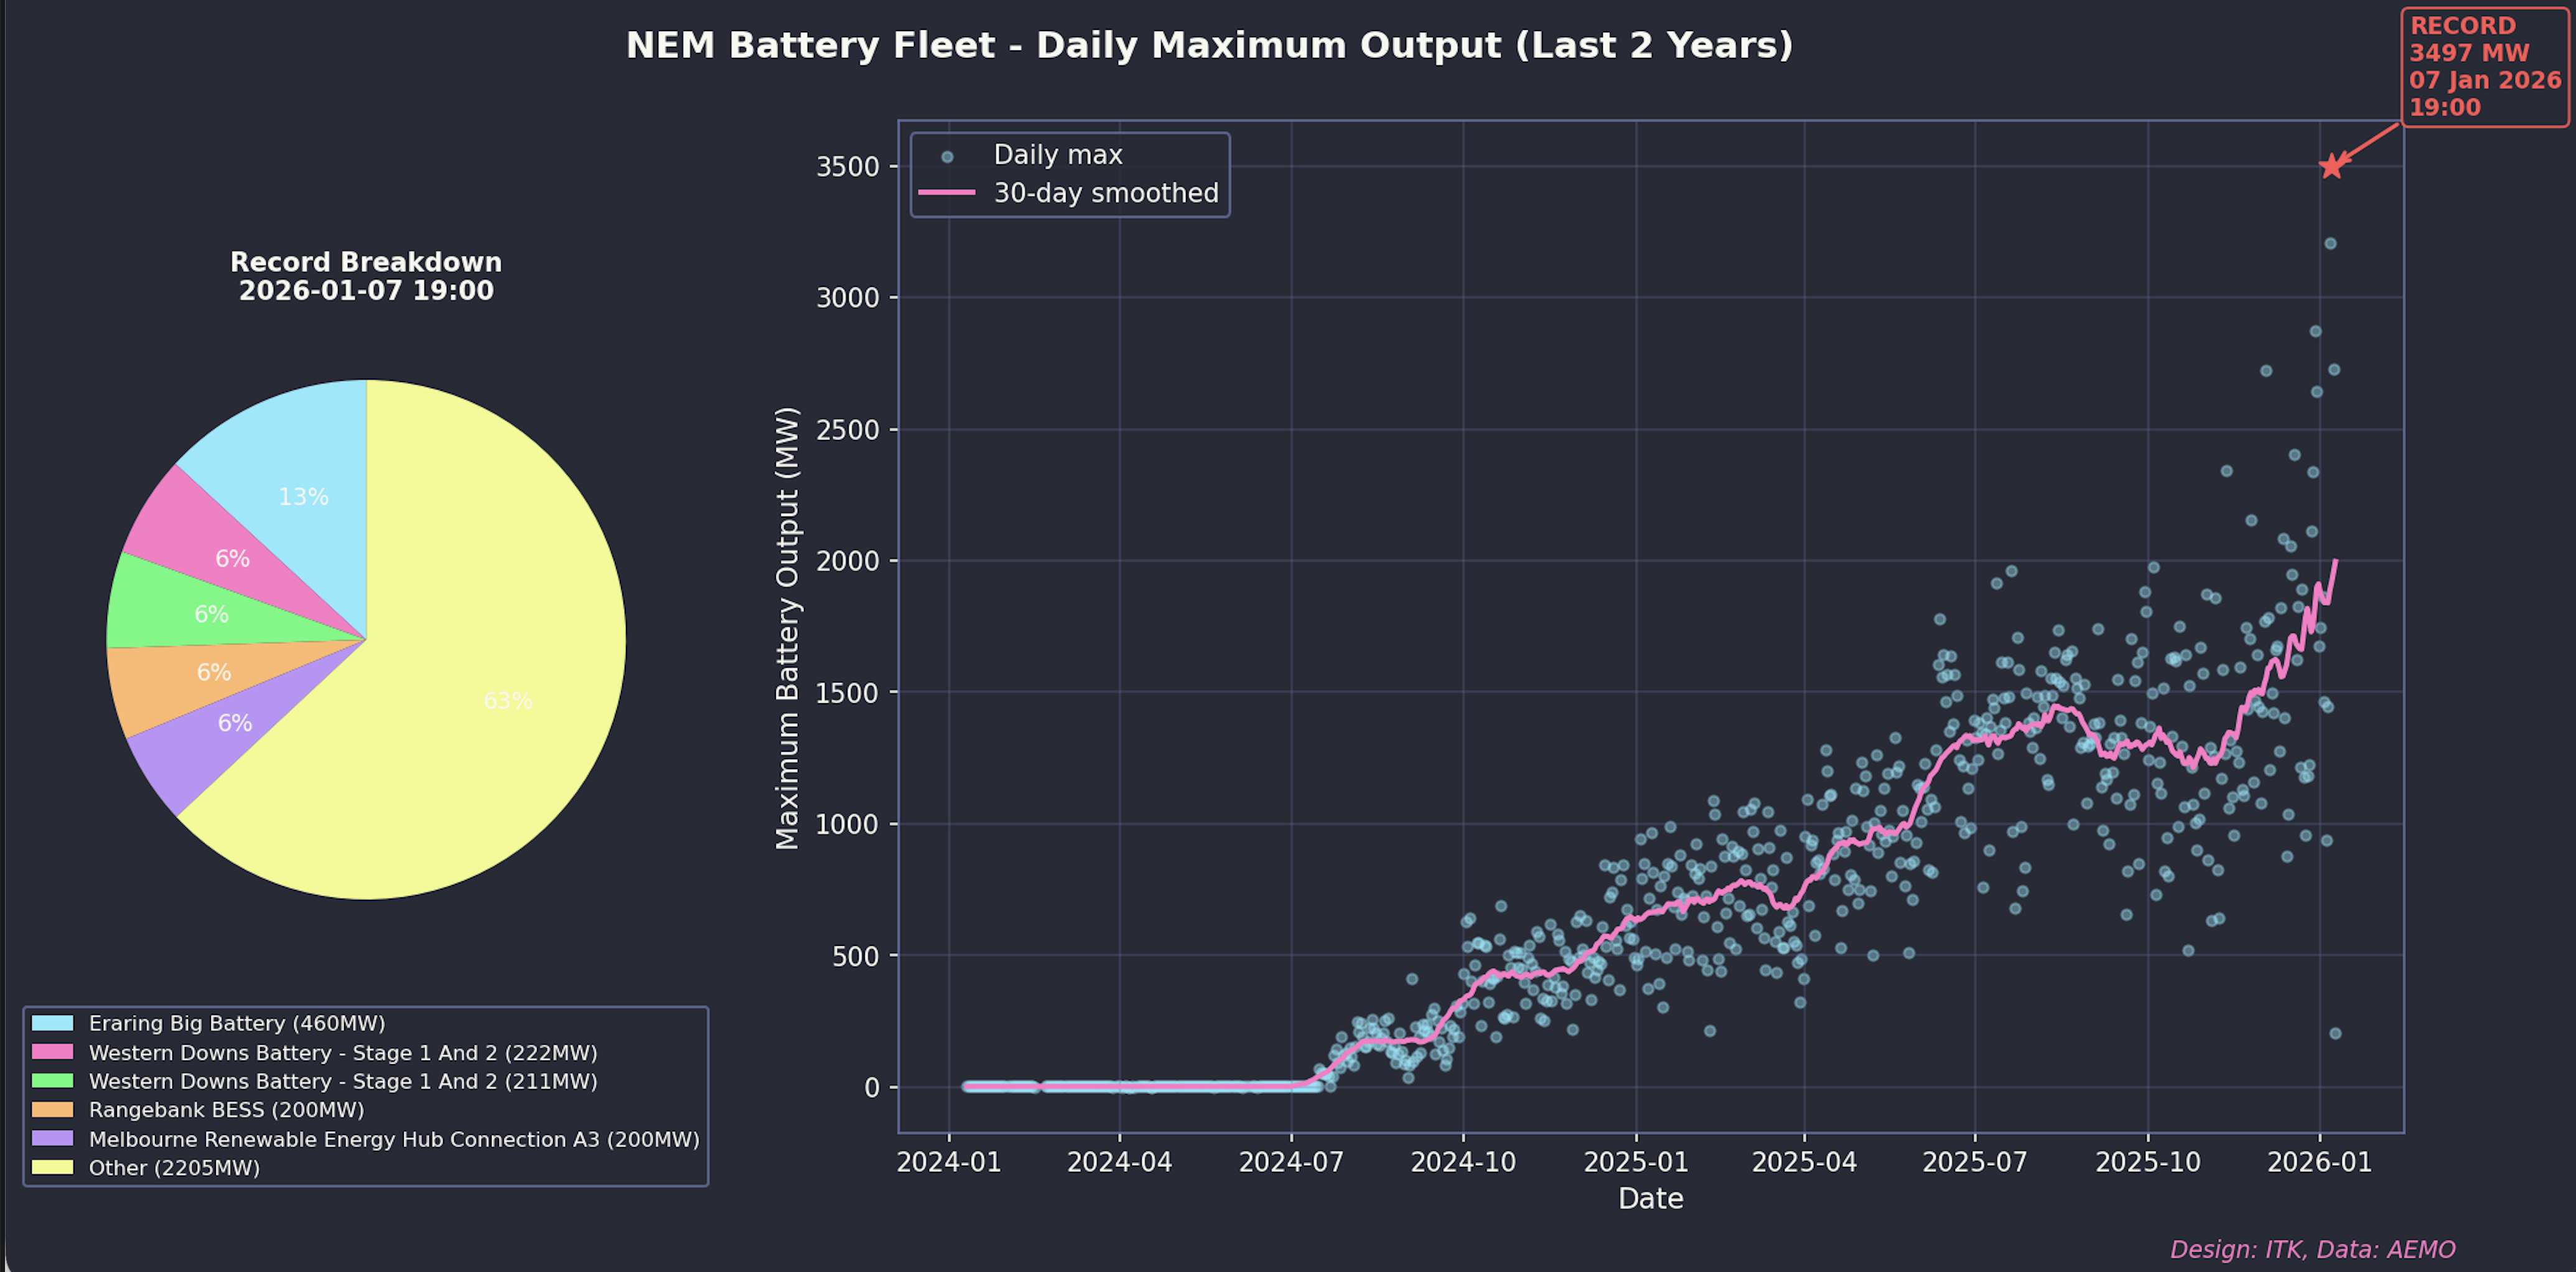
Probably already out of date but this plot shows the progress of utility batteries in the NEM to date. Lots more coming of course.
9 January 2026
Too long updating this front page. Faster and more effective readership on reneweconomy and linkedin mean that’s where the short posts have gone. All articles still published here and generally in a better format than Reneweconomy can achieve. Nevertheless will be endeavouring to update this page regularly.
Starting with a look back at somethings from 2025 and noting of course that in the Dec quarter renewables were over 50%.
All data sourced from AEMO newweb and collected via my data collectors also used on the big dashboard. As far as I can tell the data downloading is pretty good and I do personally rely on the data and analysis drawn from it.
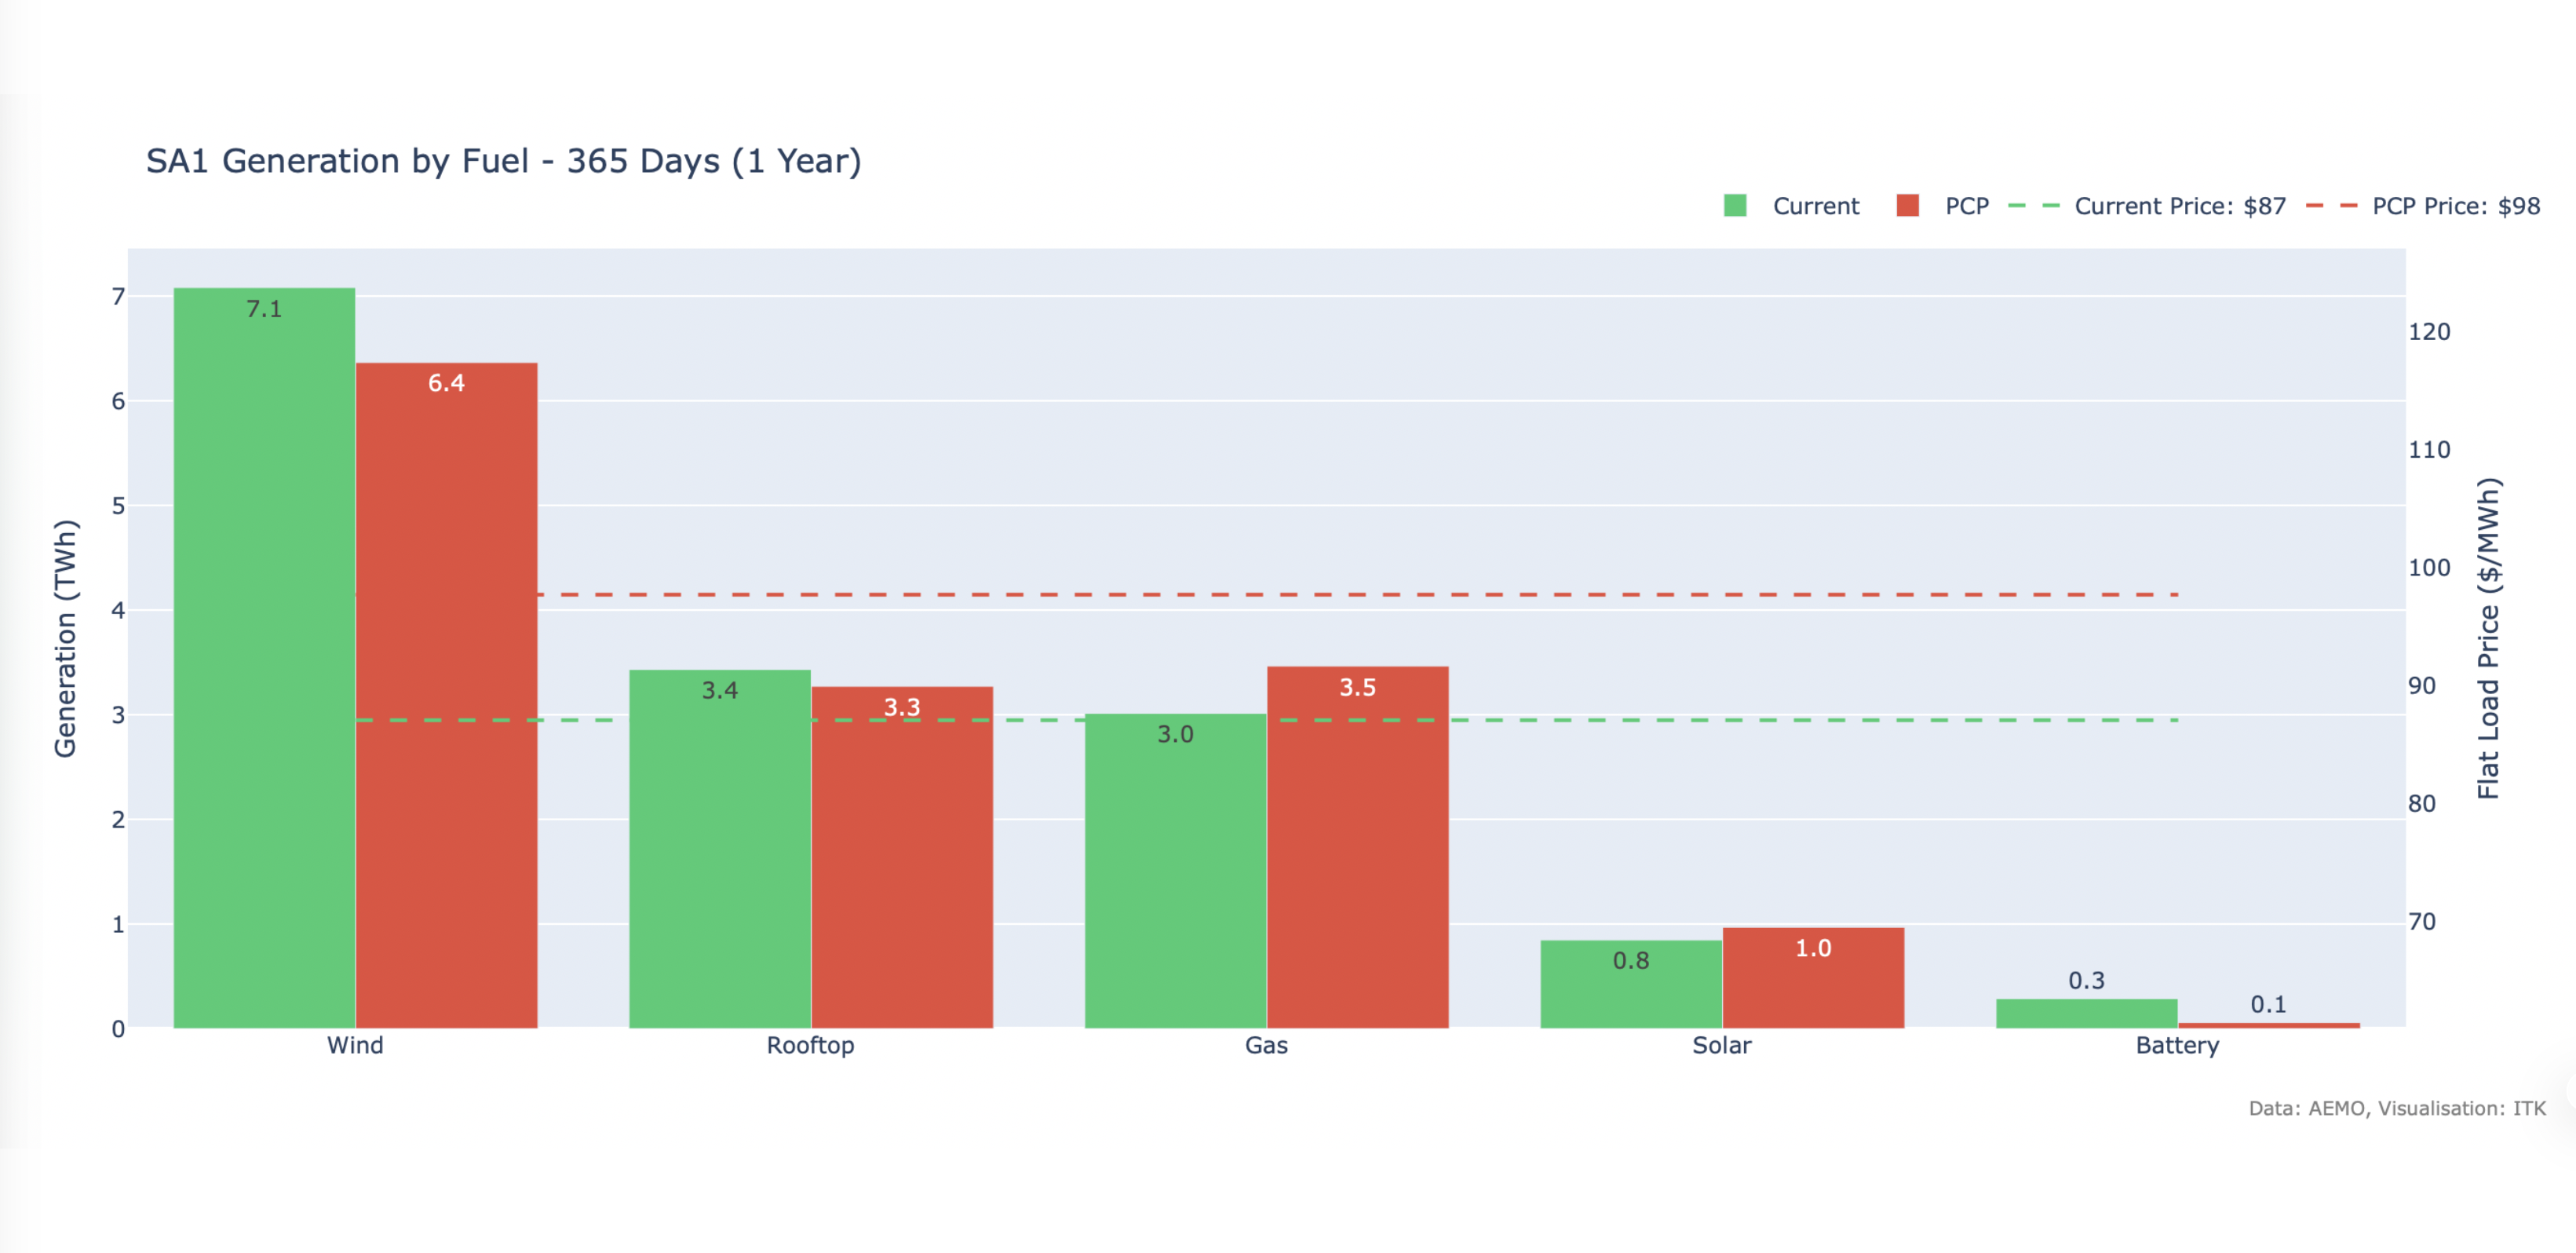
SA shows gas now in third place, excluding imports, a very promising sign for lower average prices in my opinion..
Some big drops in coal station spot revenue during the year. Spot revenue is only one indicator but, in my opinion, still of interest. I
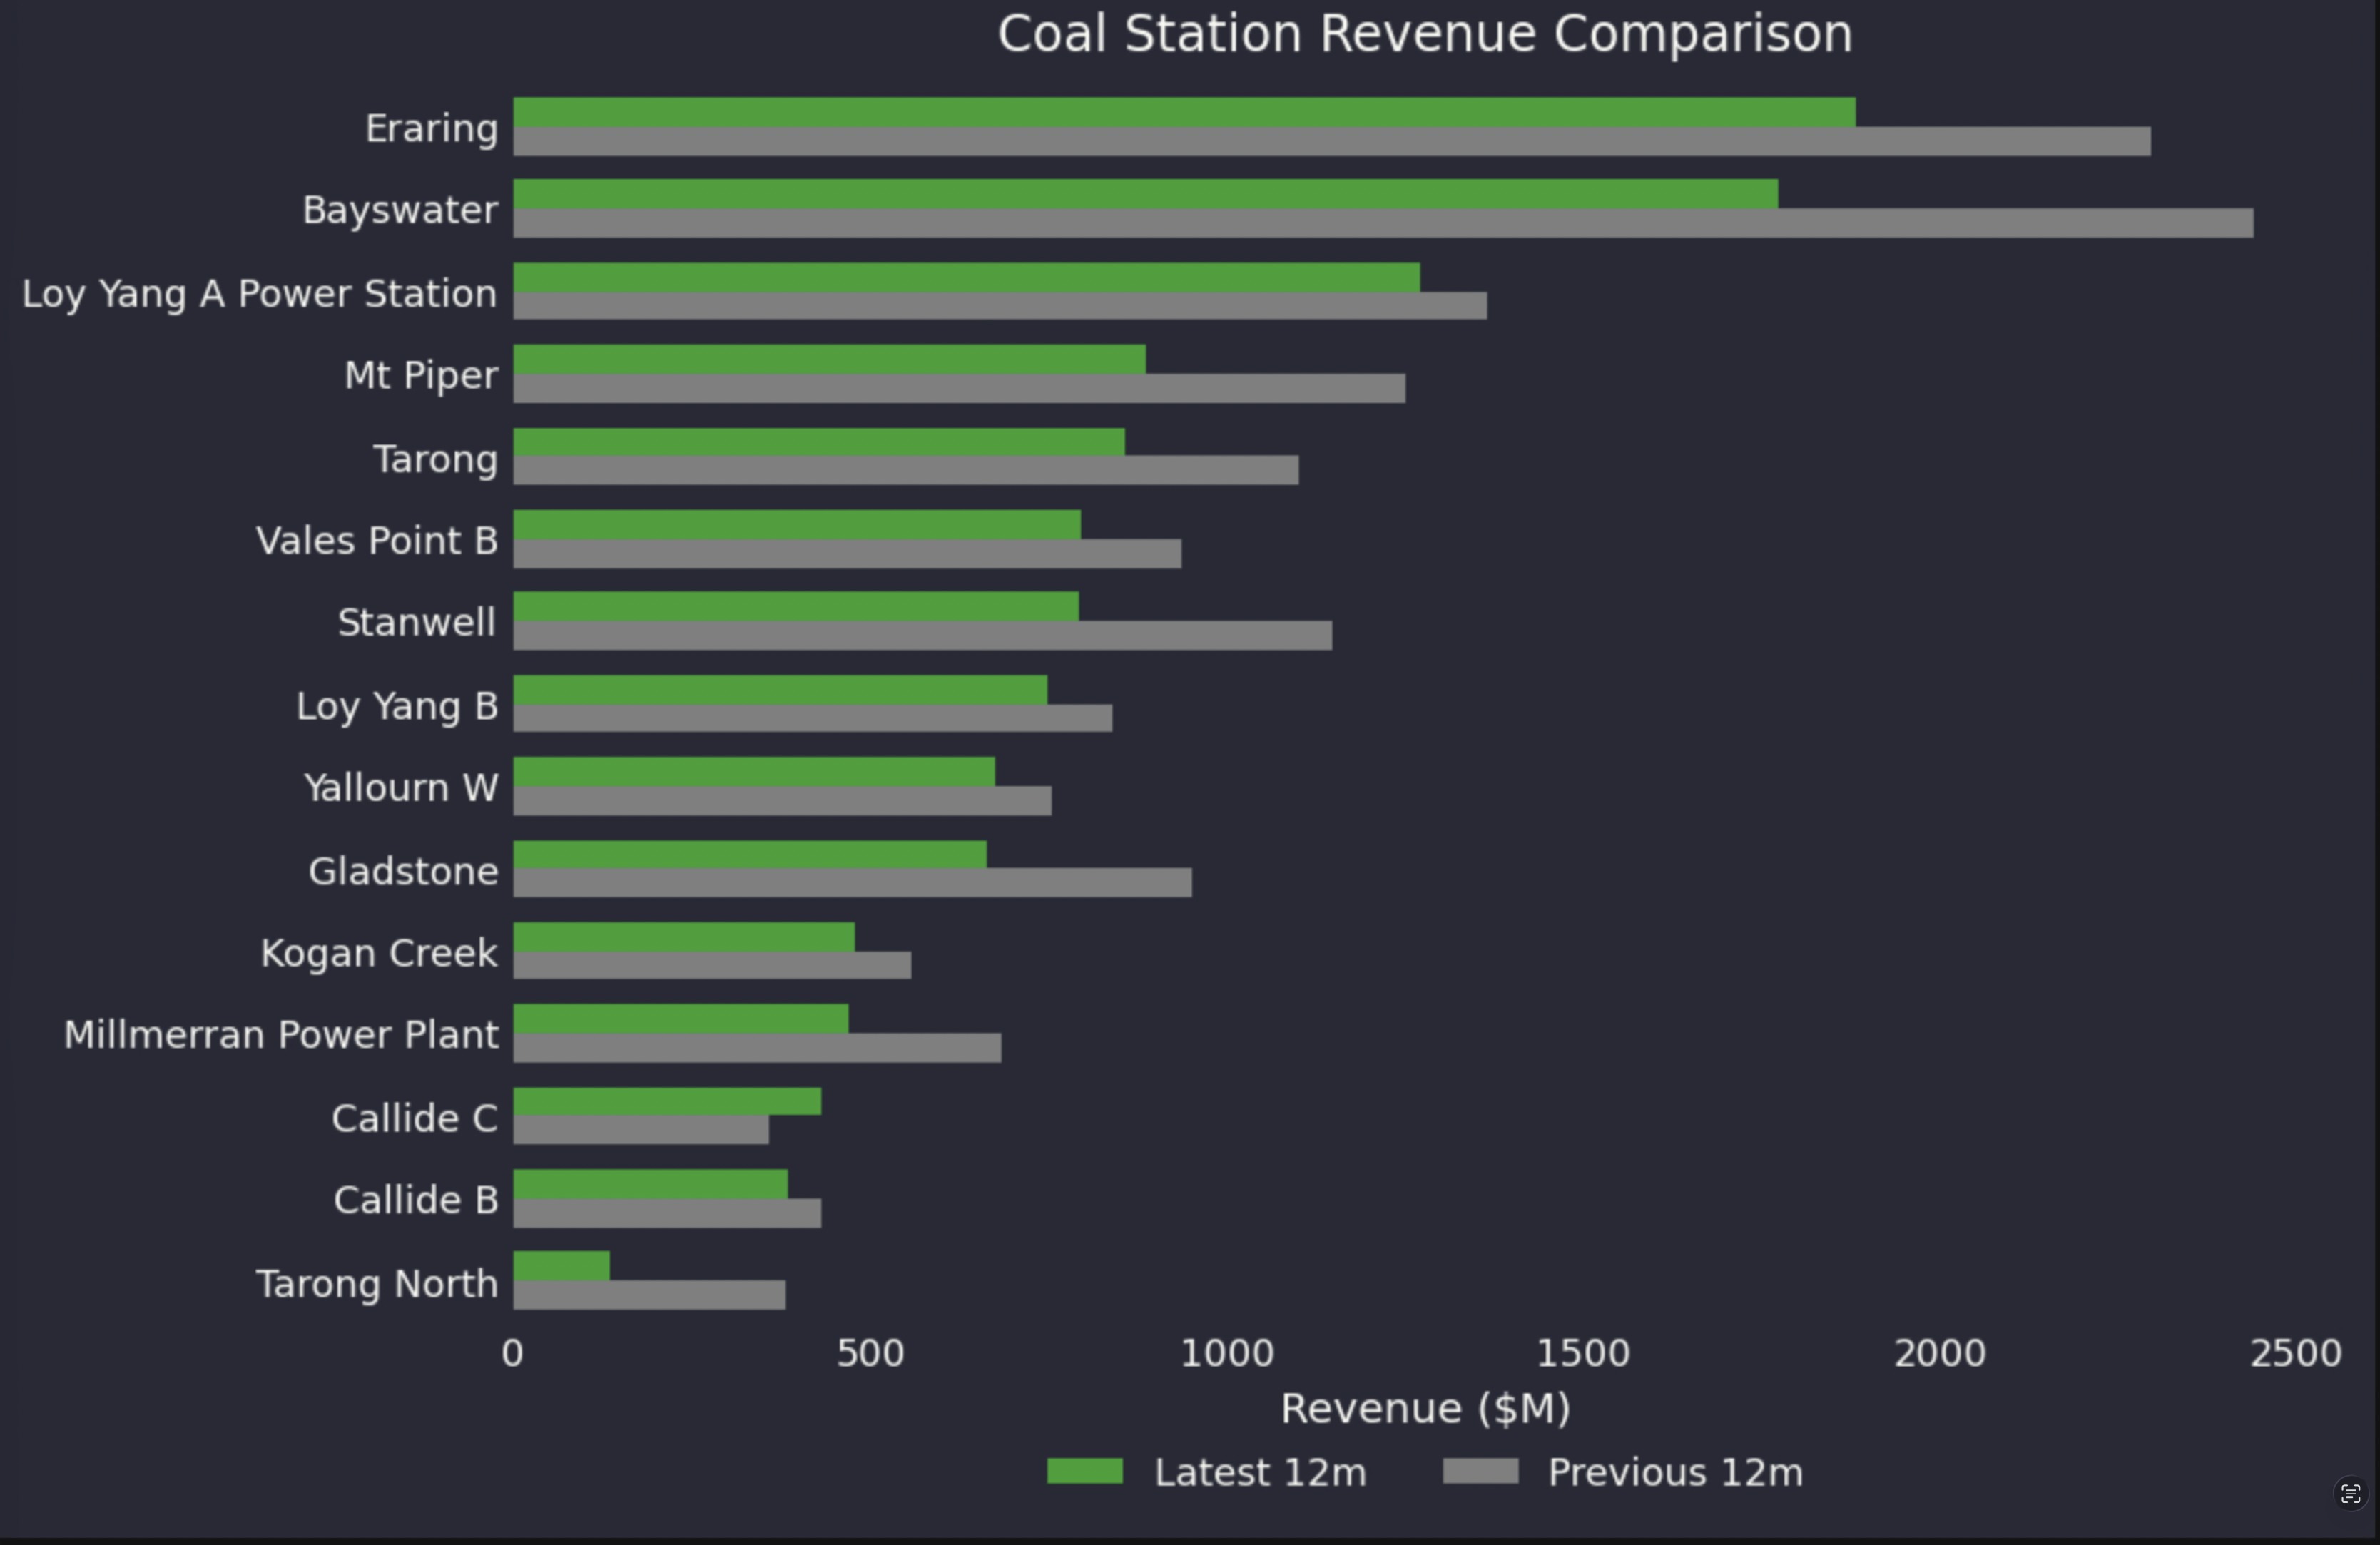
I picked a bigger and generally better performing coal generator from each of NSW, QLD and Victoria .
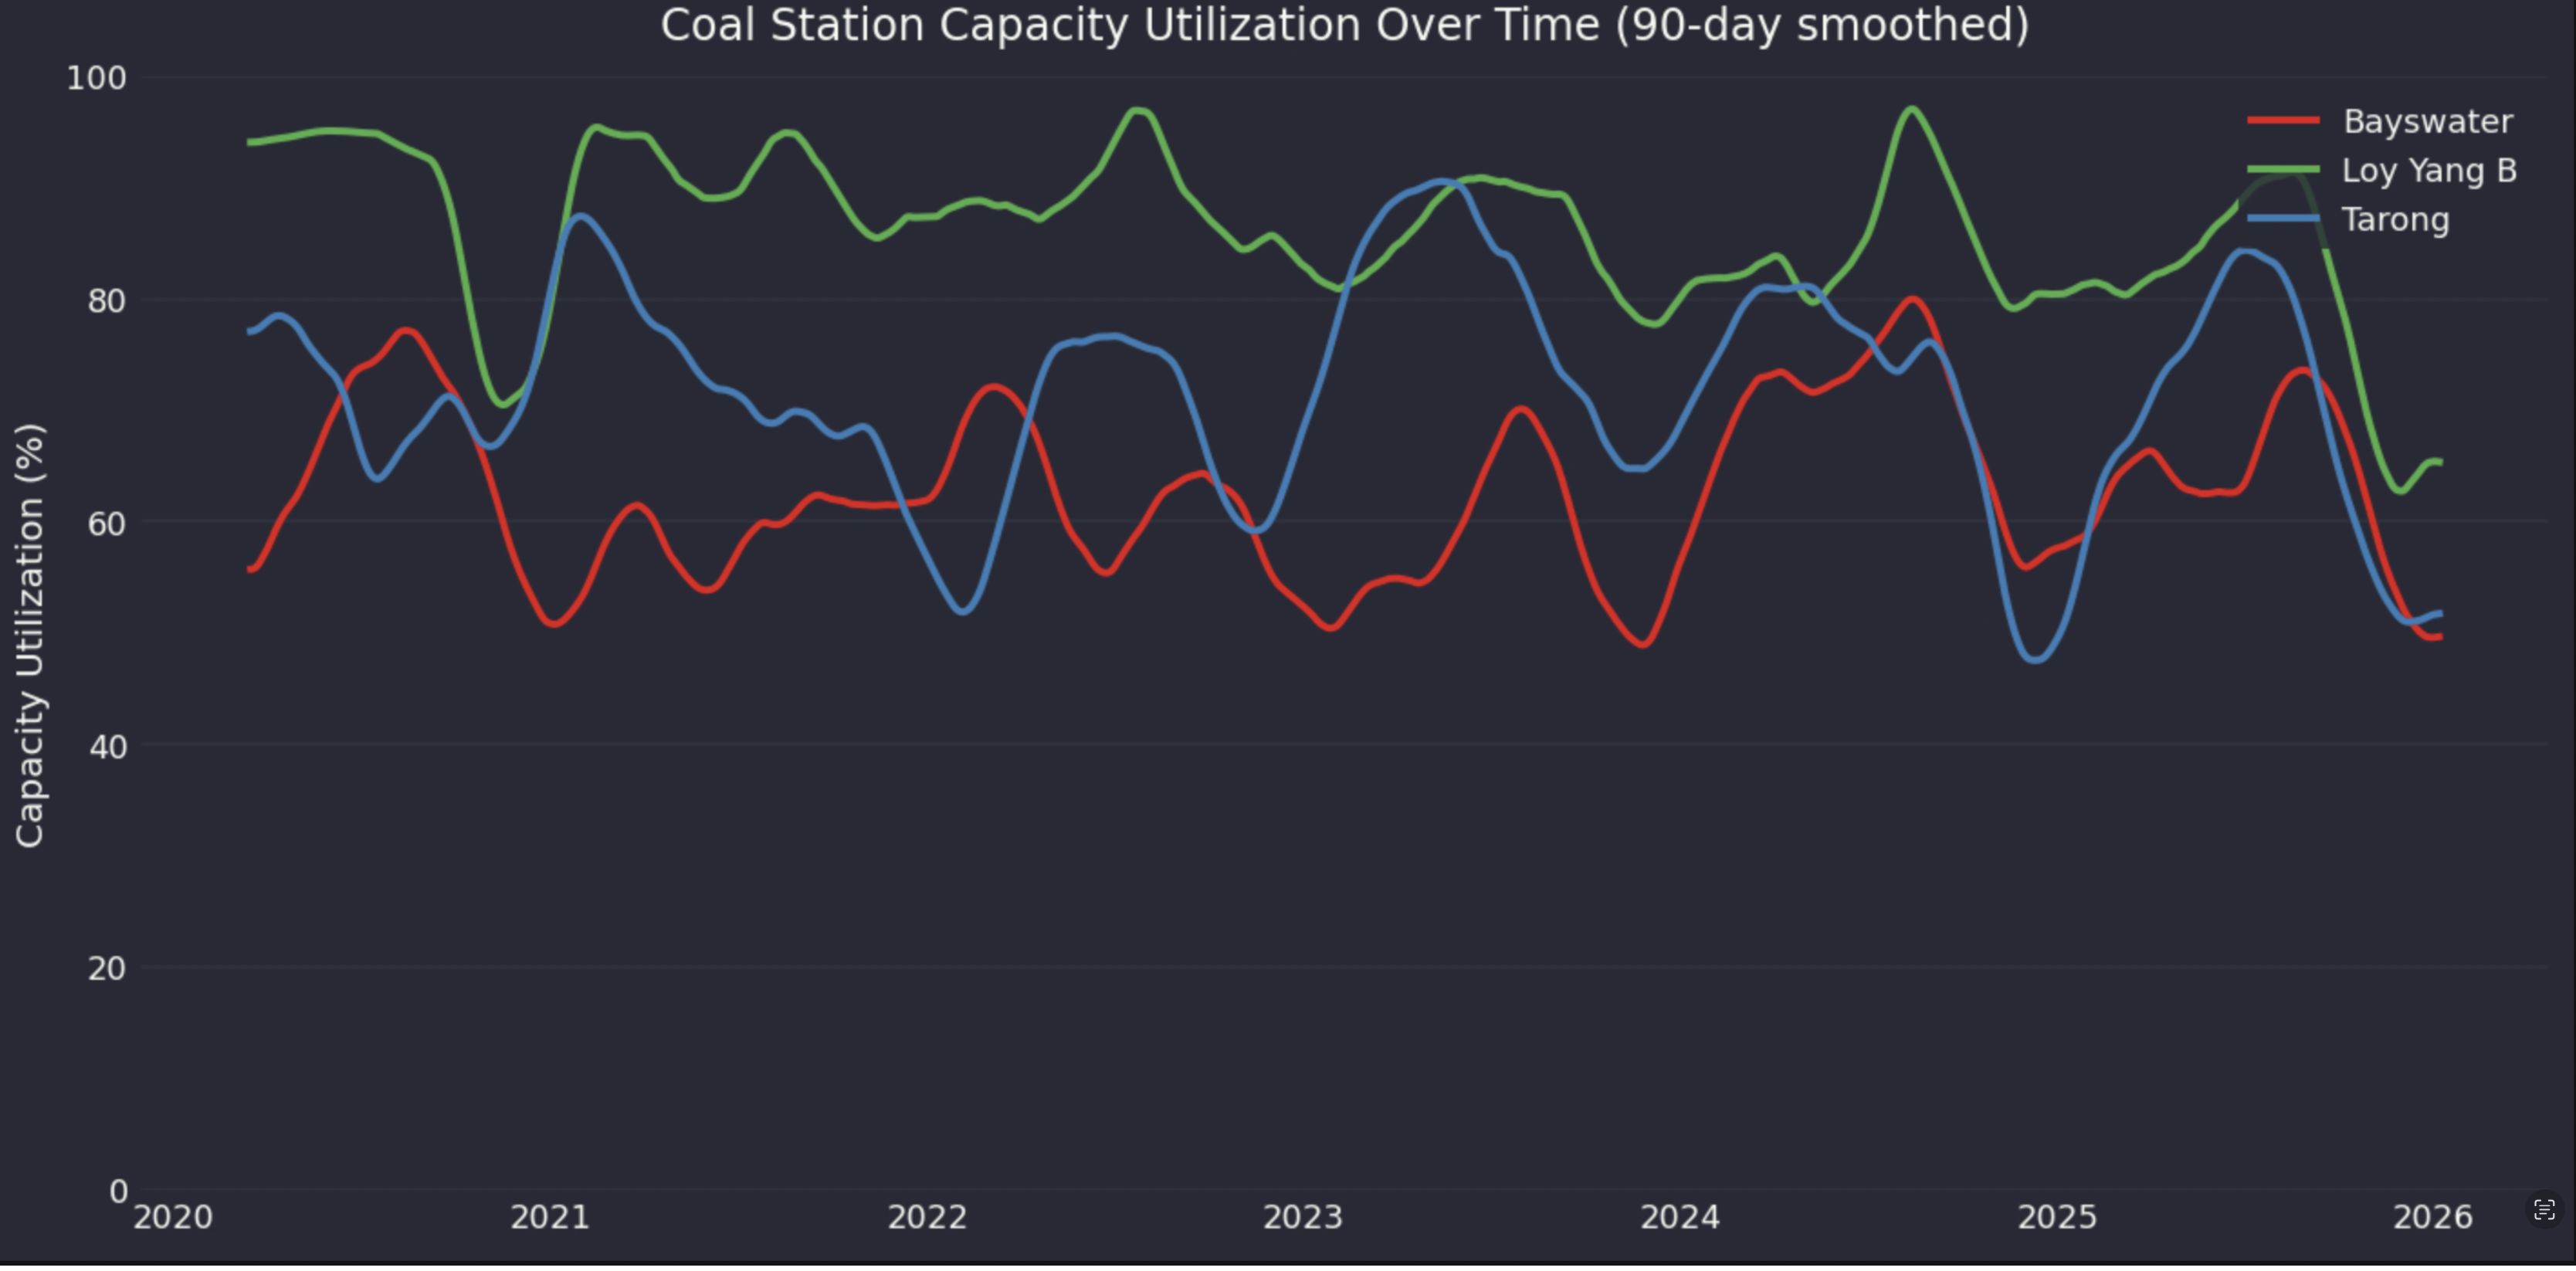
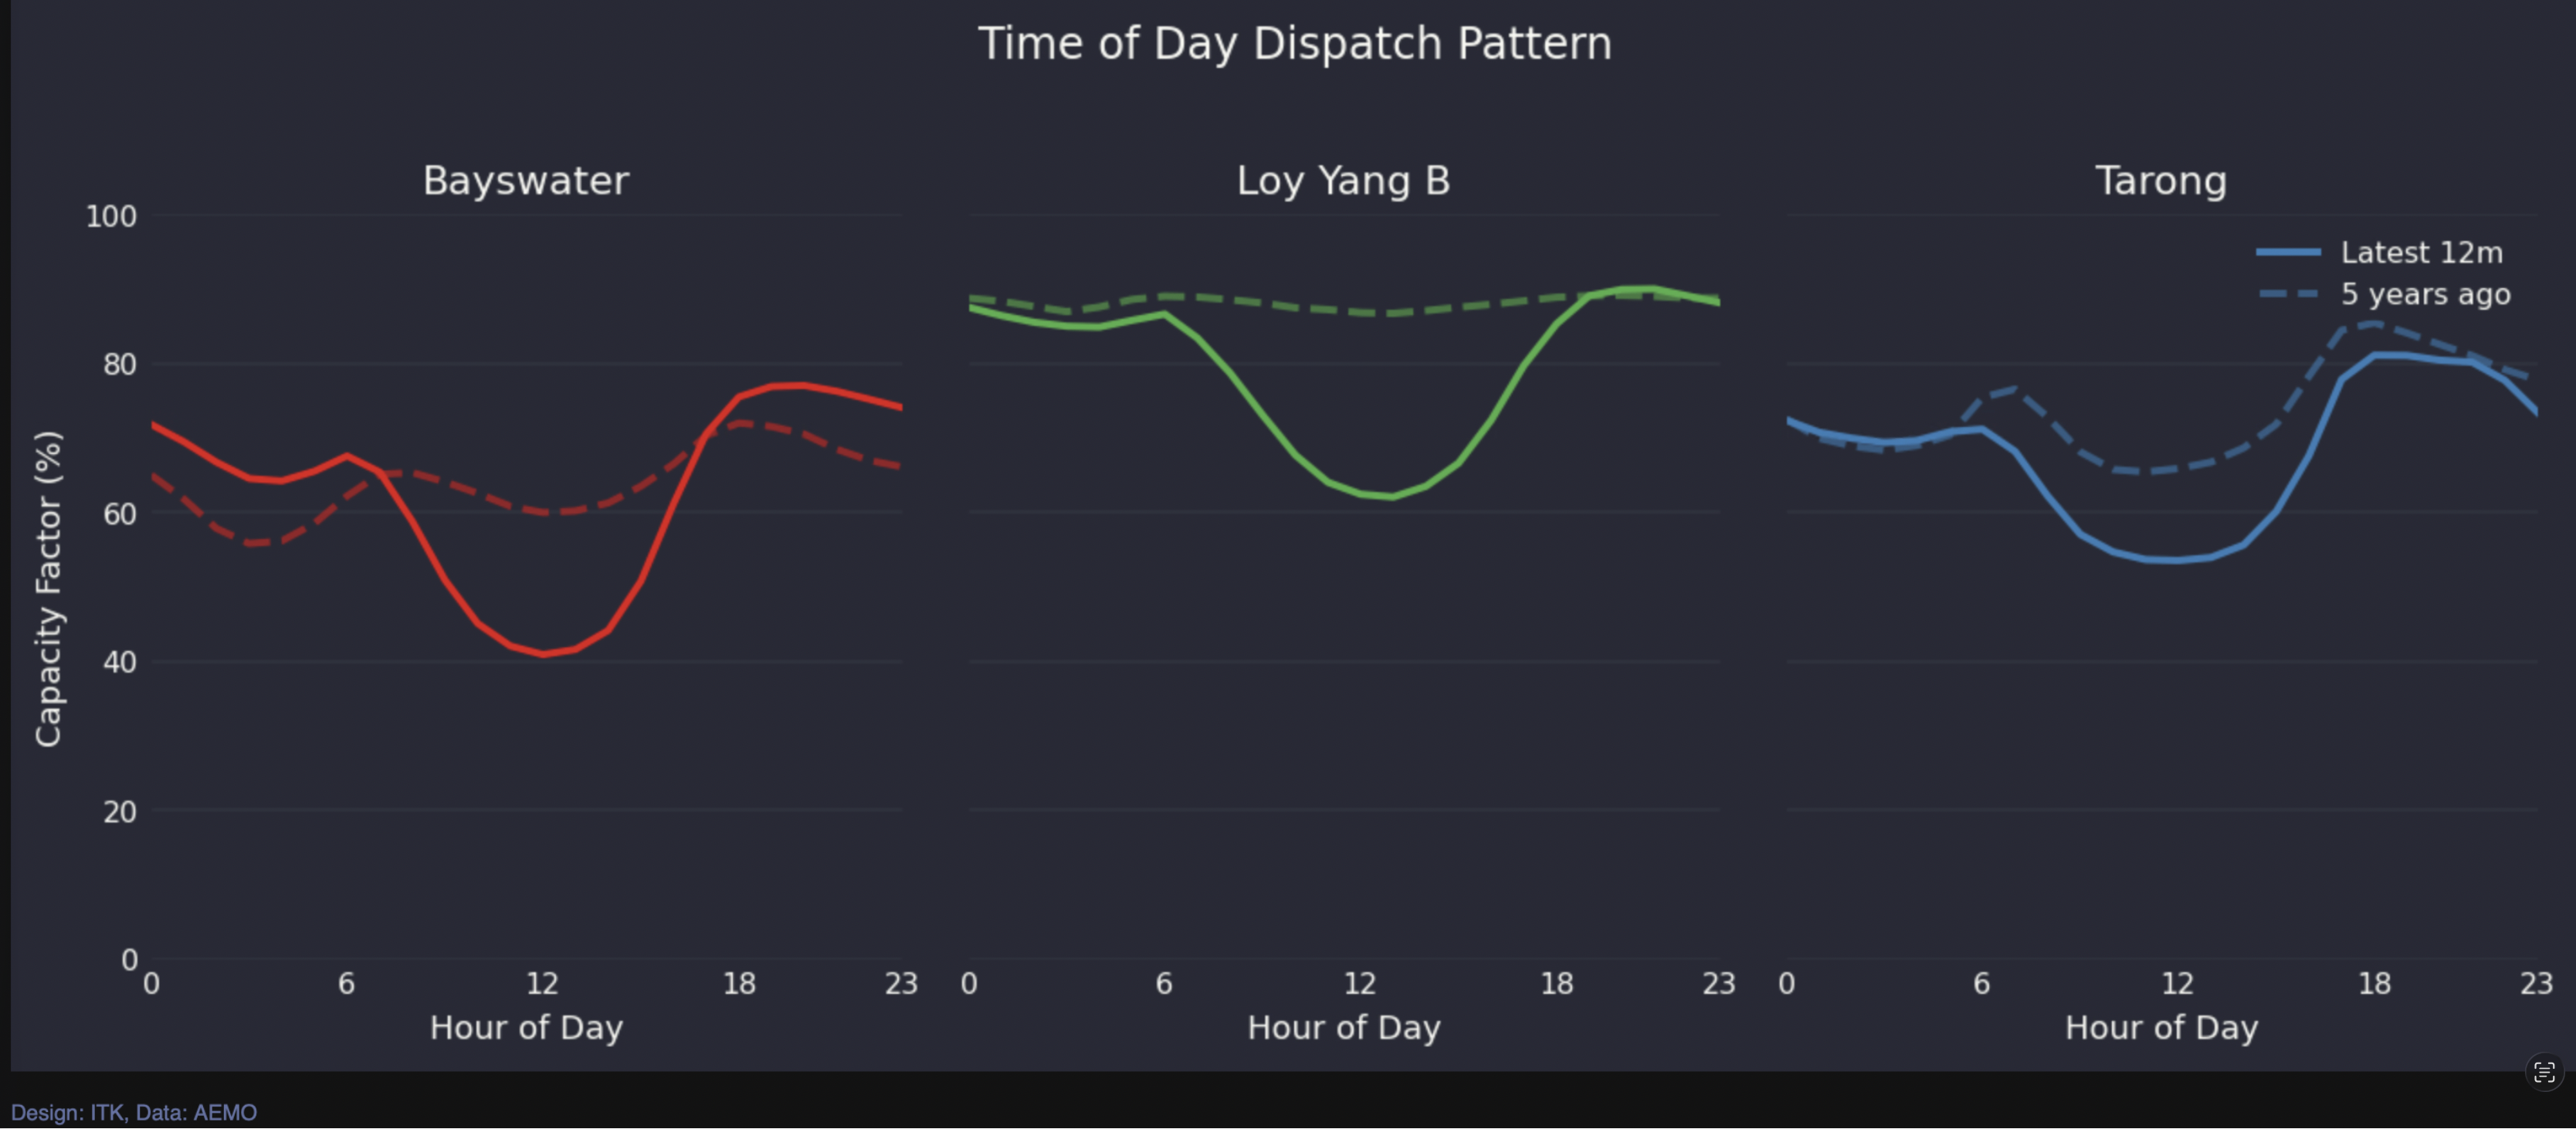
Bayswater capacity utilisation overnight and at peak has actually gone up, likely reflecting the close of Liddell as much as anything.
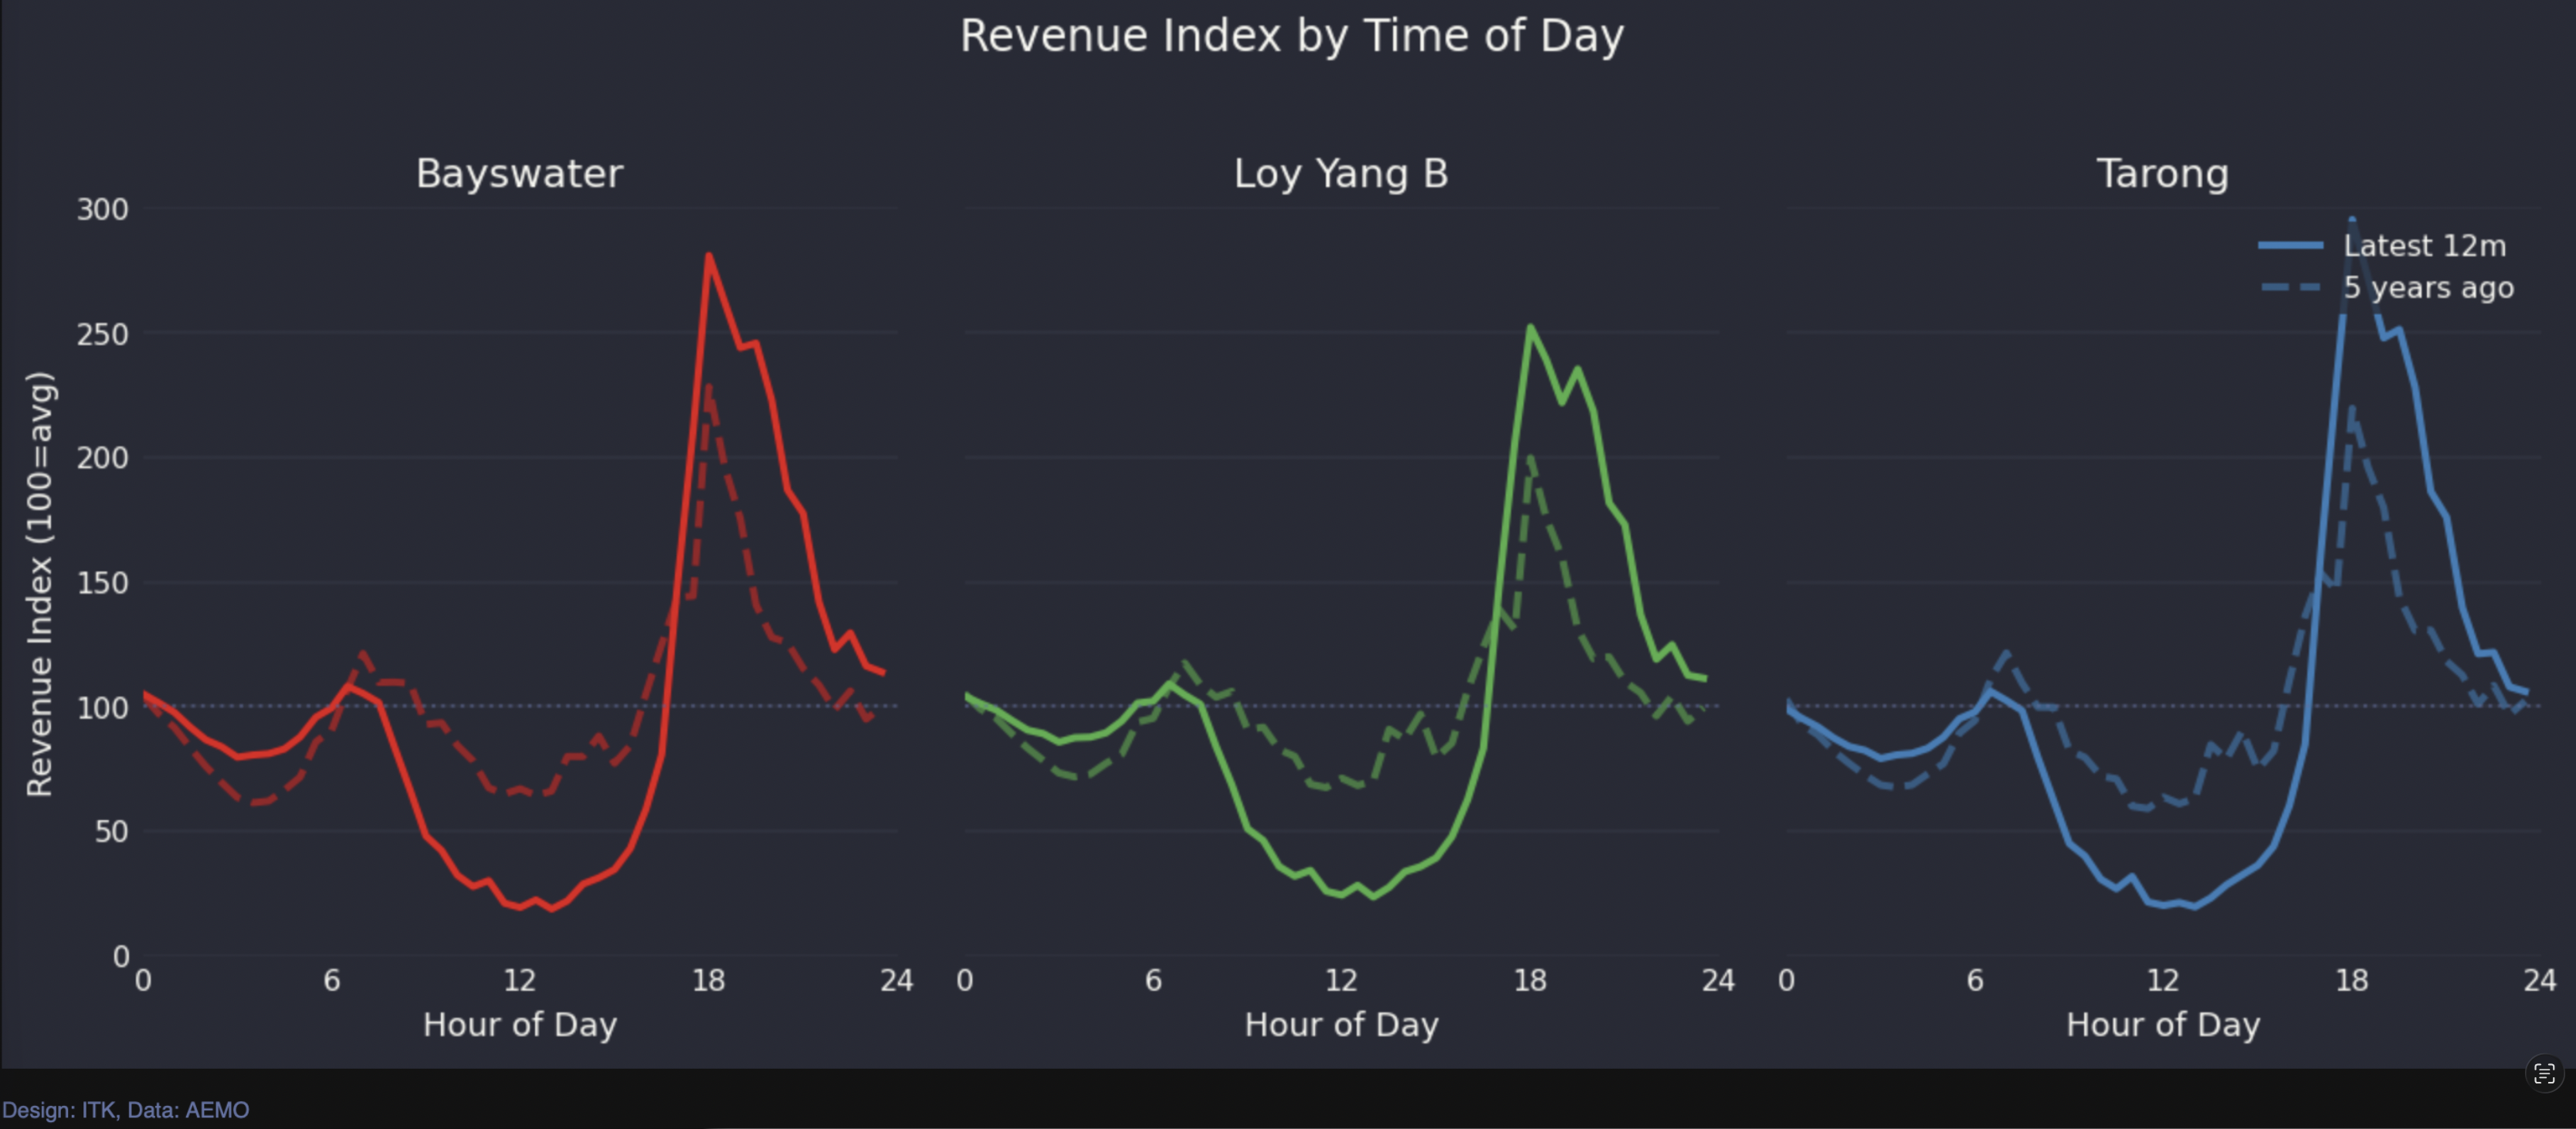
The vulnerability of coal generator spot revenue to batteries competing for peak evening and morning market share should be clear from this graph. Its in index form, so the average revenue for 2020 is 100 and so is 2025 which each half hour for the relevant year expressed relative to that.
9 October
CIS tender awards not amount to 30 GWh of storage, enough to run the NEM for an hour but probably still not enough even with all non CIS storage to make lunchtime prices positive in Spring 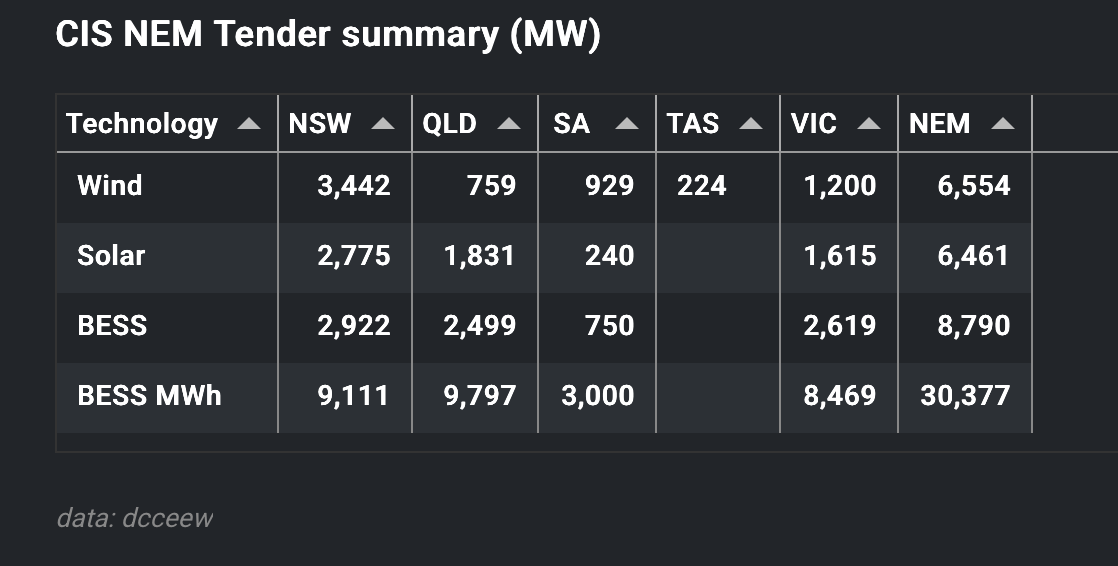
26 Sep
Updated renewable share gauge for bugs and reset records. Will still need to watch the gauge for a wile to see how accurate it is. Also updated IEA-Electricity visualisation to show better trend visualisation, a comparative renewable share plot and a stacked area plot so shares can be compared with the overall growth of a country or region’s electricity. Although I only update the data here probably once a quarter I still find this visualisation very useful.
16 Sep
“We have to have stable, reliable and affordable energy on the path to net zero. The reality is right now Australia has electricity costs that are two to three times higher than countries that we are competing with and 50 to 100 per cent higher than the US,” Mr Henry told a shareholder forum on Monday (quoted in the Australian) My views is that the facts don’t support Mr Henry’s contention.
China electricity cost about A$150/MWh
In China, on-grid electricity costs for December 2024 were approximately CNY 0.532 per kWh (USD 0.075) for residential users and CNY 0.702 per kWh (USD 0.099) for businesses, including transmission, distribution, and taxes.
These prices are part of a new, more transparent pricing system that aims for “cost plus reasonable profit” and offers lower rates for businesses using higher voltages. Source:Global Petrol Prices.com
I should add that these numbers can be confirmed by looking at the ongrid prices obtained by the big state owned Generators. I have been doing these sums for 10 years. Huadian achieved 505 RMB/kWh in Q1 2025 about A$\113/MWh
USD 0.099/kWh converts to about AUD $157/MWh
USA TX is cheap PJM comparable to Victoria, CAISO NSW
USA prices vary from region to region.
| Grid / Region | Estimate Wholesale Price (2025) in USD/MWh | Converted to AUD/MWh |
|---|---|---|
| PJM | US$52.20/MWh — load-weighted average LMP for first 3 months of 2025 | $83 |
| ERCOT | ~ US$30/MWh forecast or lower in many parts of ERCOT for 2025, per EIA. | $48 |
| CAISO | ~ US$65/MWh — average wholesale cost for CAISO footprint in 2023, with forecasts for 2025 showing upward pressure in California wholesale markets. | $104 |
27 August
Interesting interview with Damien Nicks, CEO AGL today. I don’t think he gives a great answer as to what is going to replace 30 TWh, $1.3 bn of EBITA,$900 m of operating cash flow as the coal generation plants close but he’s going to give it a good shot. More to the point there will be another 900 MW of Batteries expected to hit financial close over the next 12-18 months and there was a “watch this space” for a wind PPA with the 850 MW Potinger wind farm expected to hit FID in 2026. Worth listening to the podcast
19 August Lots of news re Nelson review and AGL/ORG results and Vic transmisison
In a nutshell the big gentailers are on strike. No new wind or solar PPAs in years. Nelson review may fix the problem but misidiagnosed the cause, and Victoria is getting itself in a mess.
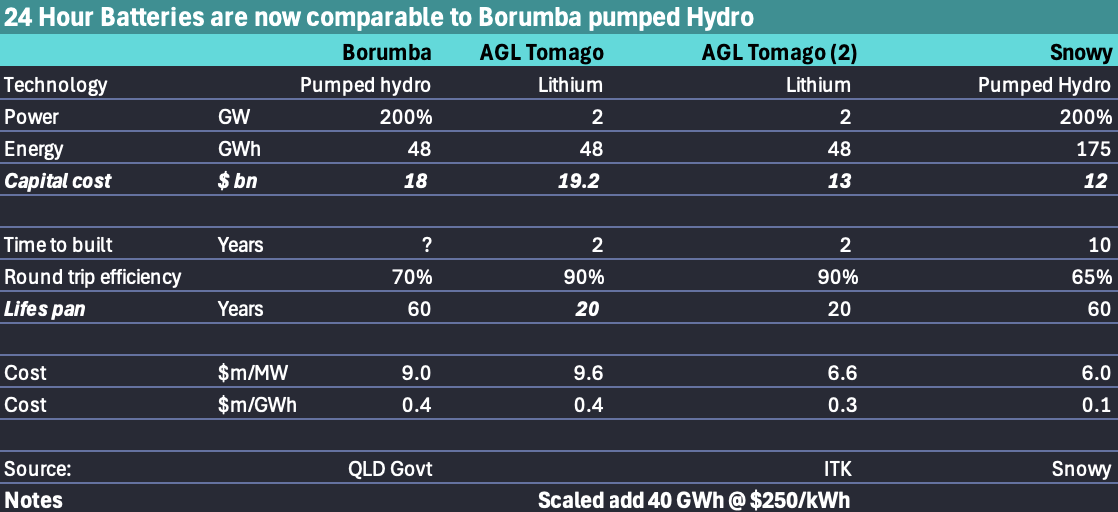
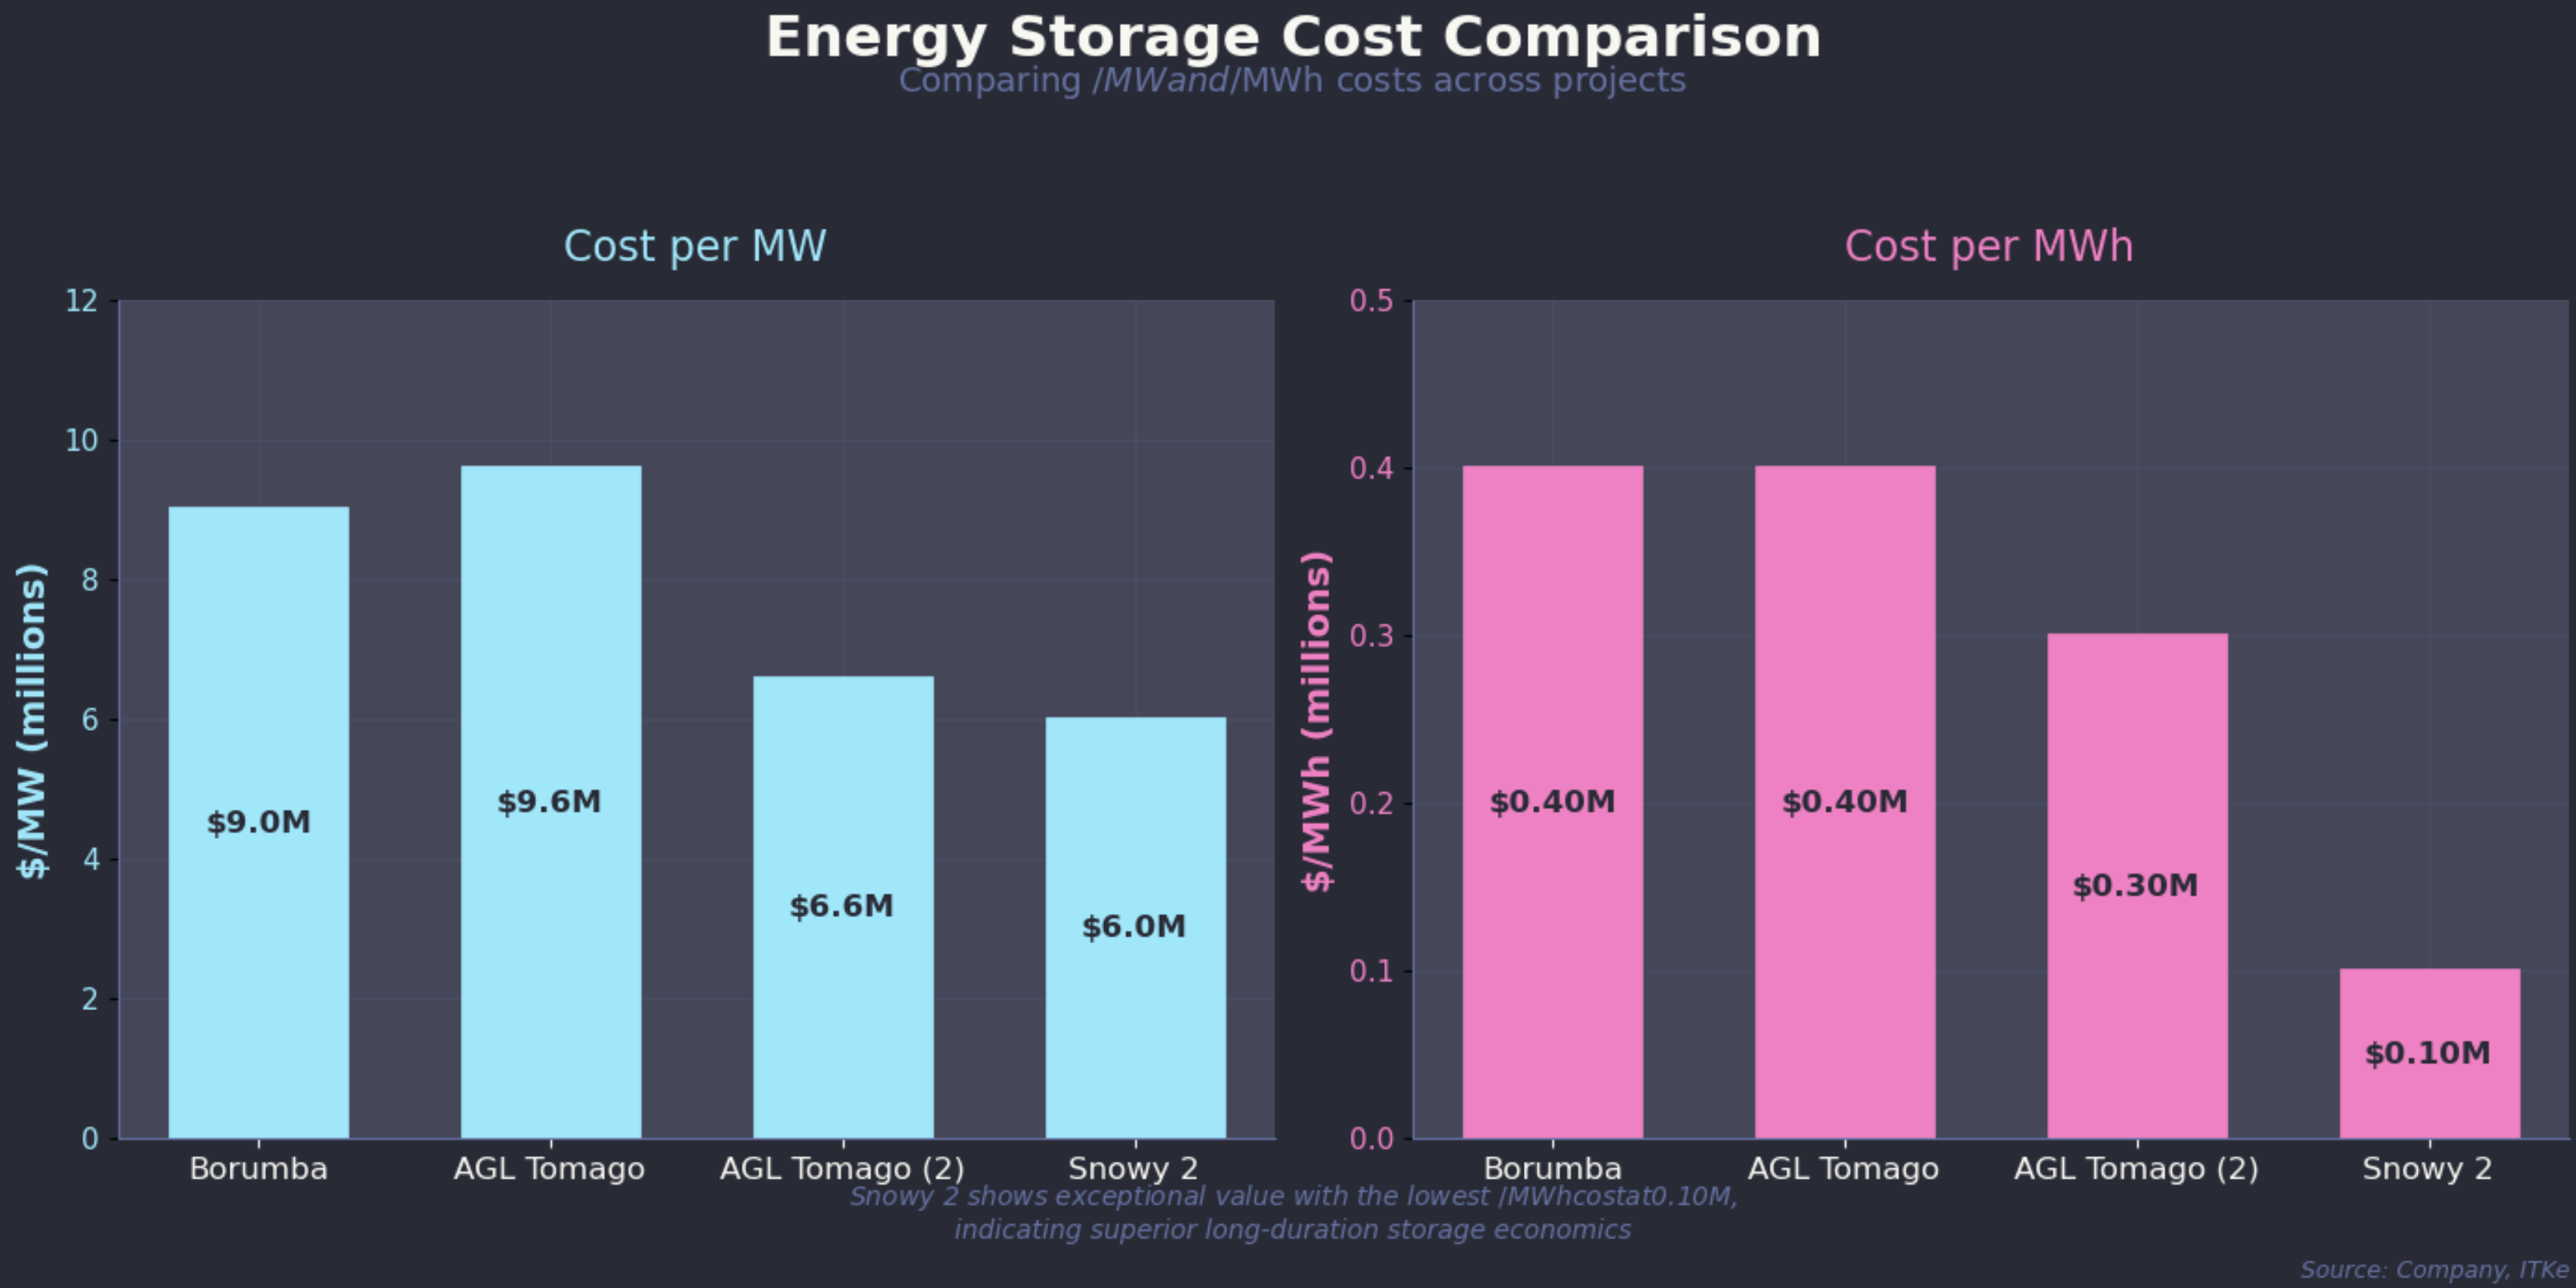
AGL Tomago is basically same cost as Borumba pumped hydro
Even before allowing for any additional cost saving to batteries from increasing duration AGL’s just announced Tomago battery at $800 m for a 0.5 GW/4 hour battery is comparable in price to the most recent estimate of Borumba. I am sure that pumped hydro enthusiasts will argue that the Borumba cost is both exceptional and overstated but at $18 bn for 2 GW of 24 hour storage it sets a um high water benchmark. AGL’s just announced 500 MW/4 hour battery has a cost of $800 m. Scaled up to 24 hours and 2 GW that’s just at touch over $19 bn. Both are still more expensive than Snowy 2.
I am virtually certain that if in fact AGL was to build 24 hour storage the unit cost of the incremental hours would be way less than the the already cheap $400/kWh cost of the announced 4 hour project. If we made the incremental cost $250/kWh then the full 2 GW/24 hour storage is about $13 bn, significantly cheaper than Borumba never mind it could be built in a 1/4 of the time and way higher round trip efficiency. Life span is lower of course ,but in NPV terms that doesn’t matter much.
31 July
Battery prices have dropped like a stone this year. AGL’s 500 MW/4 hour battery at A$800m all up or $400k/MWh is about 60% of the number I was using earlier this year. Other background comments suggest even better deals can be had. Even so solar + 16 hour battery is still going to be expensive, just less so.
Secondly a few CEC reflections.
- Not a fan of the new Chair, Ross Rolfe. Iberadrola of which he is the Australian CEO has done little of consequence in Australia since he became CEO when it was still Infigen back in about 2015
- It’s interesting to compare panel discussions and solo presentations. For me the great benefit of a solo presentation is you can use slides to keep the audience engaged. There is some academic evidence that visual aids improve audience engagement and information recall. Still I guess there is a place for panel discussion.
- My other observation is that despite the battery price fall and despite the cost of transmission there are sill significant wind project getting read to go in NSW and in QLD. Valley of the Winds, Liverpool Range, Winterbourne, Tarong West and another in QLD probably about 4 GW of which I expect 3 GW to hit FID in the next 12 months.,
25 July
Adde renewable gauge, shows NEM wind the renewable (solar + wind + rooftop + hydro) share of total generation in the past five minutes as well as record markers for the hour of the day and all time. Records based on 5.5 years of data from Jan 1 2020.
23 July
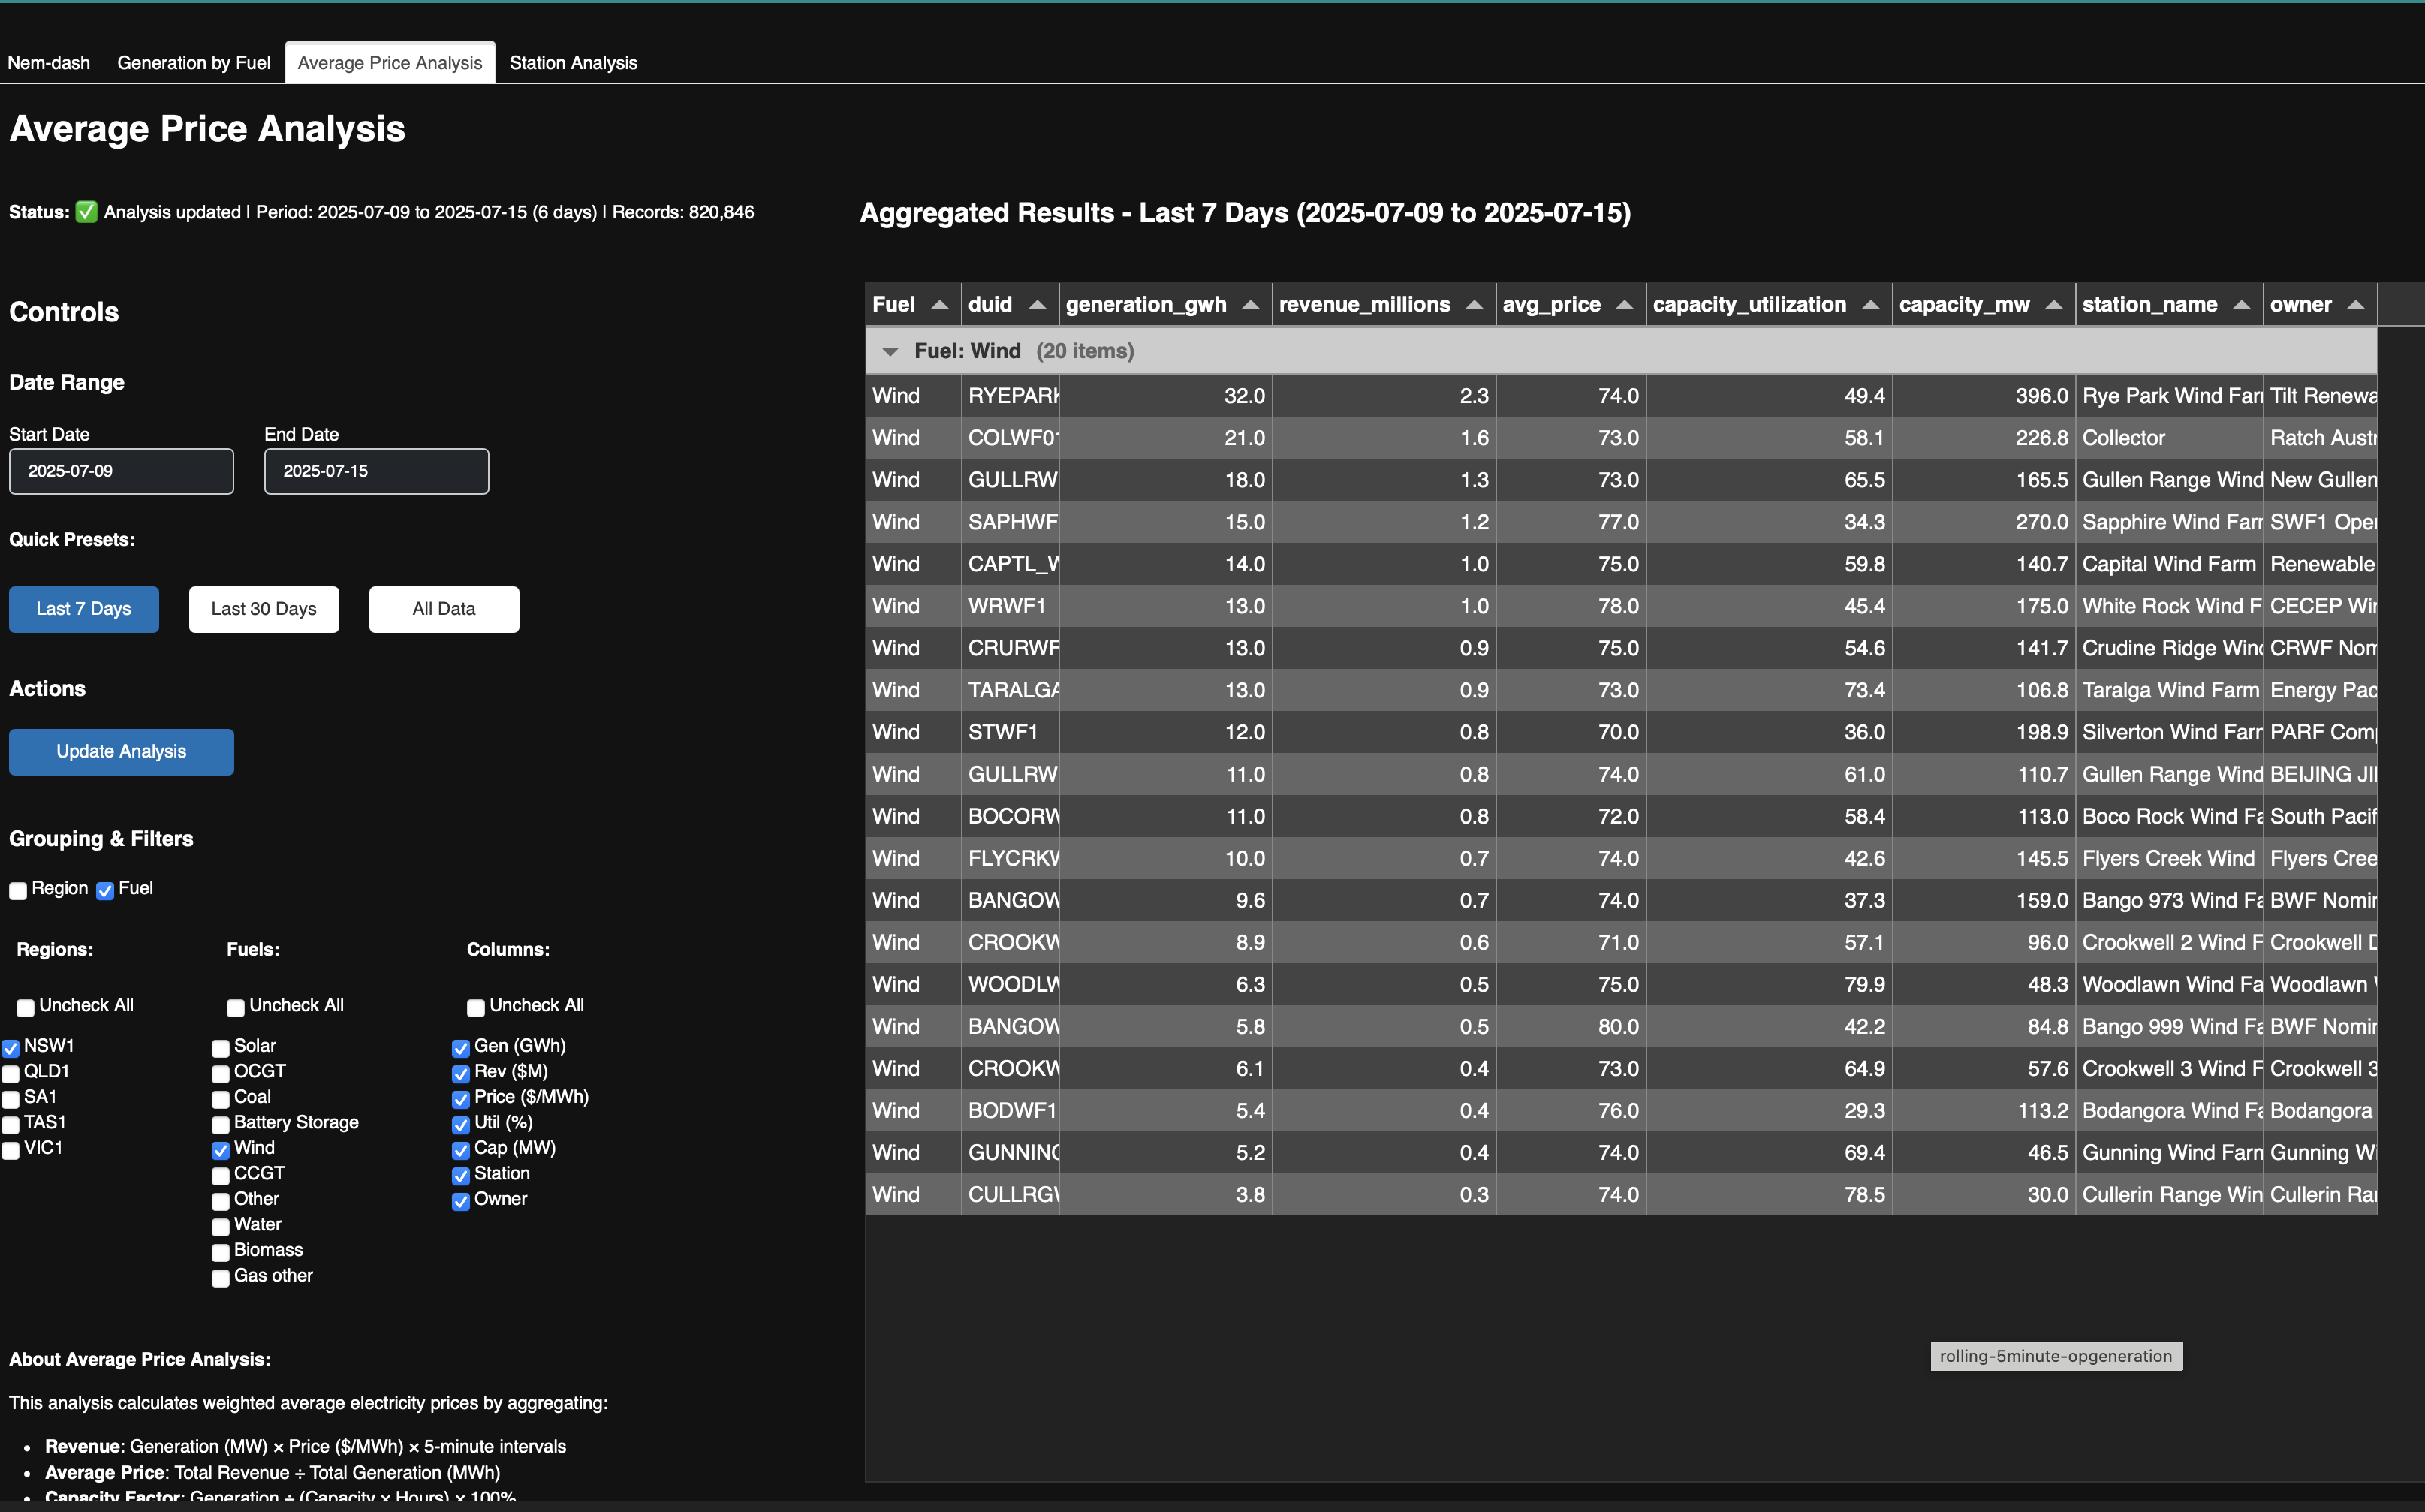
Prices tab now operational. Pleased with a few features including the different ways to view prices and adding a smoothing option. I’ve also realised that this dashboard is designed for desktop sized screens. at least 15”. May i’ll try a make it more responsive going forward.
15 July
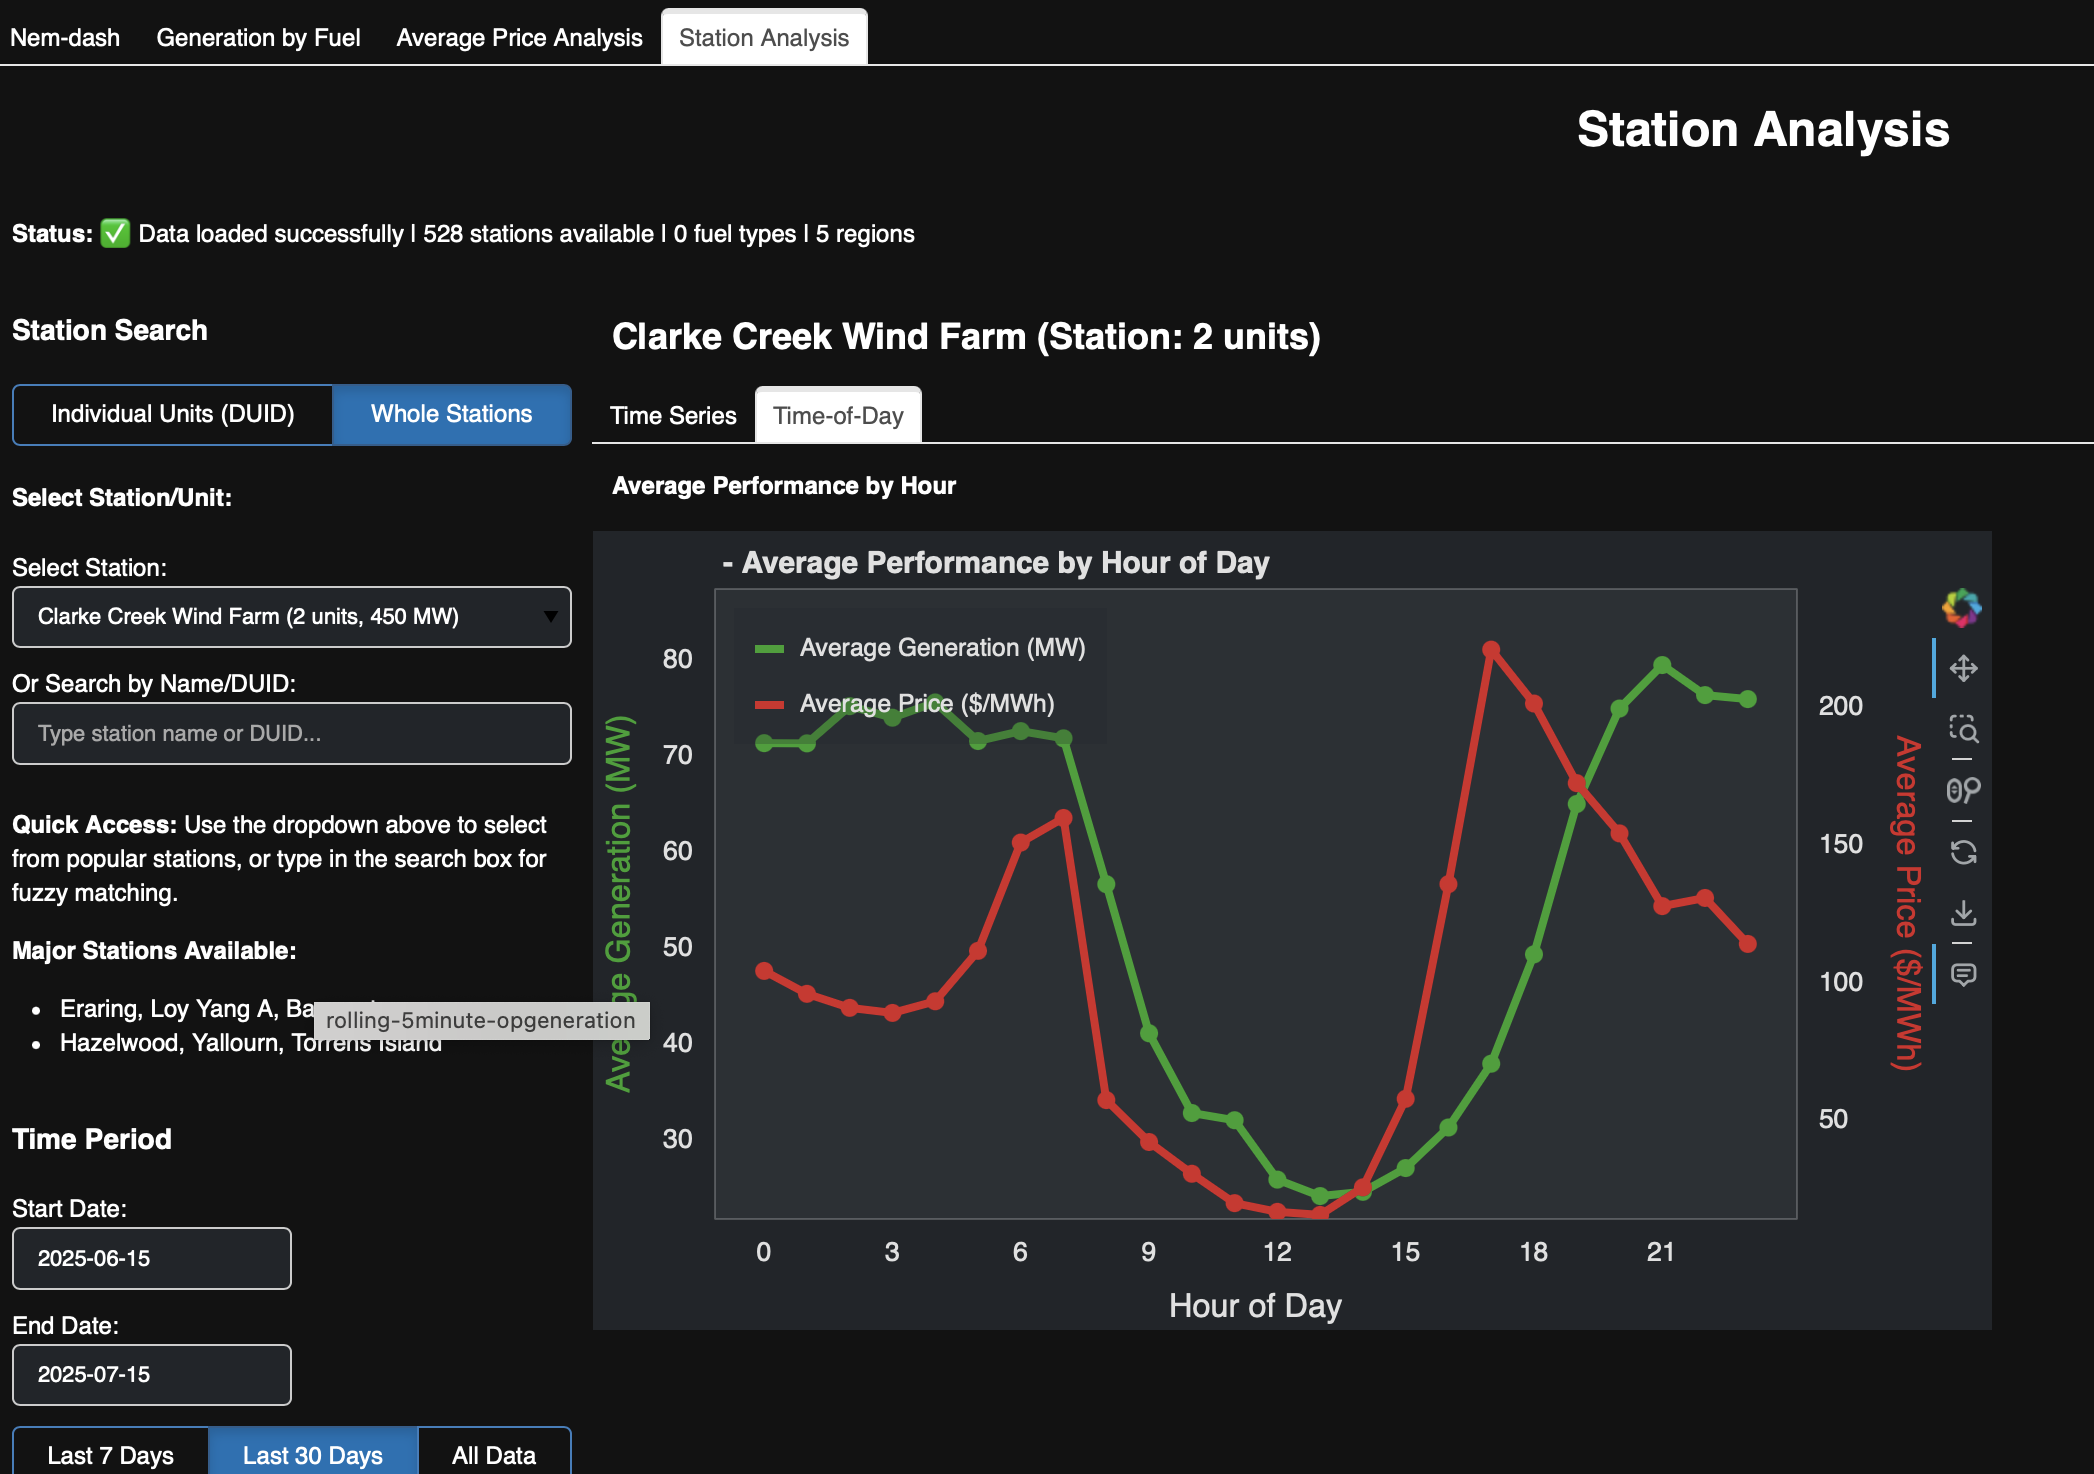
Some very long days and nights for an old fella build an el cheapo dashboard to review nem generation and prices by fuel, by region even by generator or duid. At the moment the dashboard only uses 5 minute data from the middle of June, but for something built in just a few days it will have to do. No doubt the design and functionality will change with time. Despite lots of misunderstandings and some unresolved issues Claude Code sped up the work enormously. Checkit out at https://itkservices3.com/nemgen
A couple of screen shots. 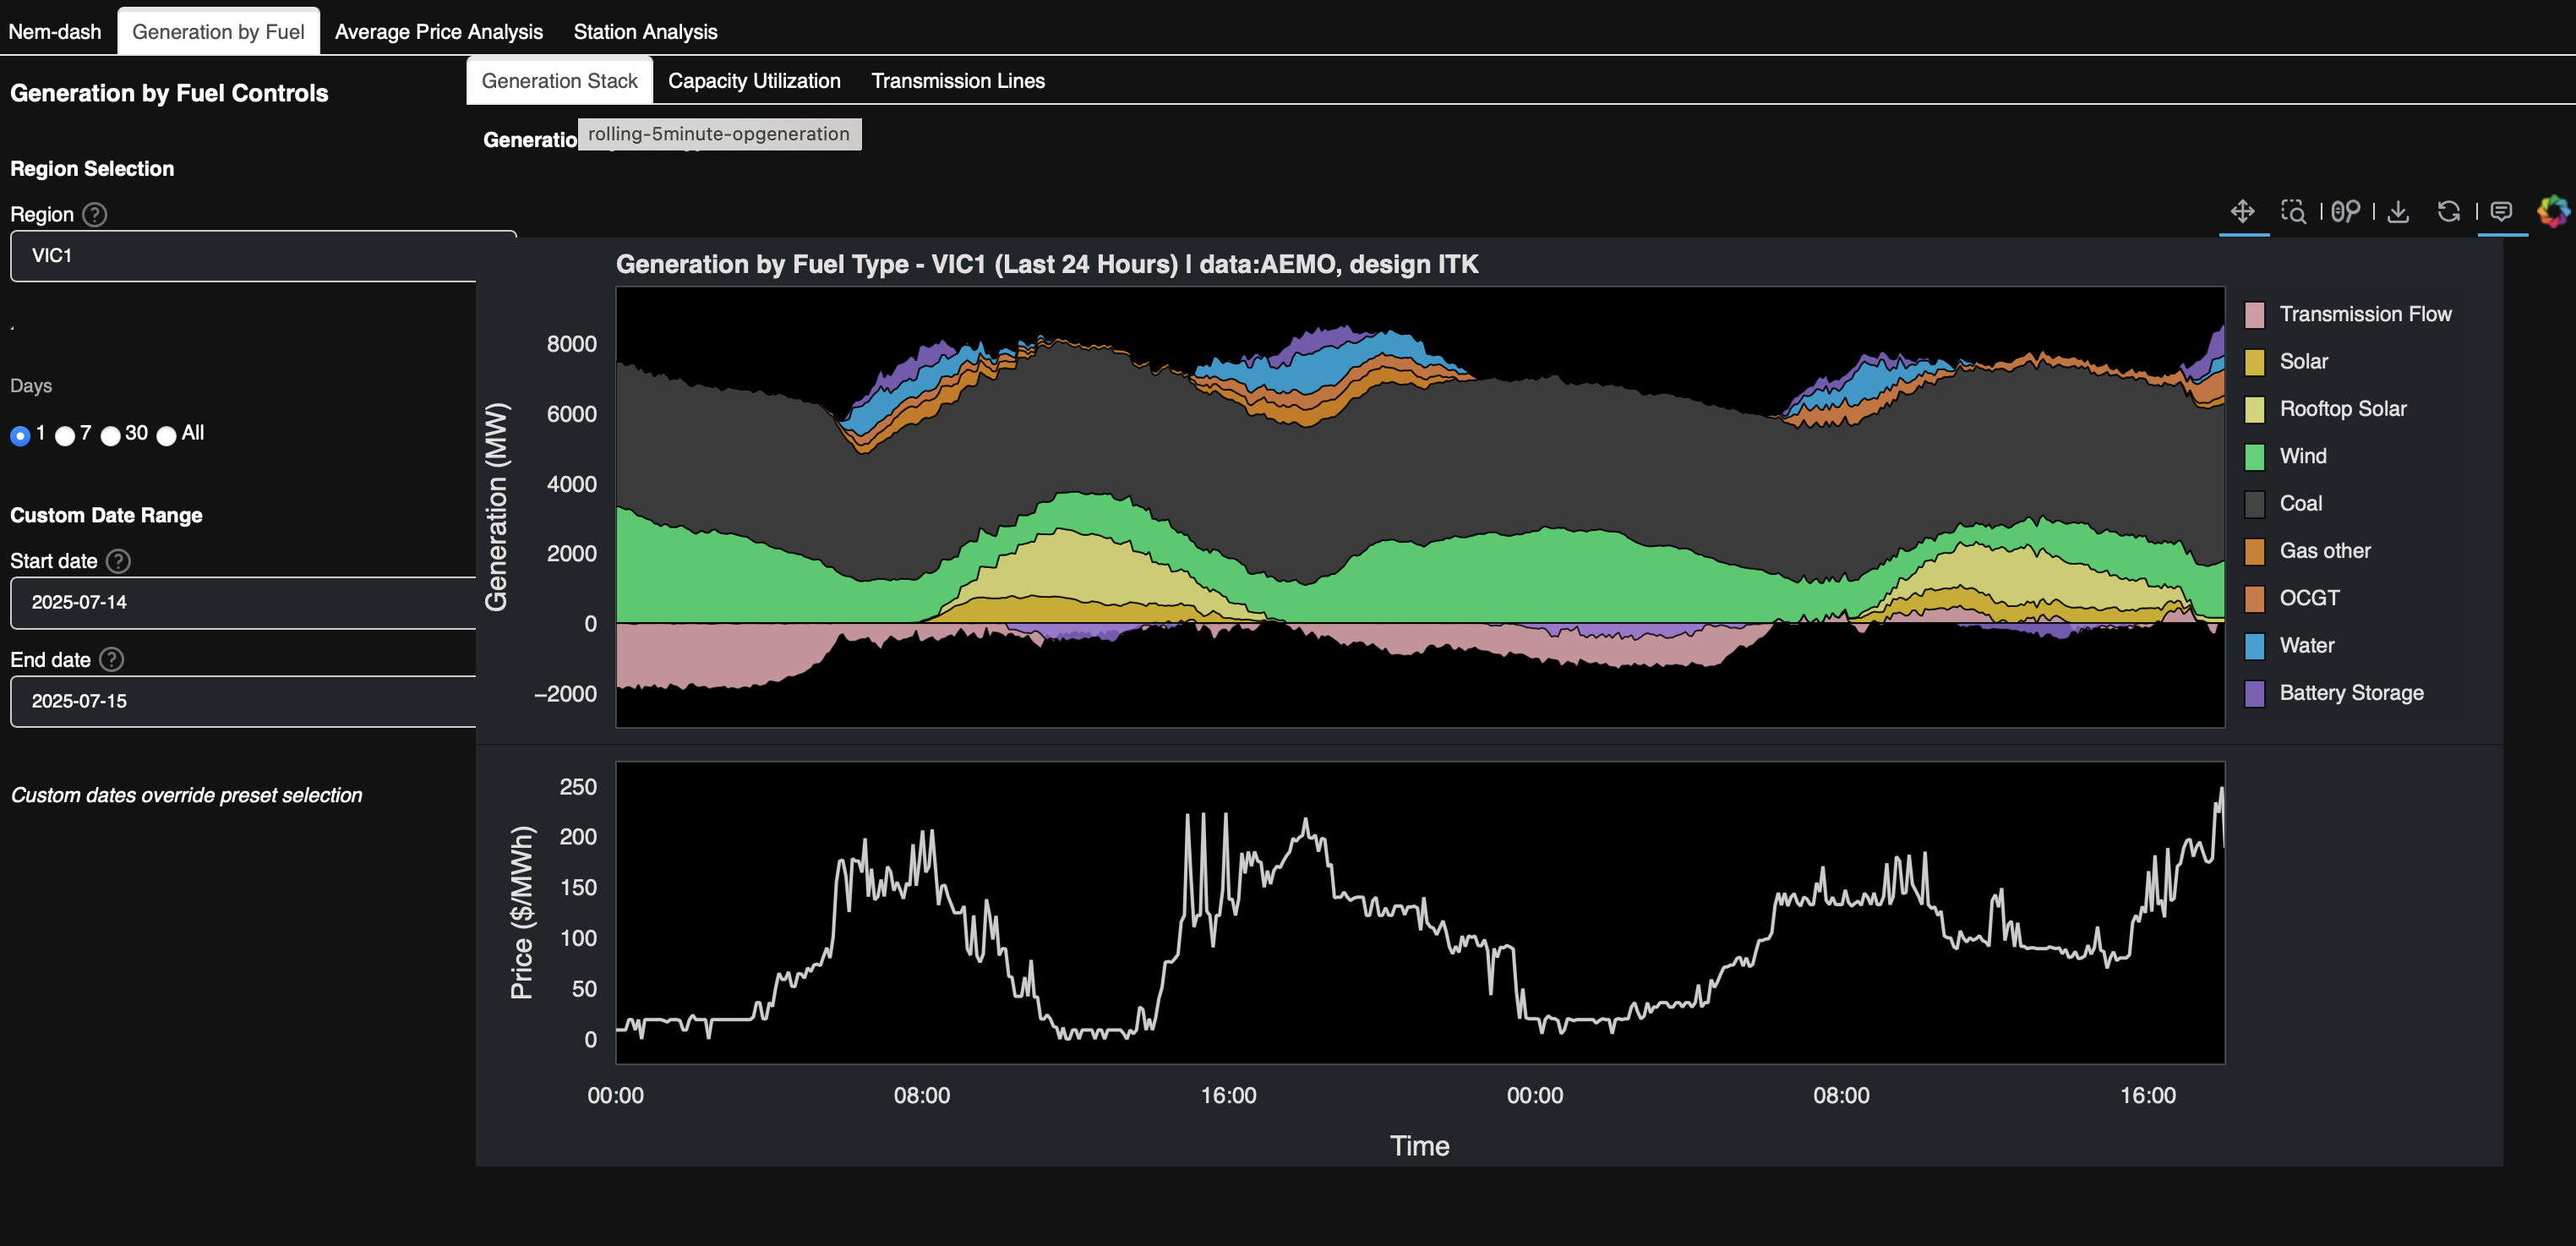
10 July
Late night, long morning moved site deployment to GitHub for speedier updating of the site using the Netlify actions. And reorganised main menus to better suit phones etc.
9 July
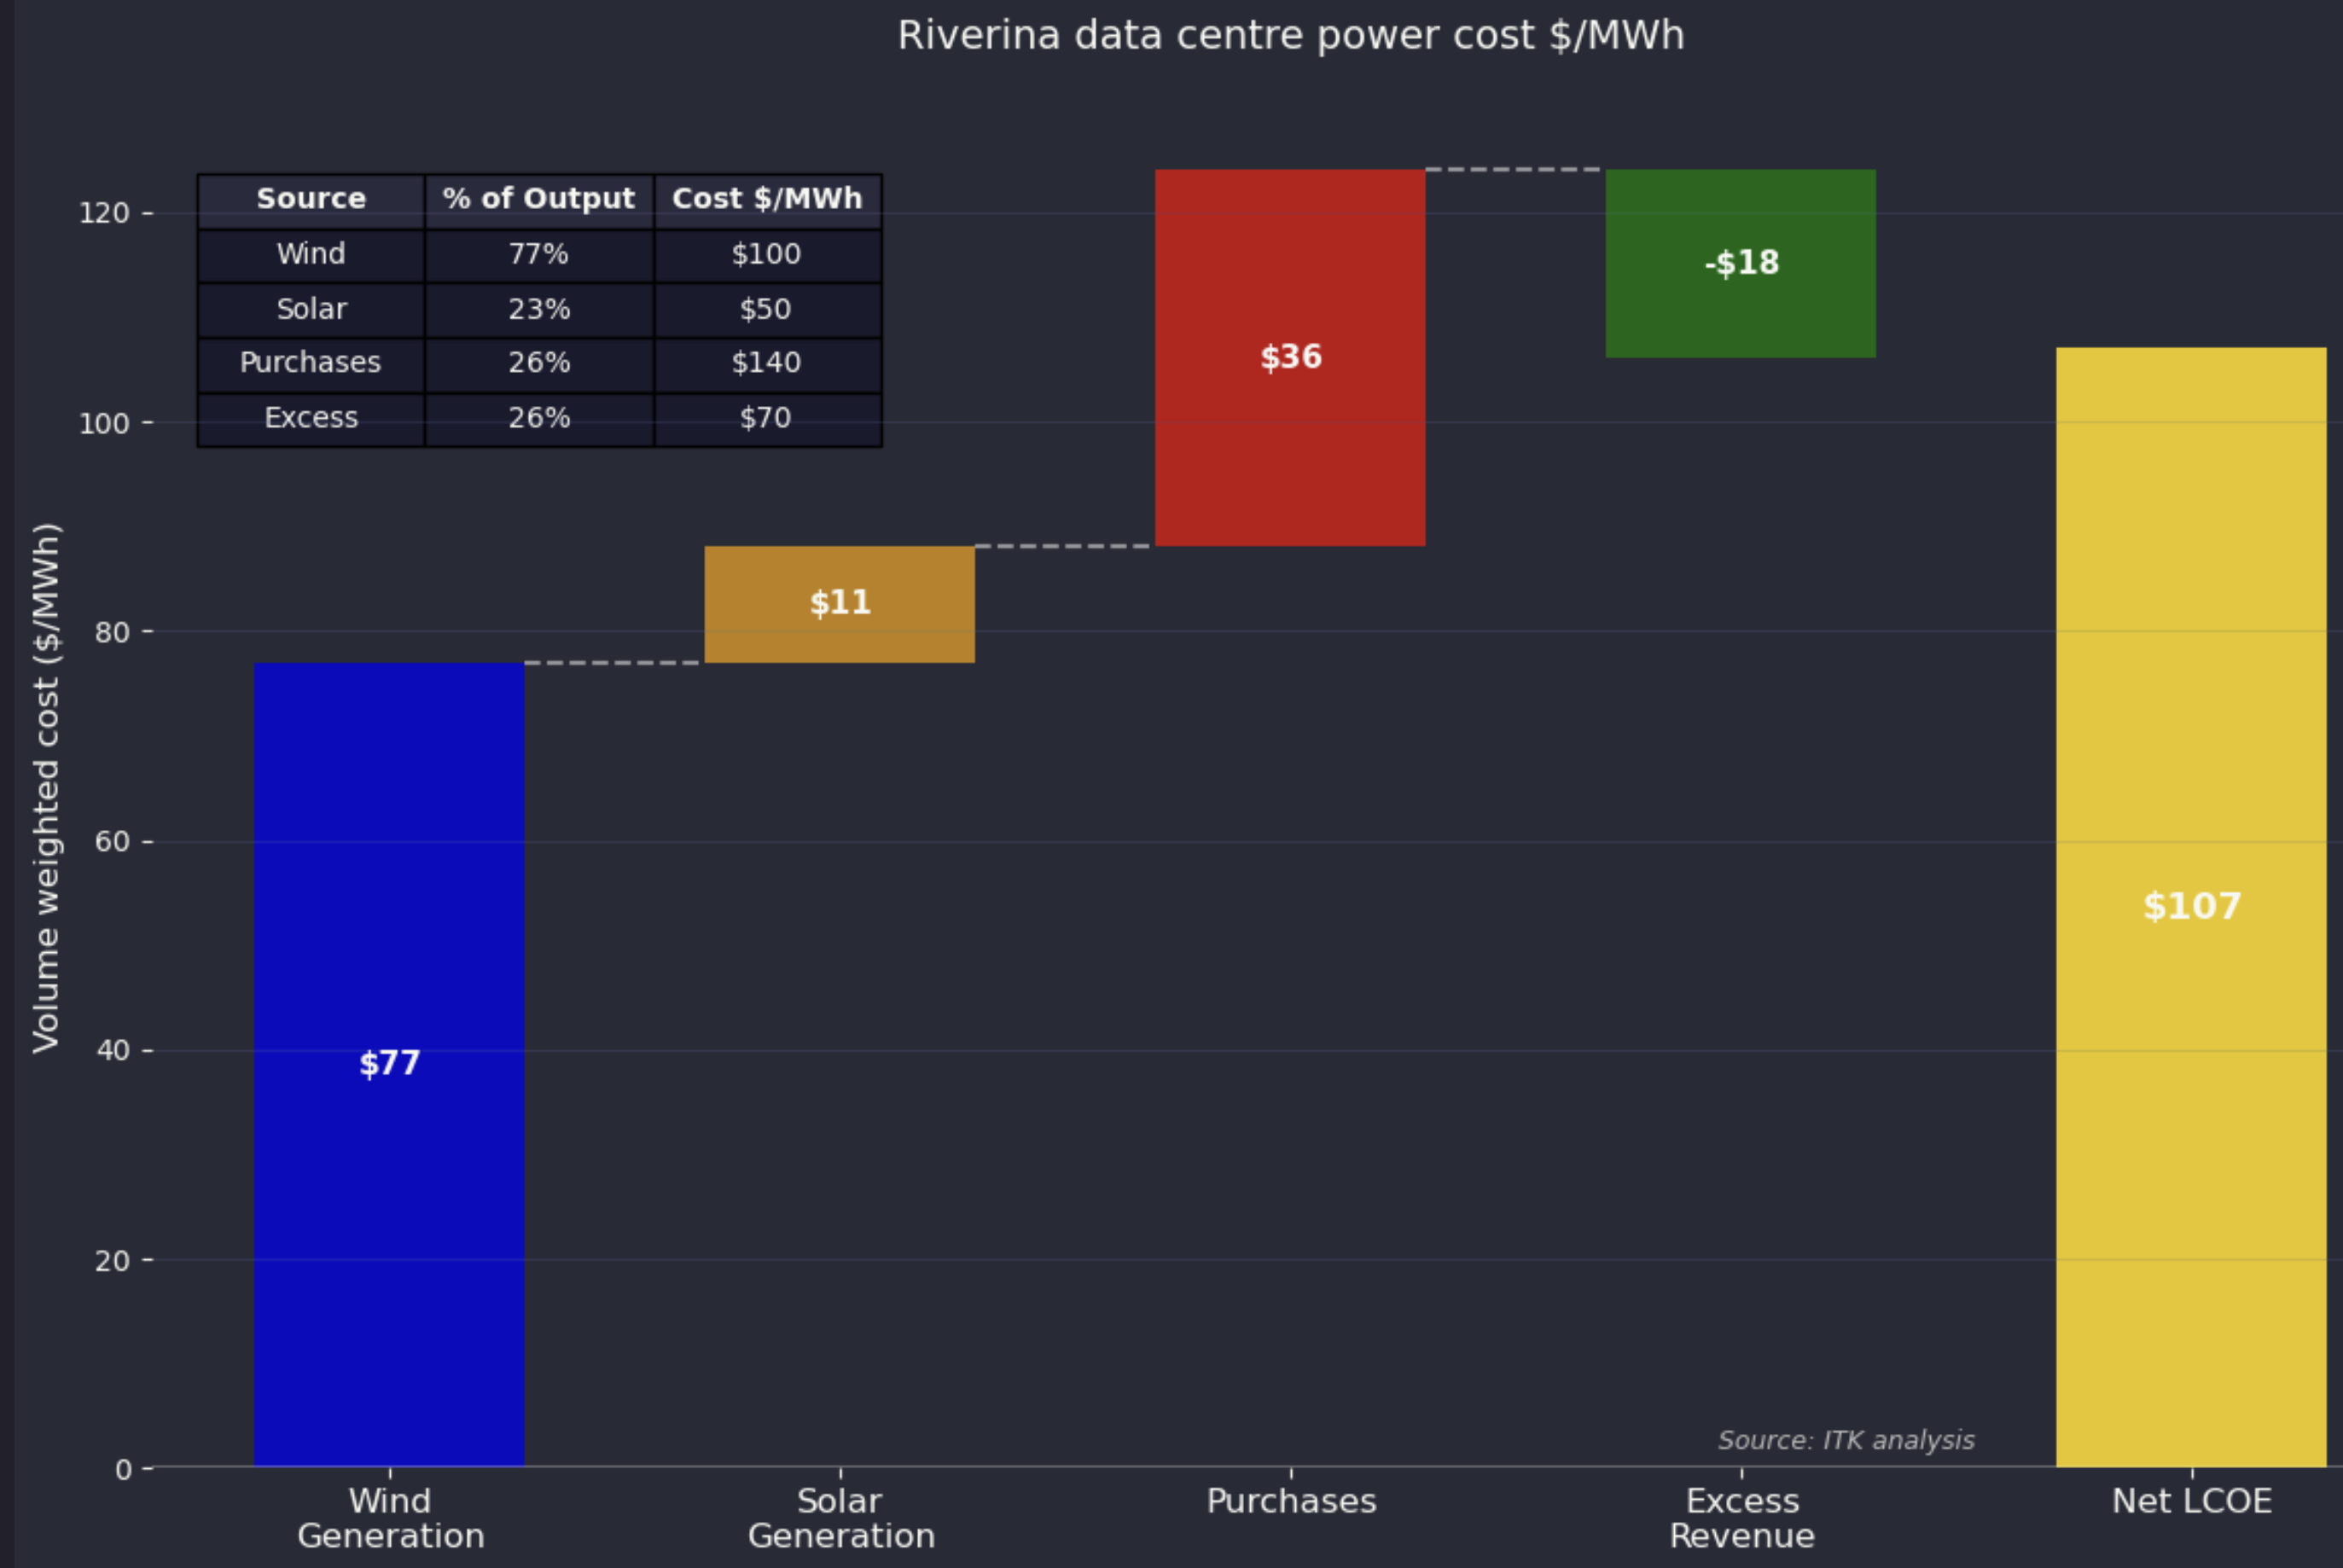
Wrote a note looking at locating a datacentre in the Riverina next to say Dinawan substation, was pleased to make quite a nice waterfall chart building up the weighted average cost of power.
5 July
Starting the complex process of changing my personal email and moving my work email from host to another. This involved Siteground, Cloudflare, TPP and Fastmail wand would have been completely impossible for me without the detailed assistance of both Claude and ChatGPT. Claude’s ability to look at screenshots so as to check whether the various mail records MX, C, TXT have been entered properly was completely essential. Hopefully its done now.
3 July
Starting to track site visits etc with plausible.IO. Also added a price chart to the new operational supply dashboard. Timely given the South Australia price averaged close to $2000 over the past 24 hours. 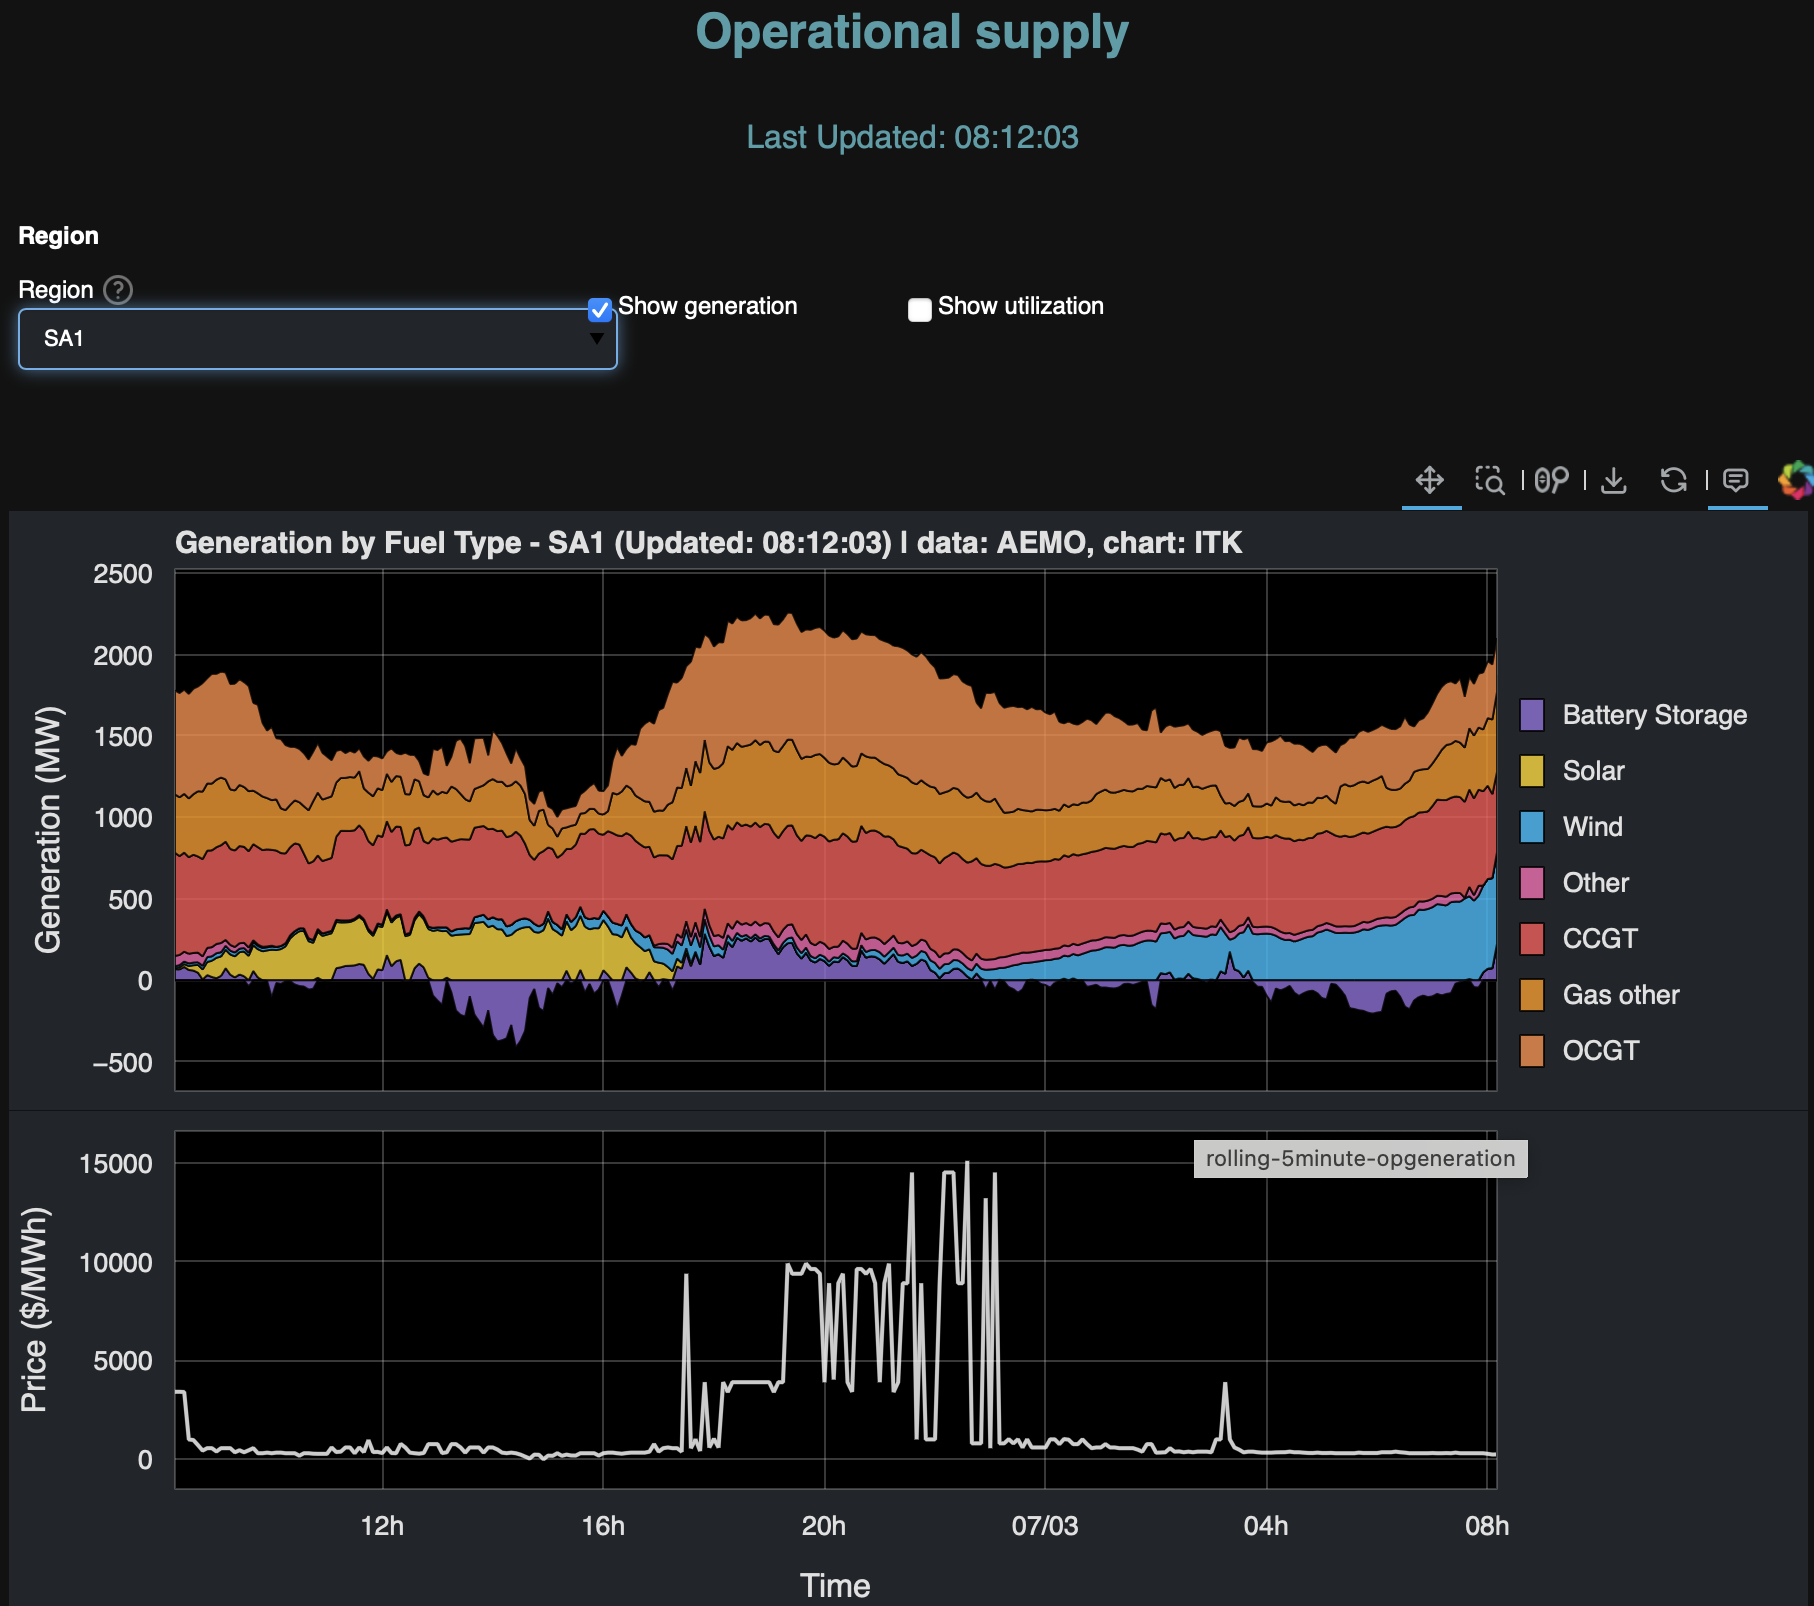
27 June
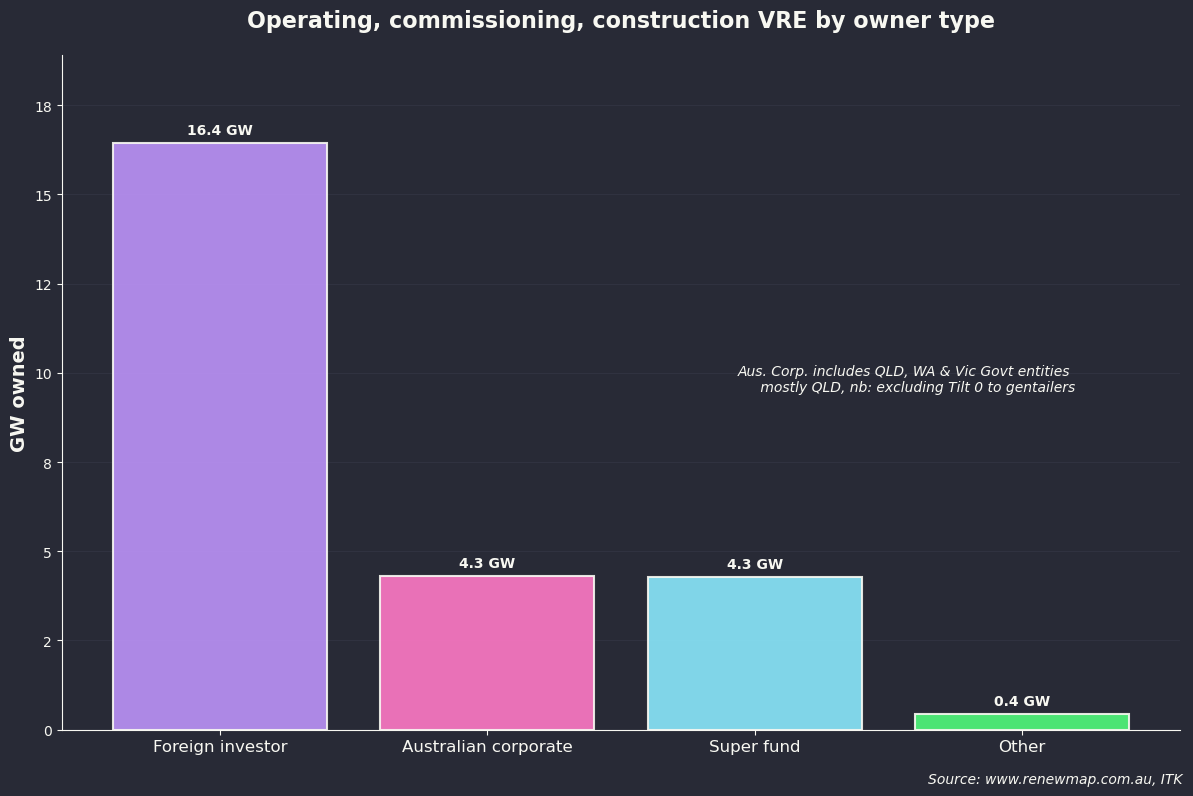
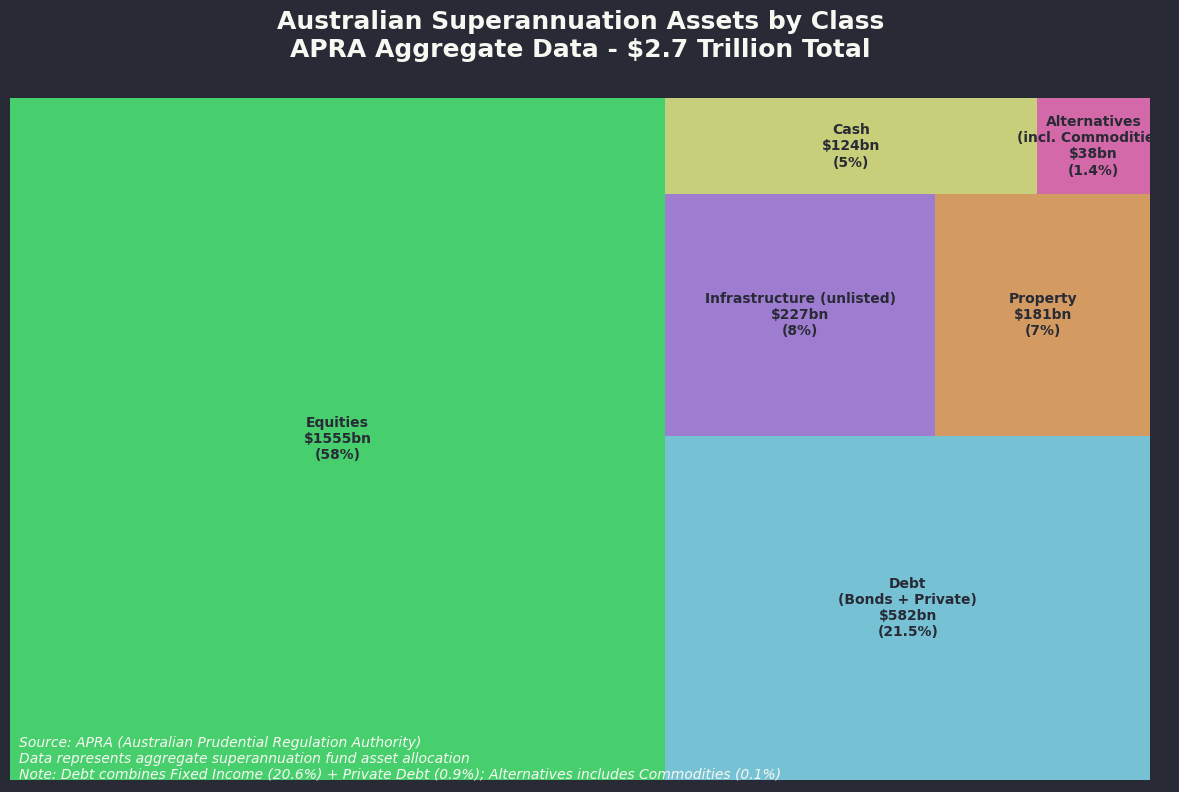
Interesting to look into superfund asset allocation and ownership of wind and solar
20 June
Assisted by Claude there is a new generation dashboard that shows a 24 hour rolling stacked graph of operational generation at 5 minute intervals. Available for any region or from the NEM. Data from AEMO’s nemweb portal but of course all errors are mine alone. In addition you can also see capacity utilisation by fuel although not by individual power station. I may add that later. At the time of writing there is next to no wind in NSW. That’s great for my F5J glider practice but not so much for wind electricity generation. As the number of dashboards is growing I now include them all under a reorganised menu. I’m quite proud of the data you can see here. Lots of NEM history, uptothe minute view of prices and operational generation, the global share of generation by fuel and country and other stuff. At the moment the data is not available for download but for casual viewers of what’s what you could do worse.
13 June
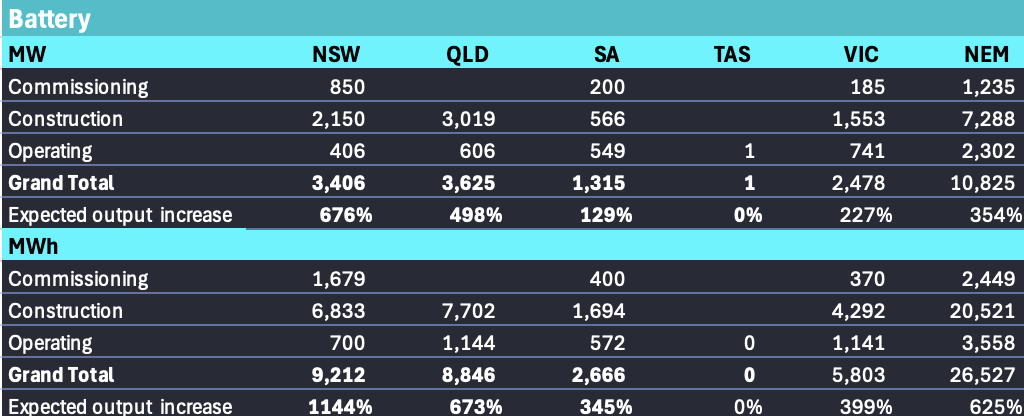
Lots of work on green iron which can be found in the main menu but here’s a table with the outlook for generation capacity 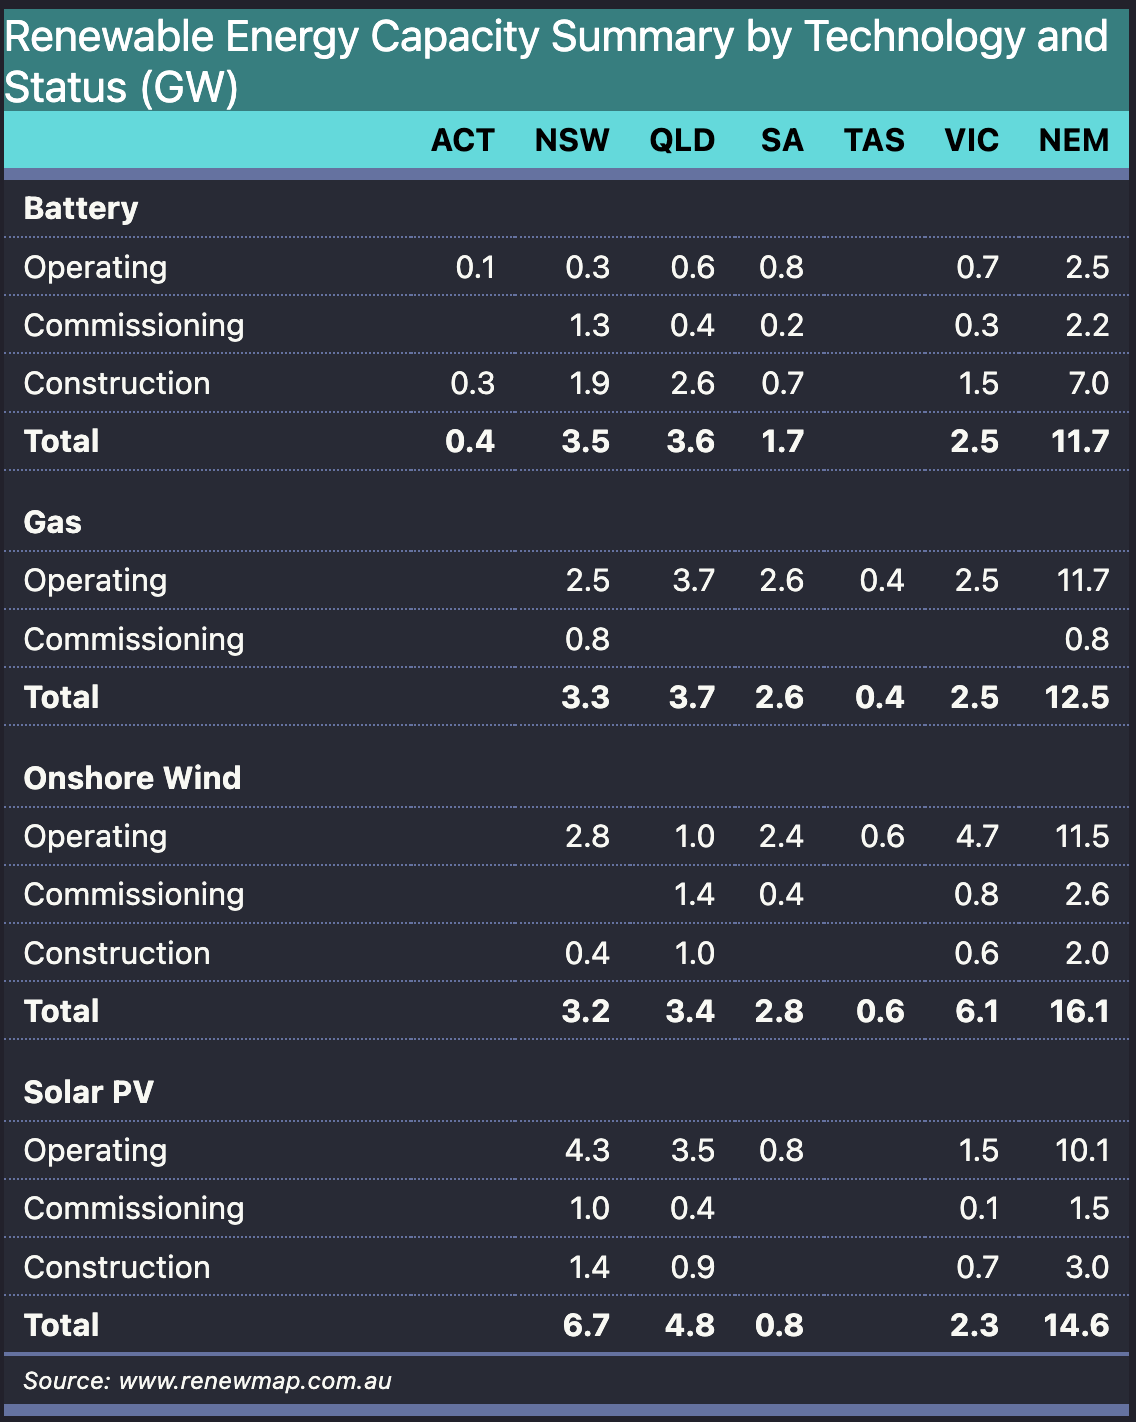
And the even more astonishing battery capacity in the NEM: 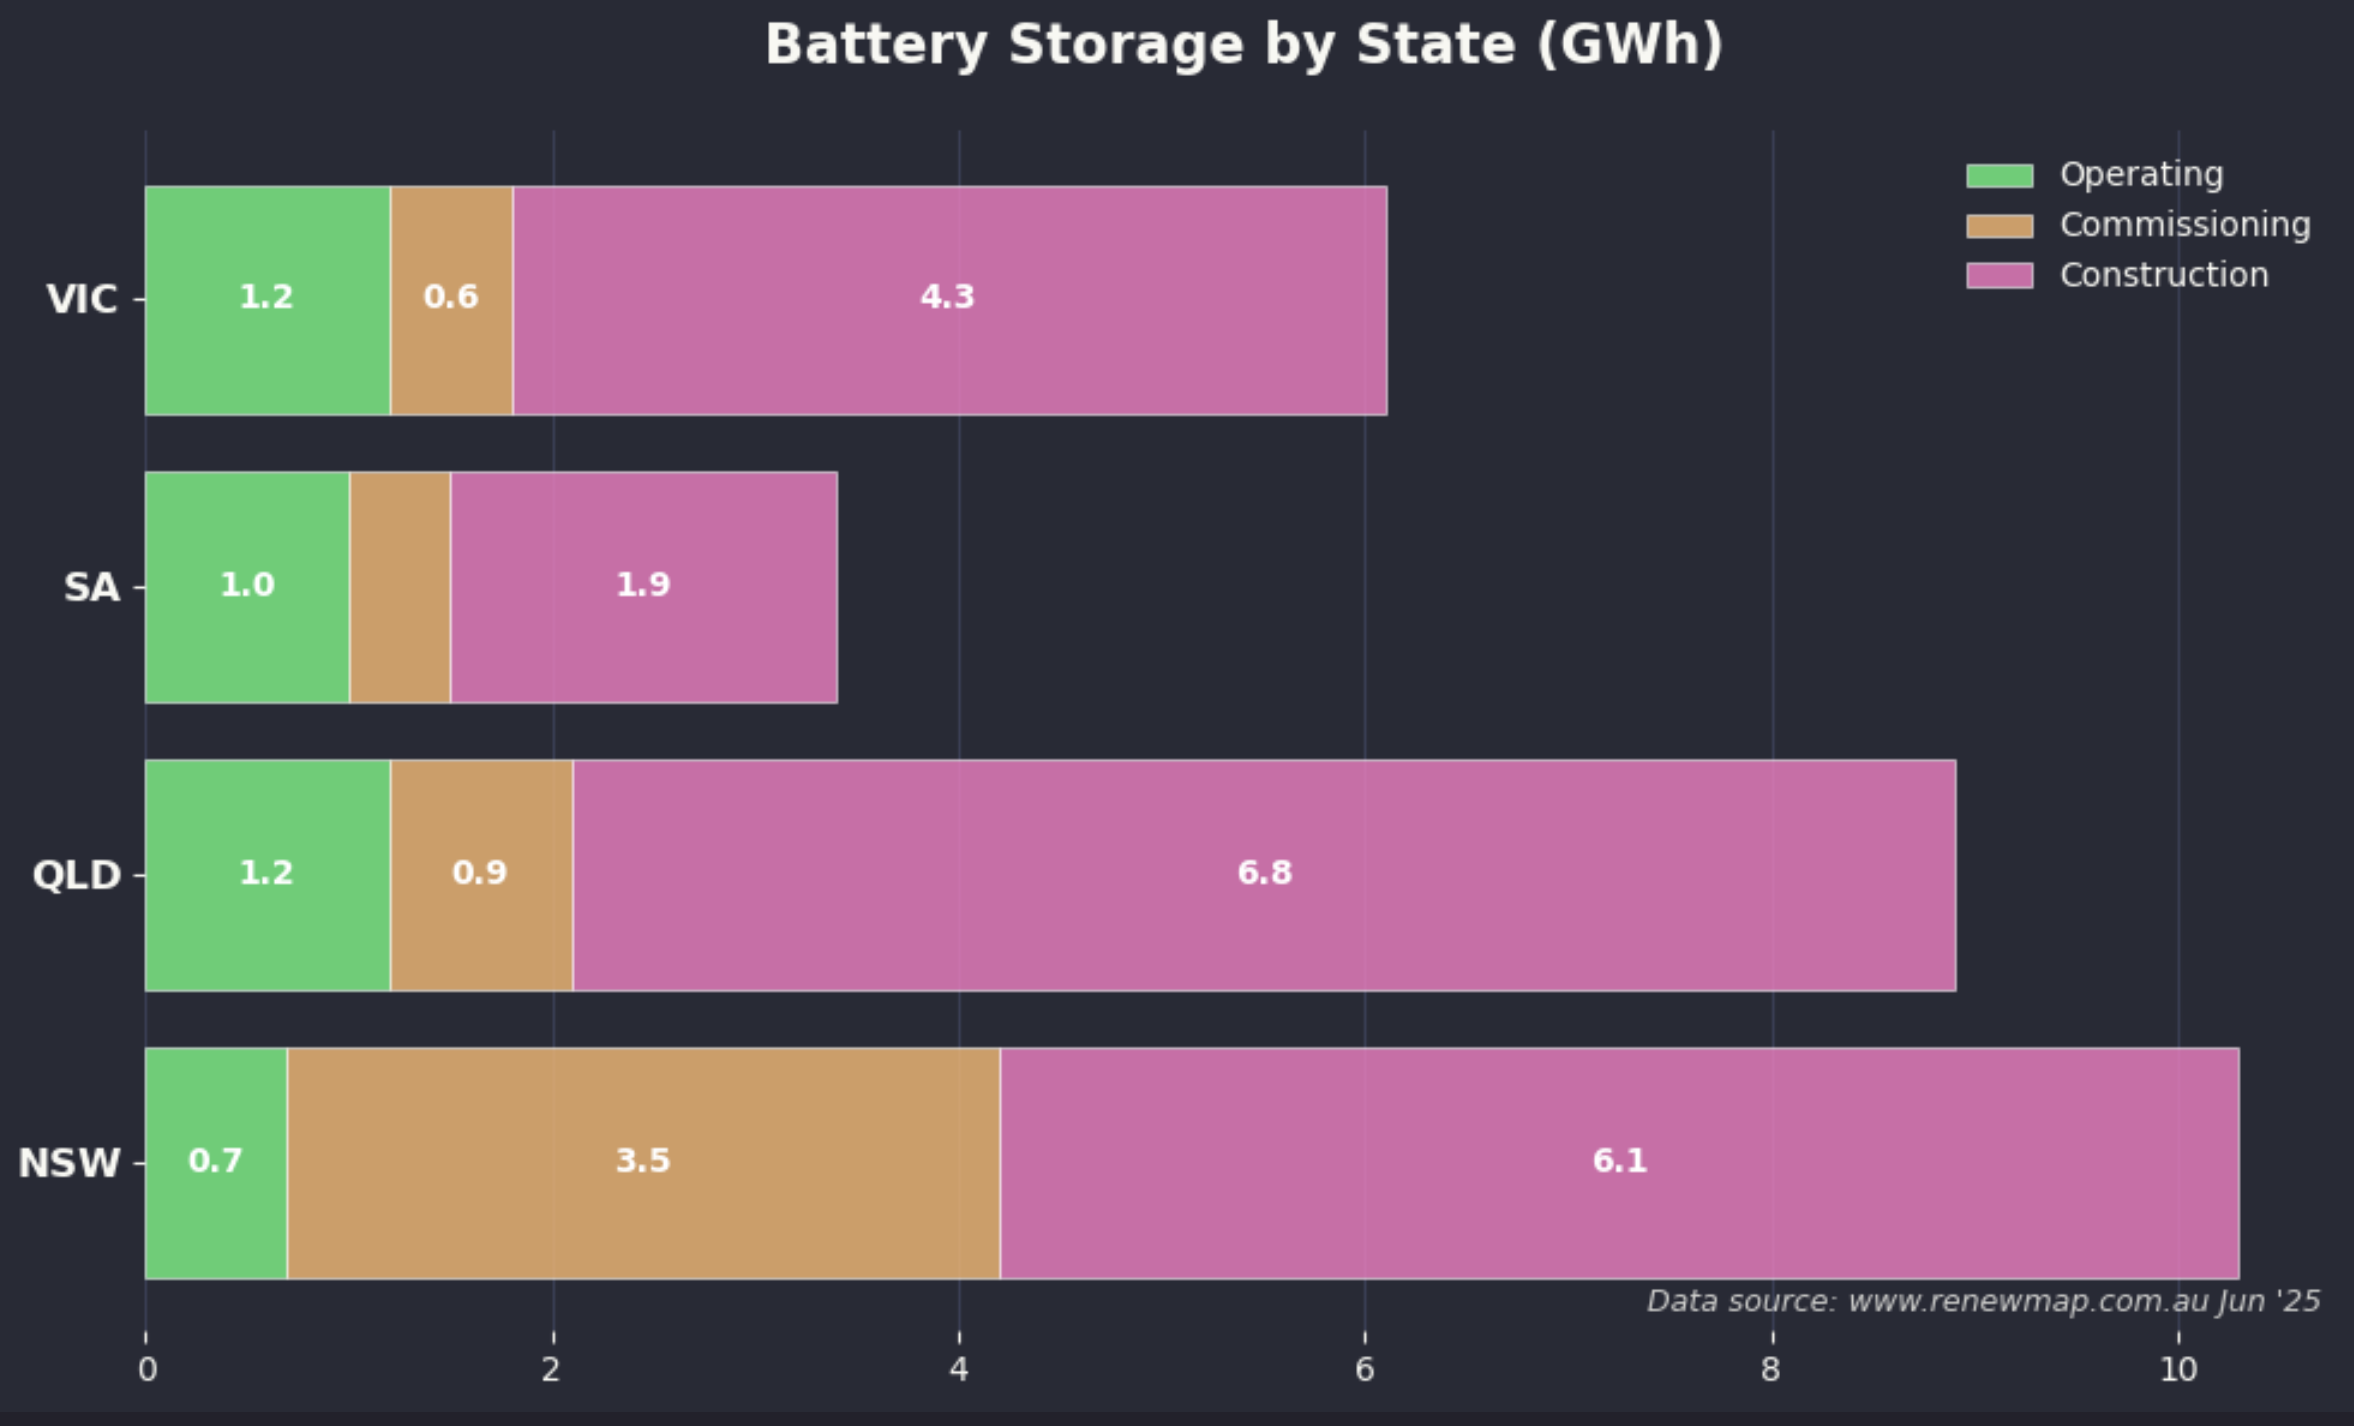
26 May
Noting tha Golden Plains max output is now over 400 MW, whereas MacIntyre has yet to get over 220 MW. Also that in South Australia batteries are starting to show up in a more meaningful way although still nothing like where they will be across the entire NEM in another 18 months.
16 May
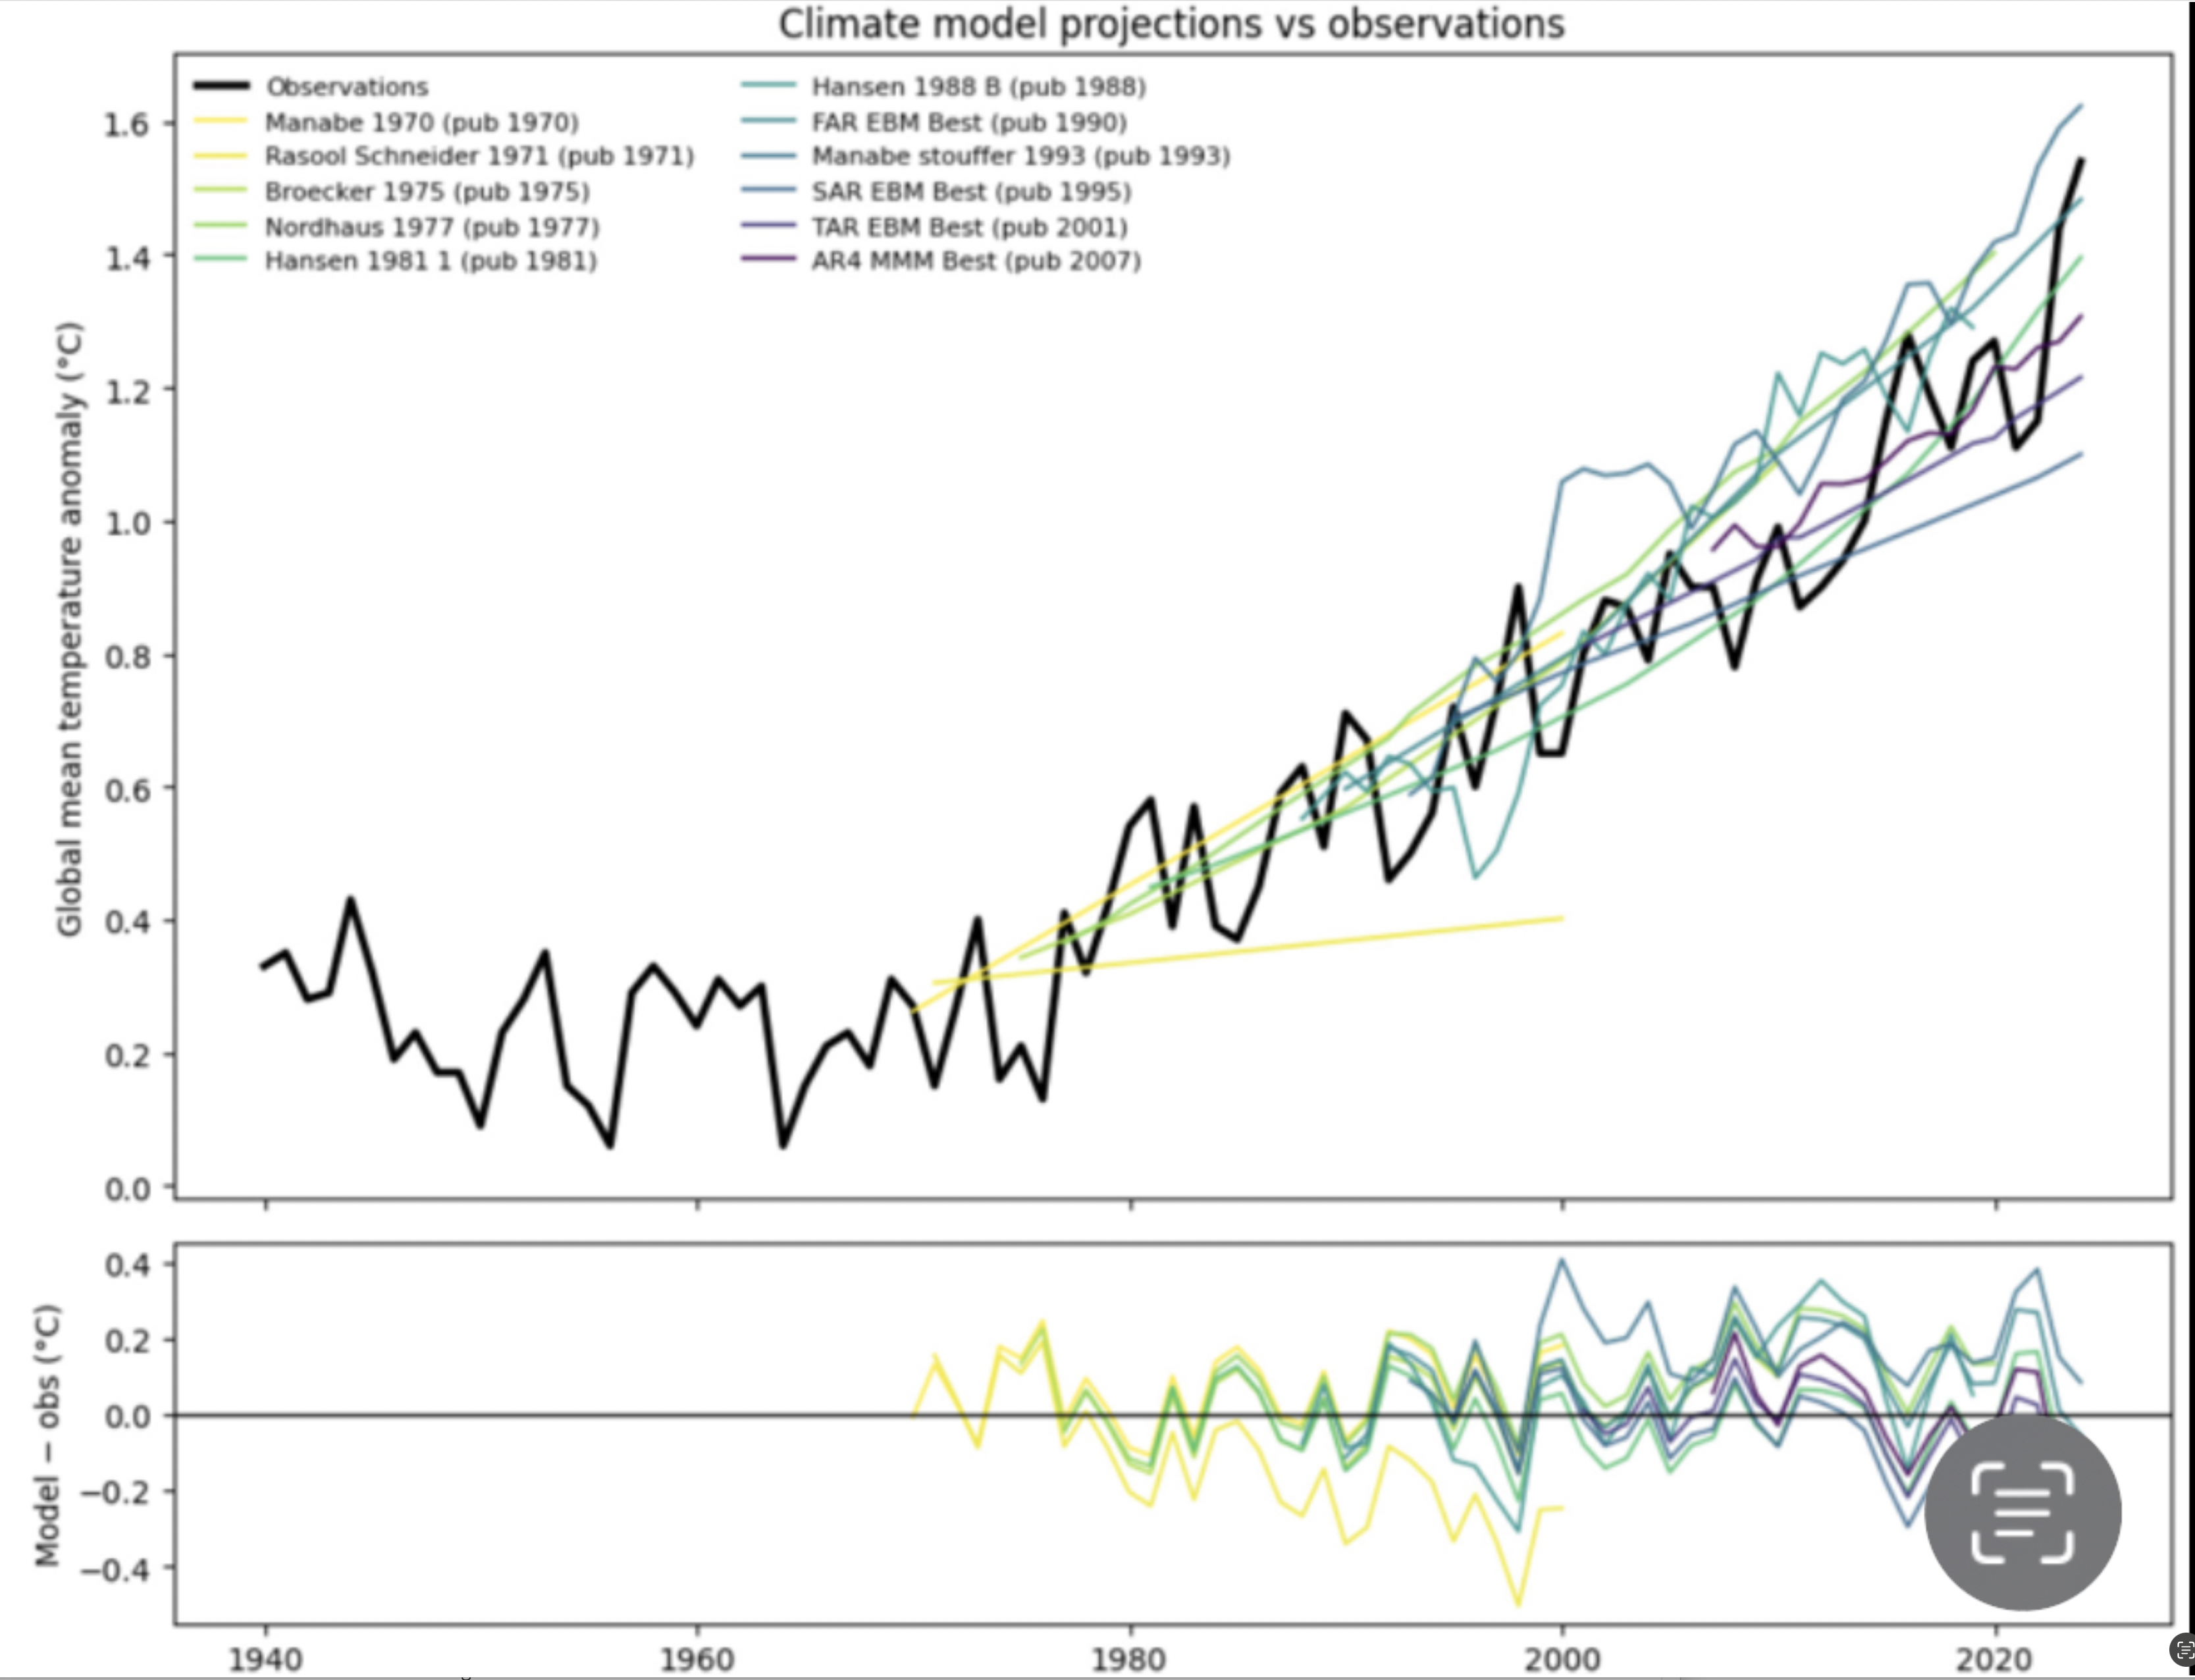
A couple of charts. The first from one of the most interesting climate science people out there, Zeke Hausfather who has updated a chart showing how well the original 1970 climate science forecasts have turned out. As Zeke points out when the forecasts were prepared they were at odds with history. So quite daring.
and the second just shows this year’s depressing Sea Ice extent via the European winter now of course in late Spring. 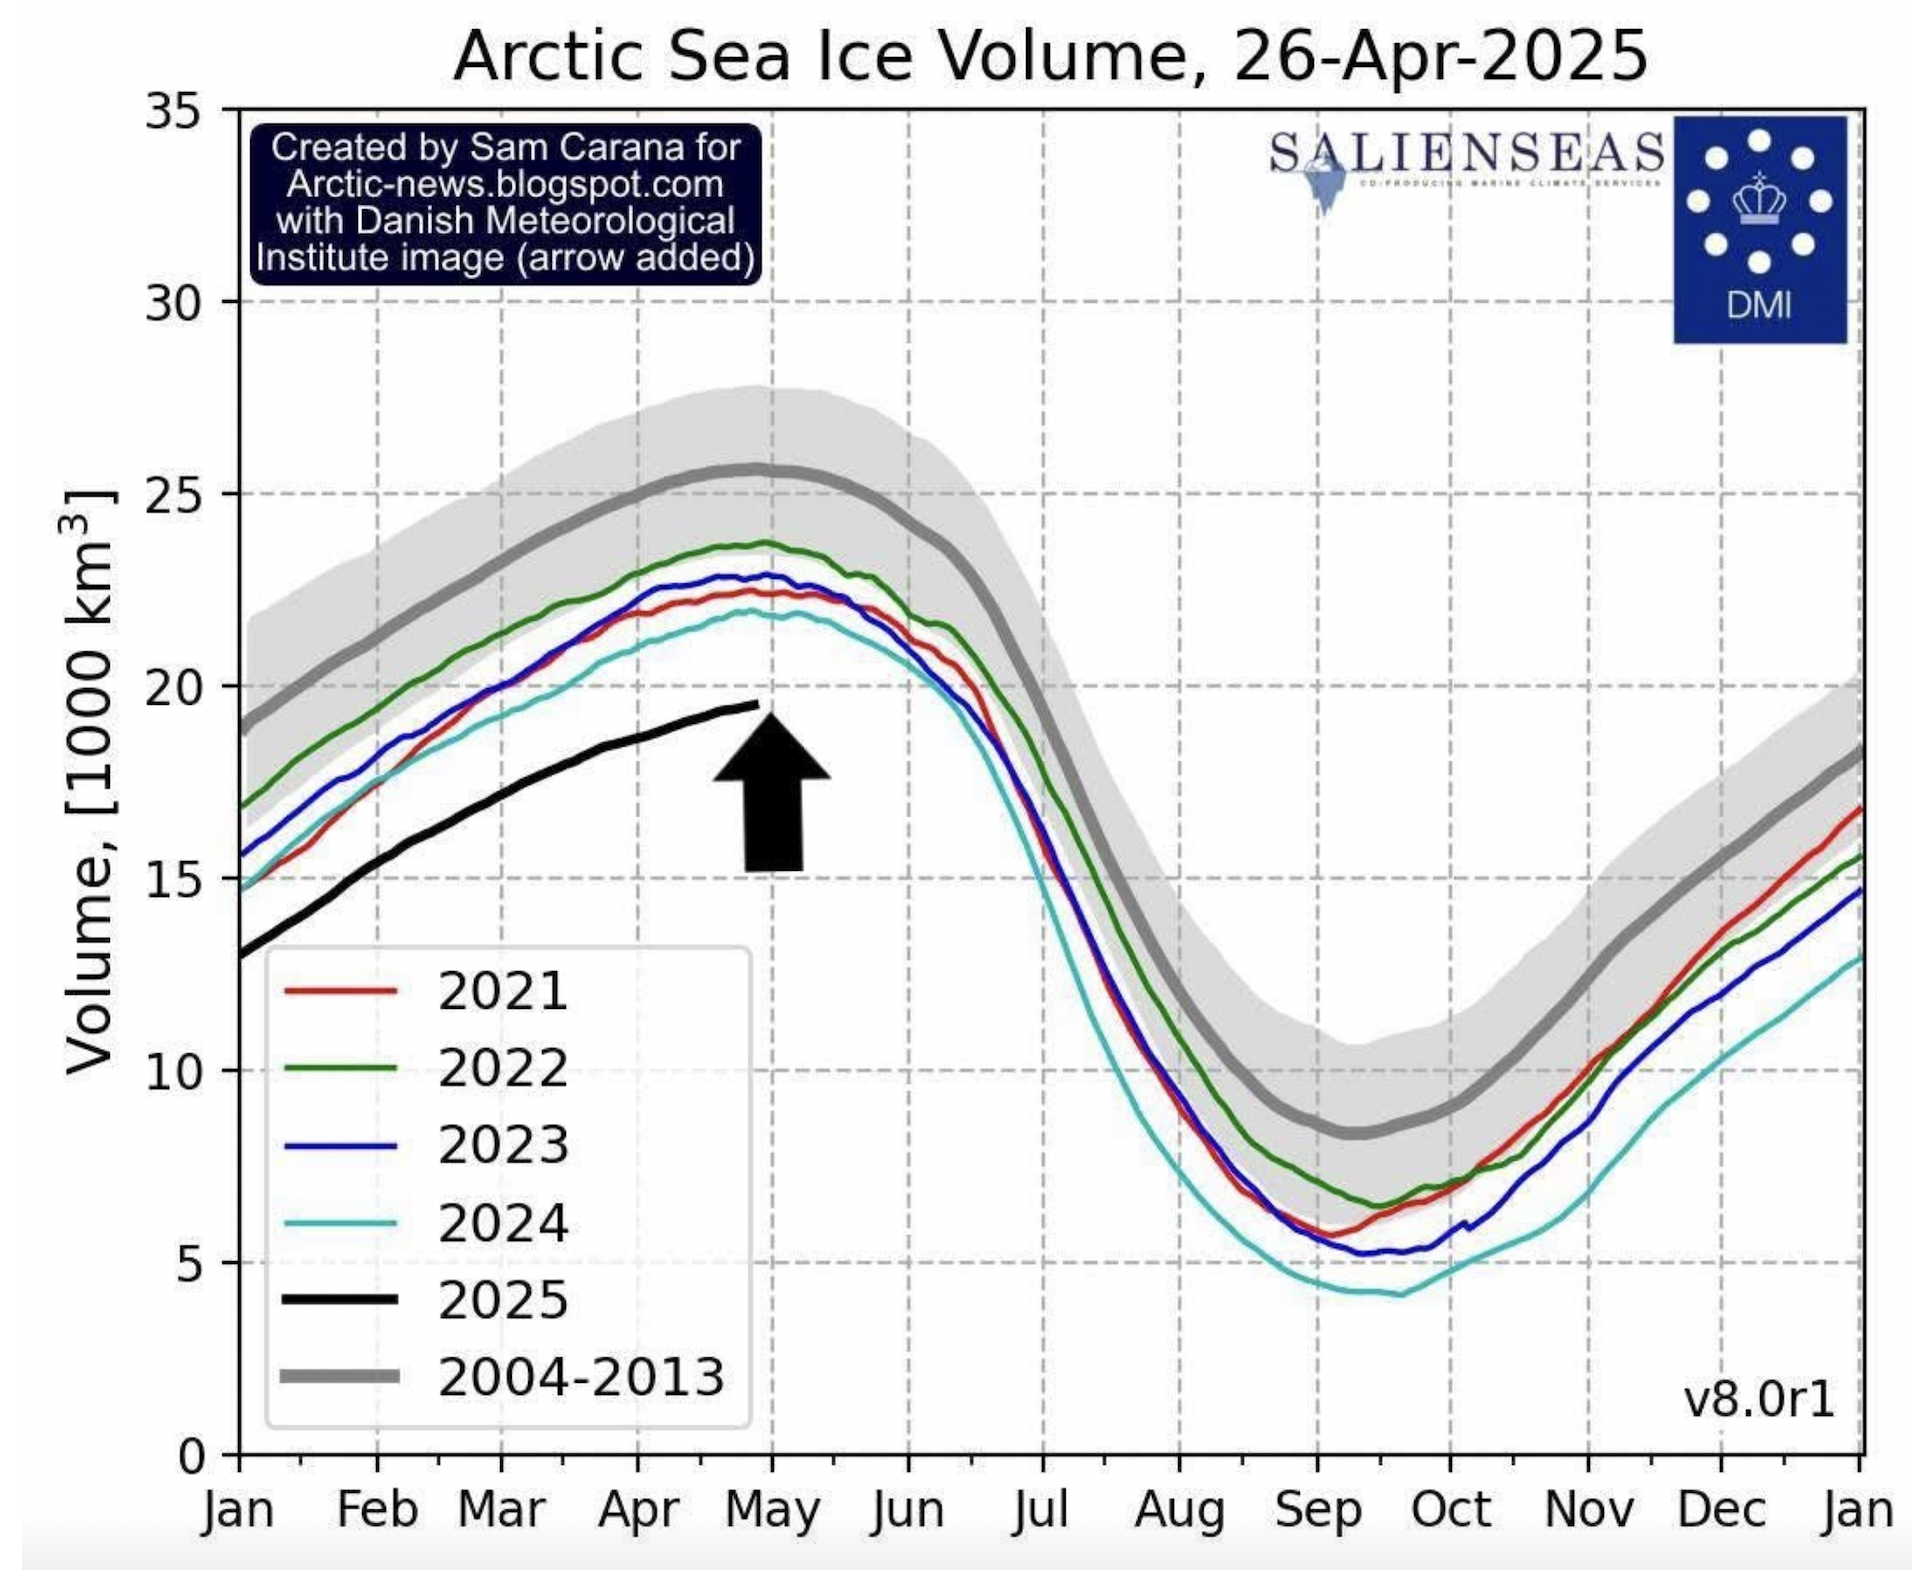
7 May
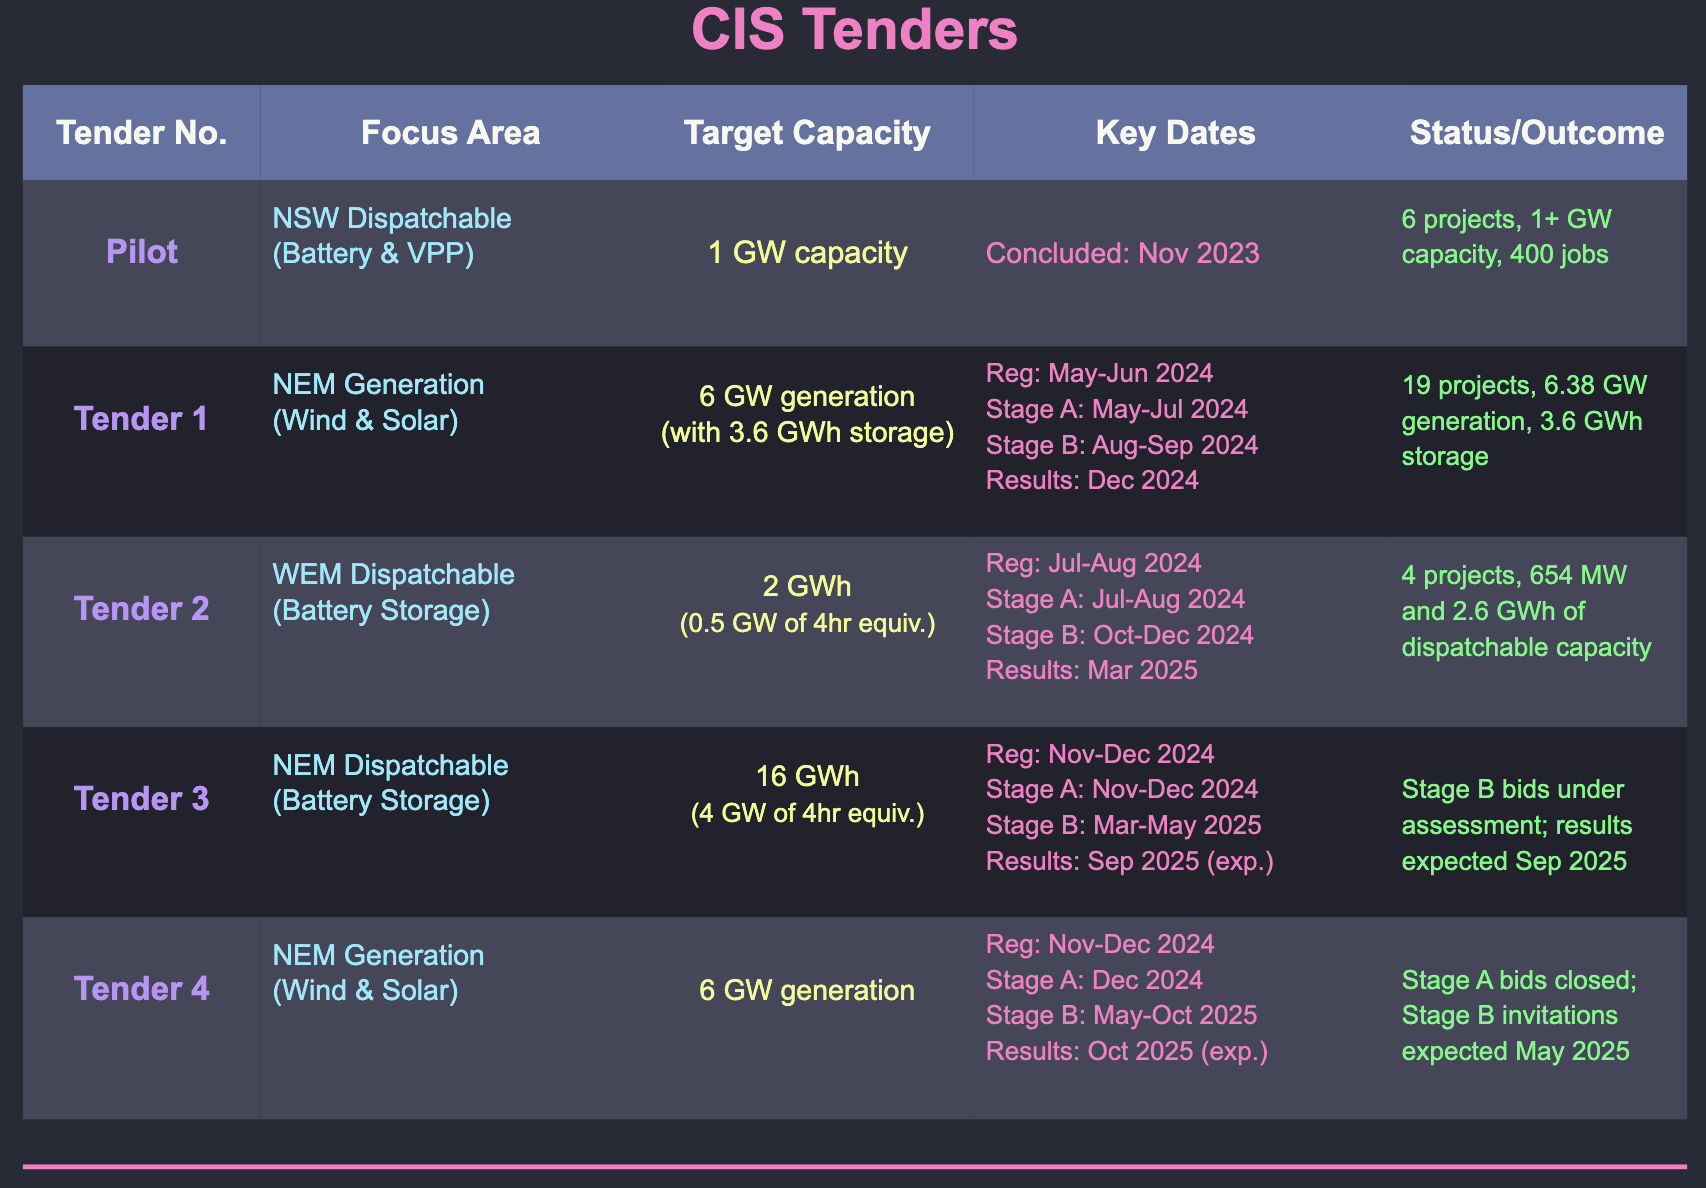
The CIS tender contemplates support for 23 GW of renewable energy installed by 2030. So far result for one tender of 6 GW have been announced and results are expected this October for the second 6 GW. The award of CIS contracts, and the announcement of a contract winner is not the same as having said award actually signed as various pre conditions including a transmission agreement have to be satisfied equally does not mean the generation will be built. In fact in some ways its only the first stage.
So in my opinion the number one priority for the new Federal Govt is to make sure that the generation and transmission is actually built. There are other areas of policy that can be developed but the basic bread and butter is turning contract awards into electricity generating infrastructure.
1 May
Heading into the Federal election I see the choice between on the one hand an energy policy and direction that has delivered around 40% renewables with a clear industry supported path to 70-80% renewables by 2030. This path is not without issues but they are increasingly well understood and whether its social value, system control, system resilience, or spot price spikes solutions have been identified. On the other hand we have an alternative policy that is untested in Australia, ill suited to what has been built so far and would essentially be a Federal Govt industry. There are clear and obvious risks around timing and cost and Australia’s carbon emissions will be way higher. The alternative policy does not, with some exceptions, have industry support. I don’t see how there is any real choice but to support the ALP and other politicians of the same renewables mind set whether teals(my preference), greens or others.
24 Apr
Gas demand is uncertain, but excluding LNG on the East Coast cost and electrification will reduce demand but the medium term gas generation requirement might go up. Indeed will go up in AEMO’s view, but in my view to some extent it depends on the amount of storage built.
Even allowing for the European carbon cost gas still would be cheaper at around $19/GJ than hydrogen. 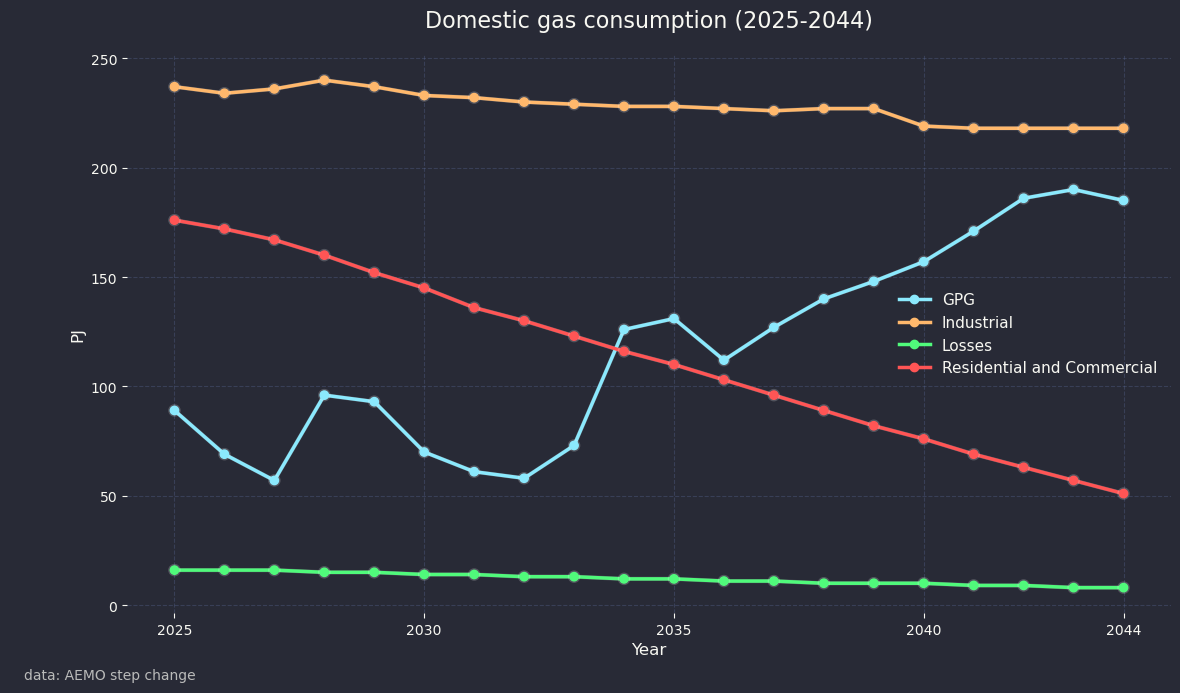
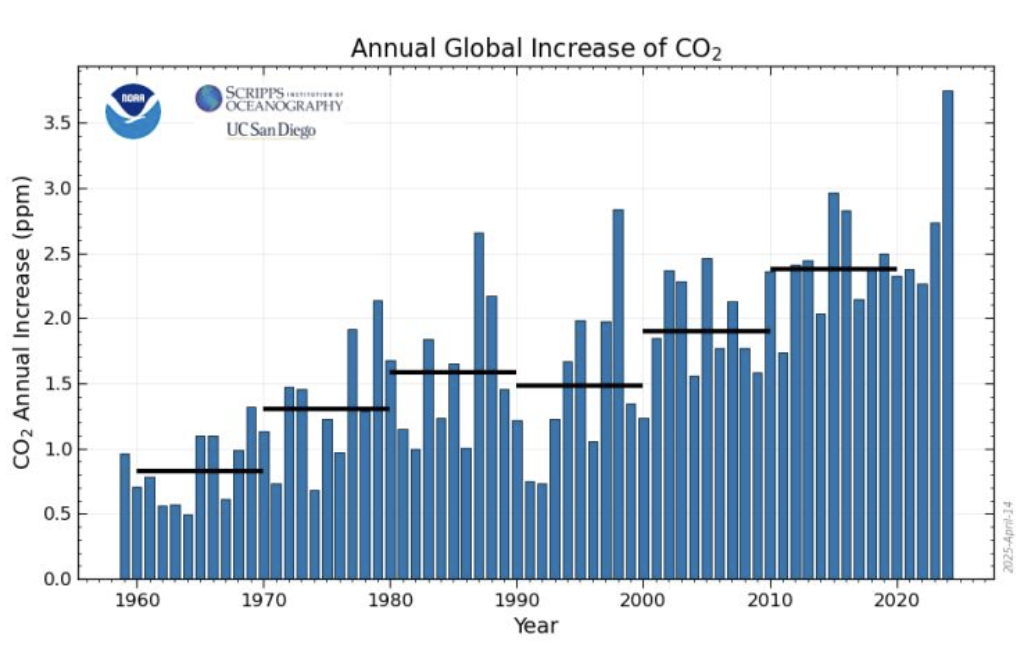
16 Apr - Natural sinks for carbon emissions are falling.
https://www.linkedin.com/feed/update/urn:li:activity:7318075469566734336/
12 Apr
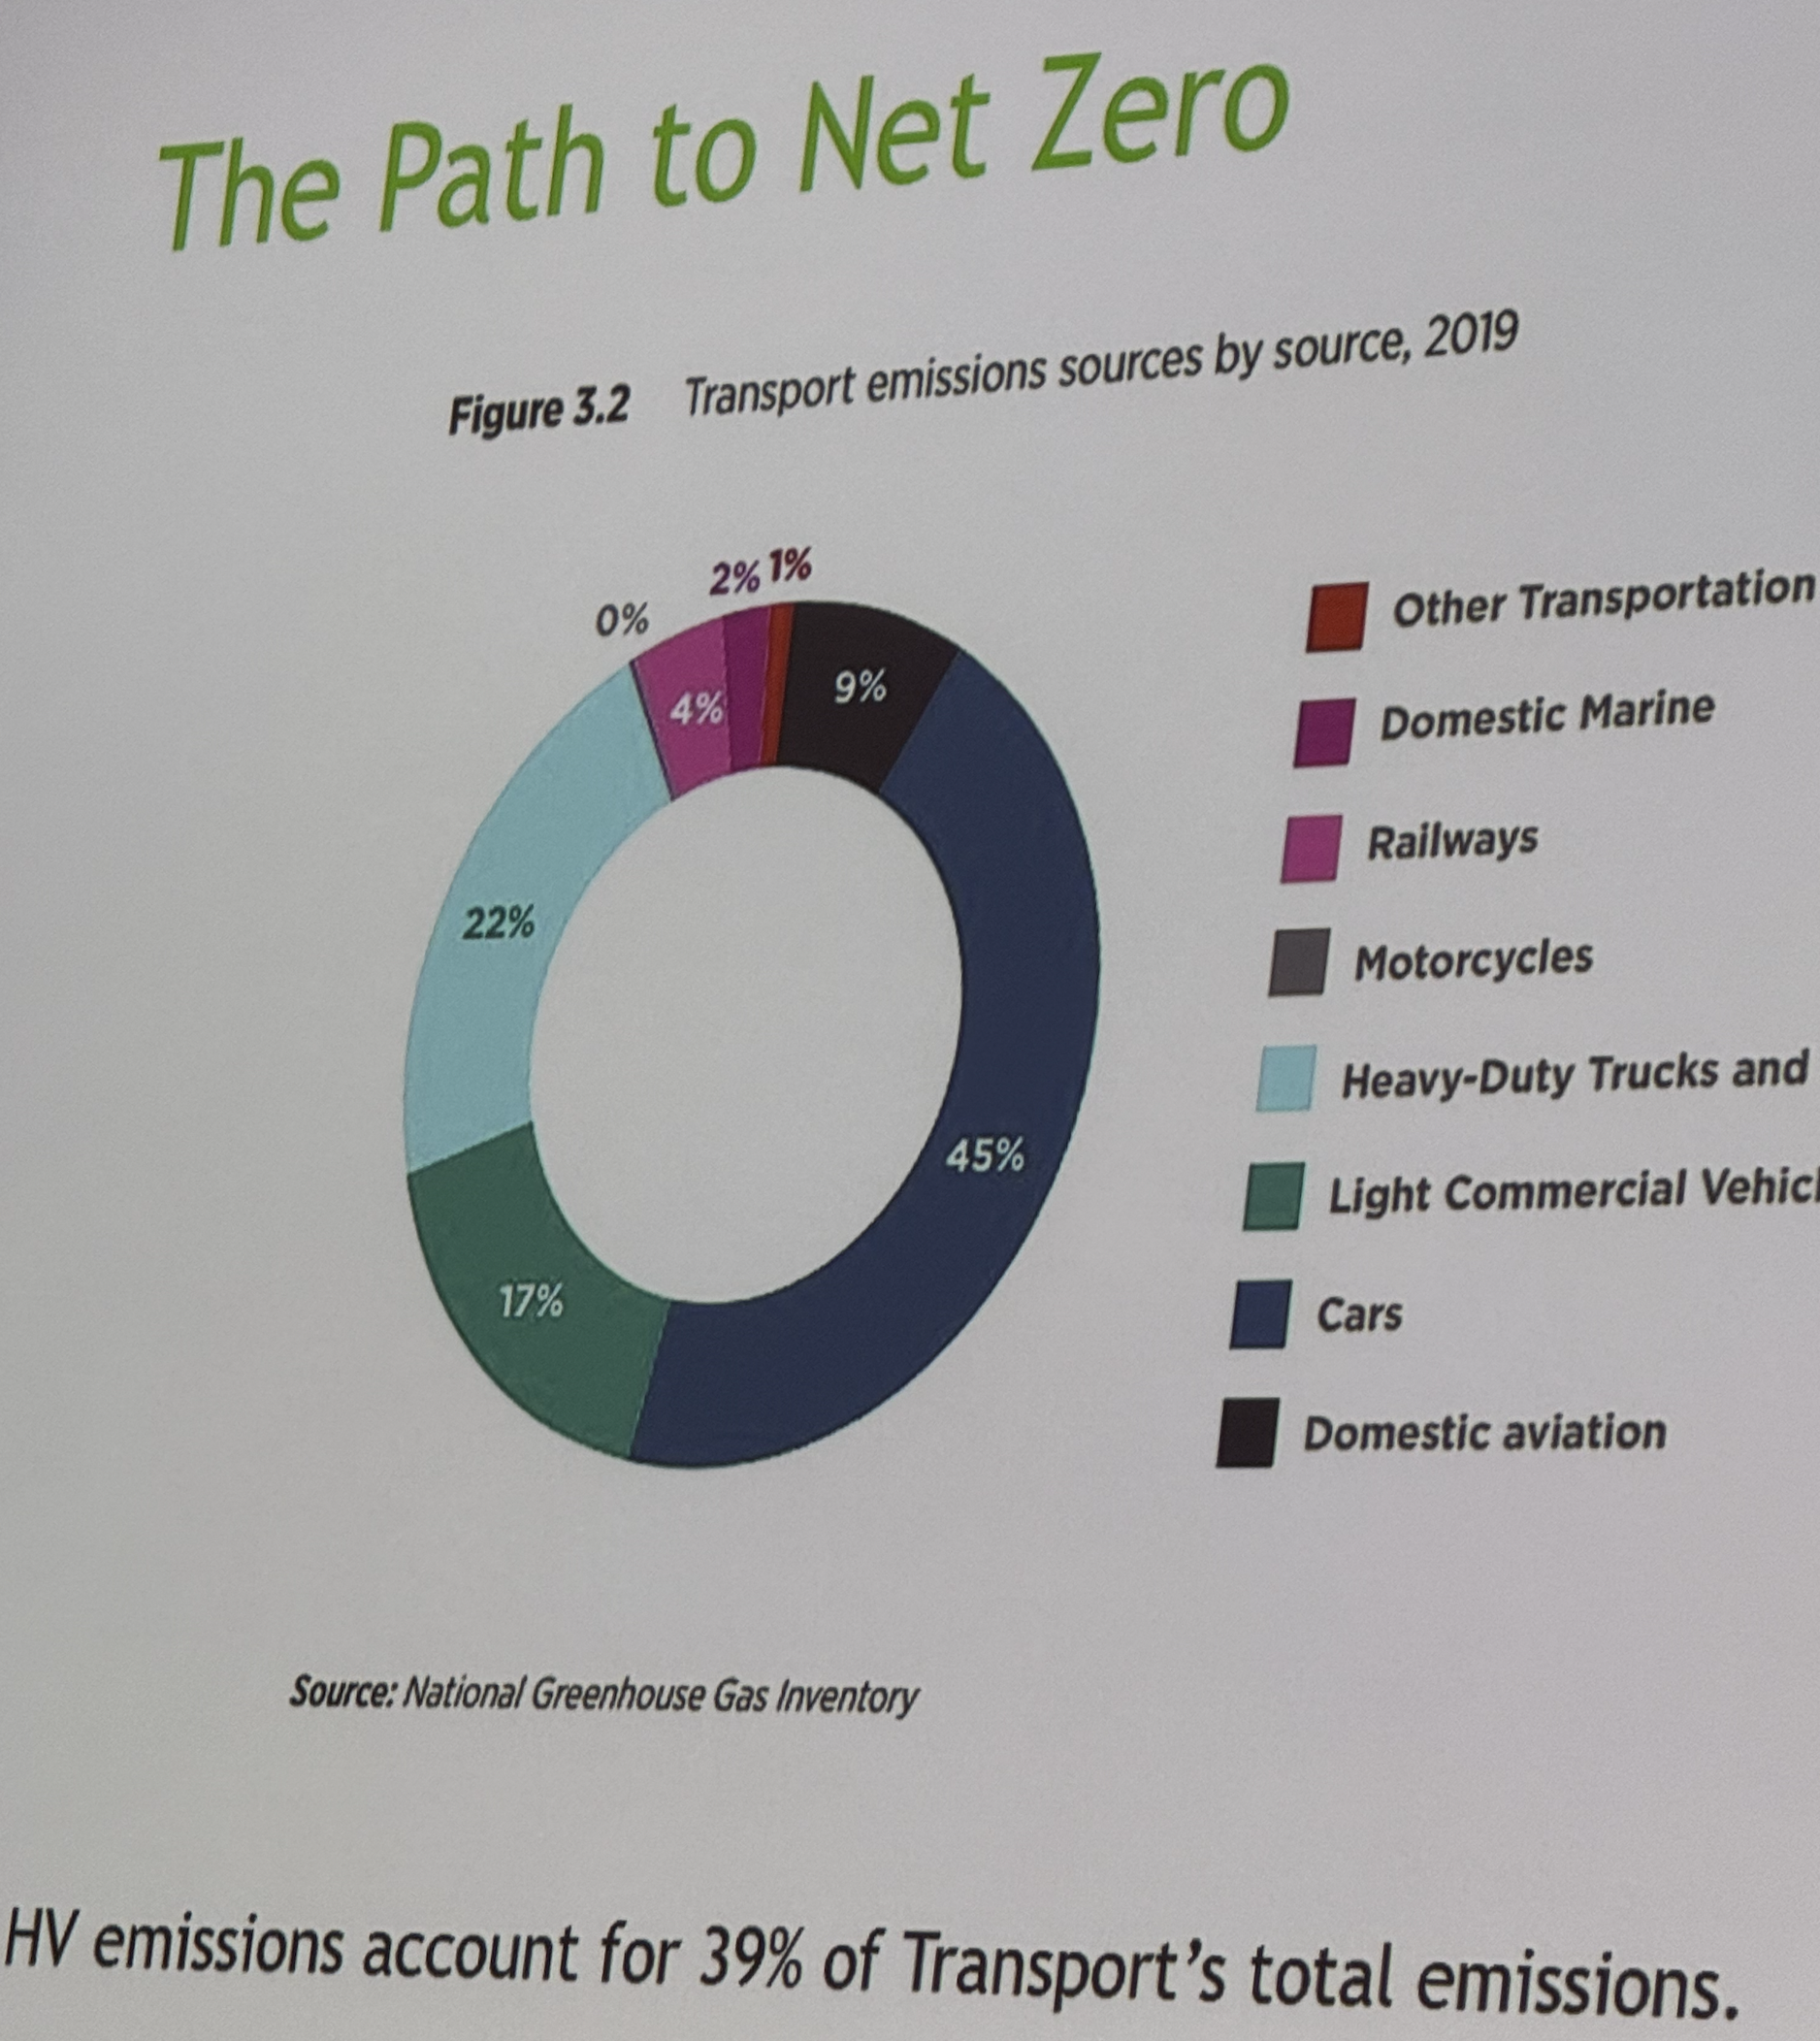
A couple of charts from smart energy that made me think. First from Keith Lovegrove detailing final energy consumption and noting that heat uses 30% of demand compared to 20% for electricity. “The Australian Industrial Process Heat Market”
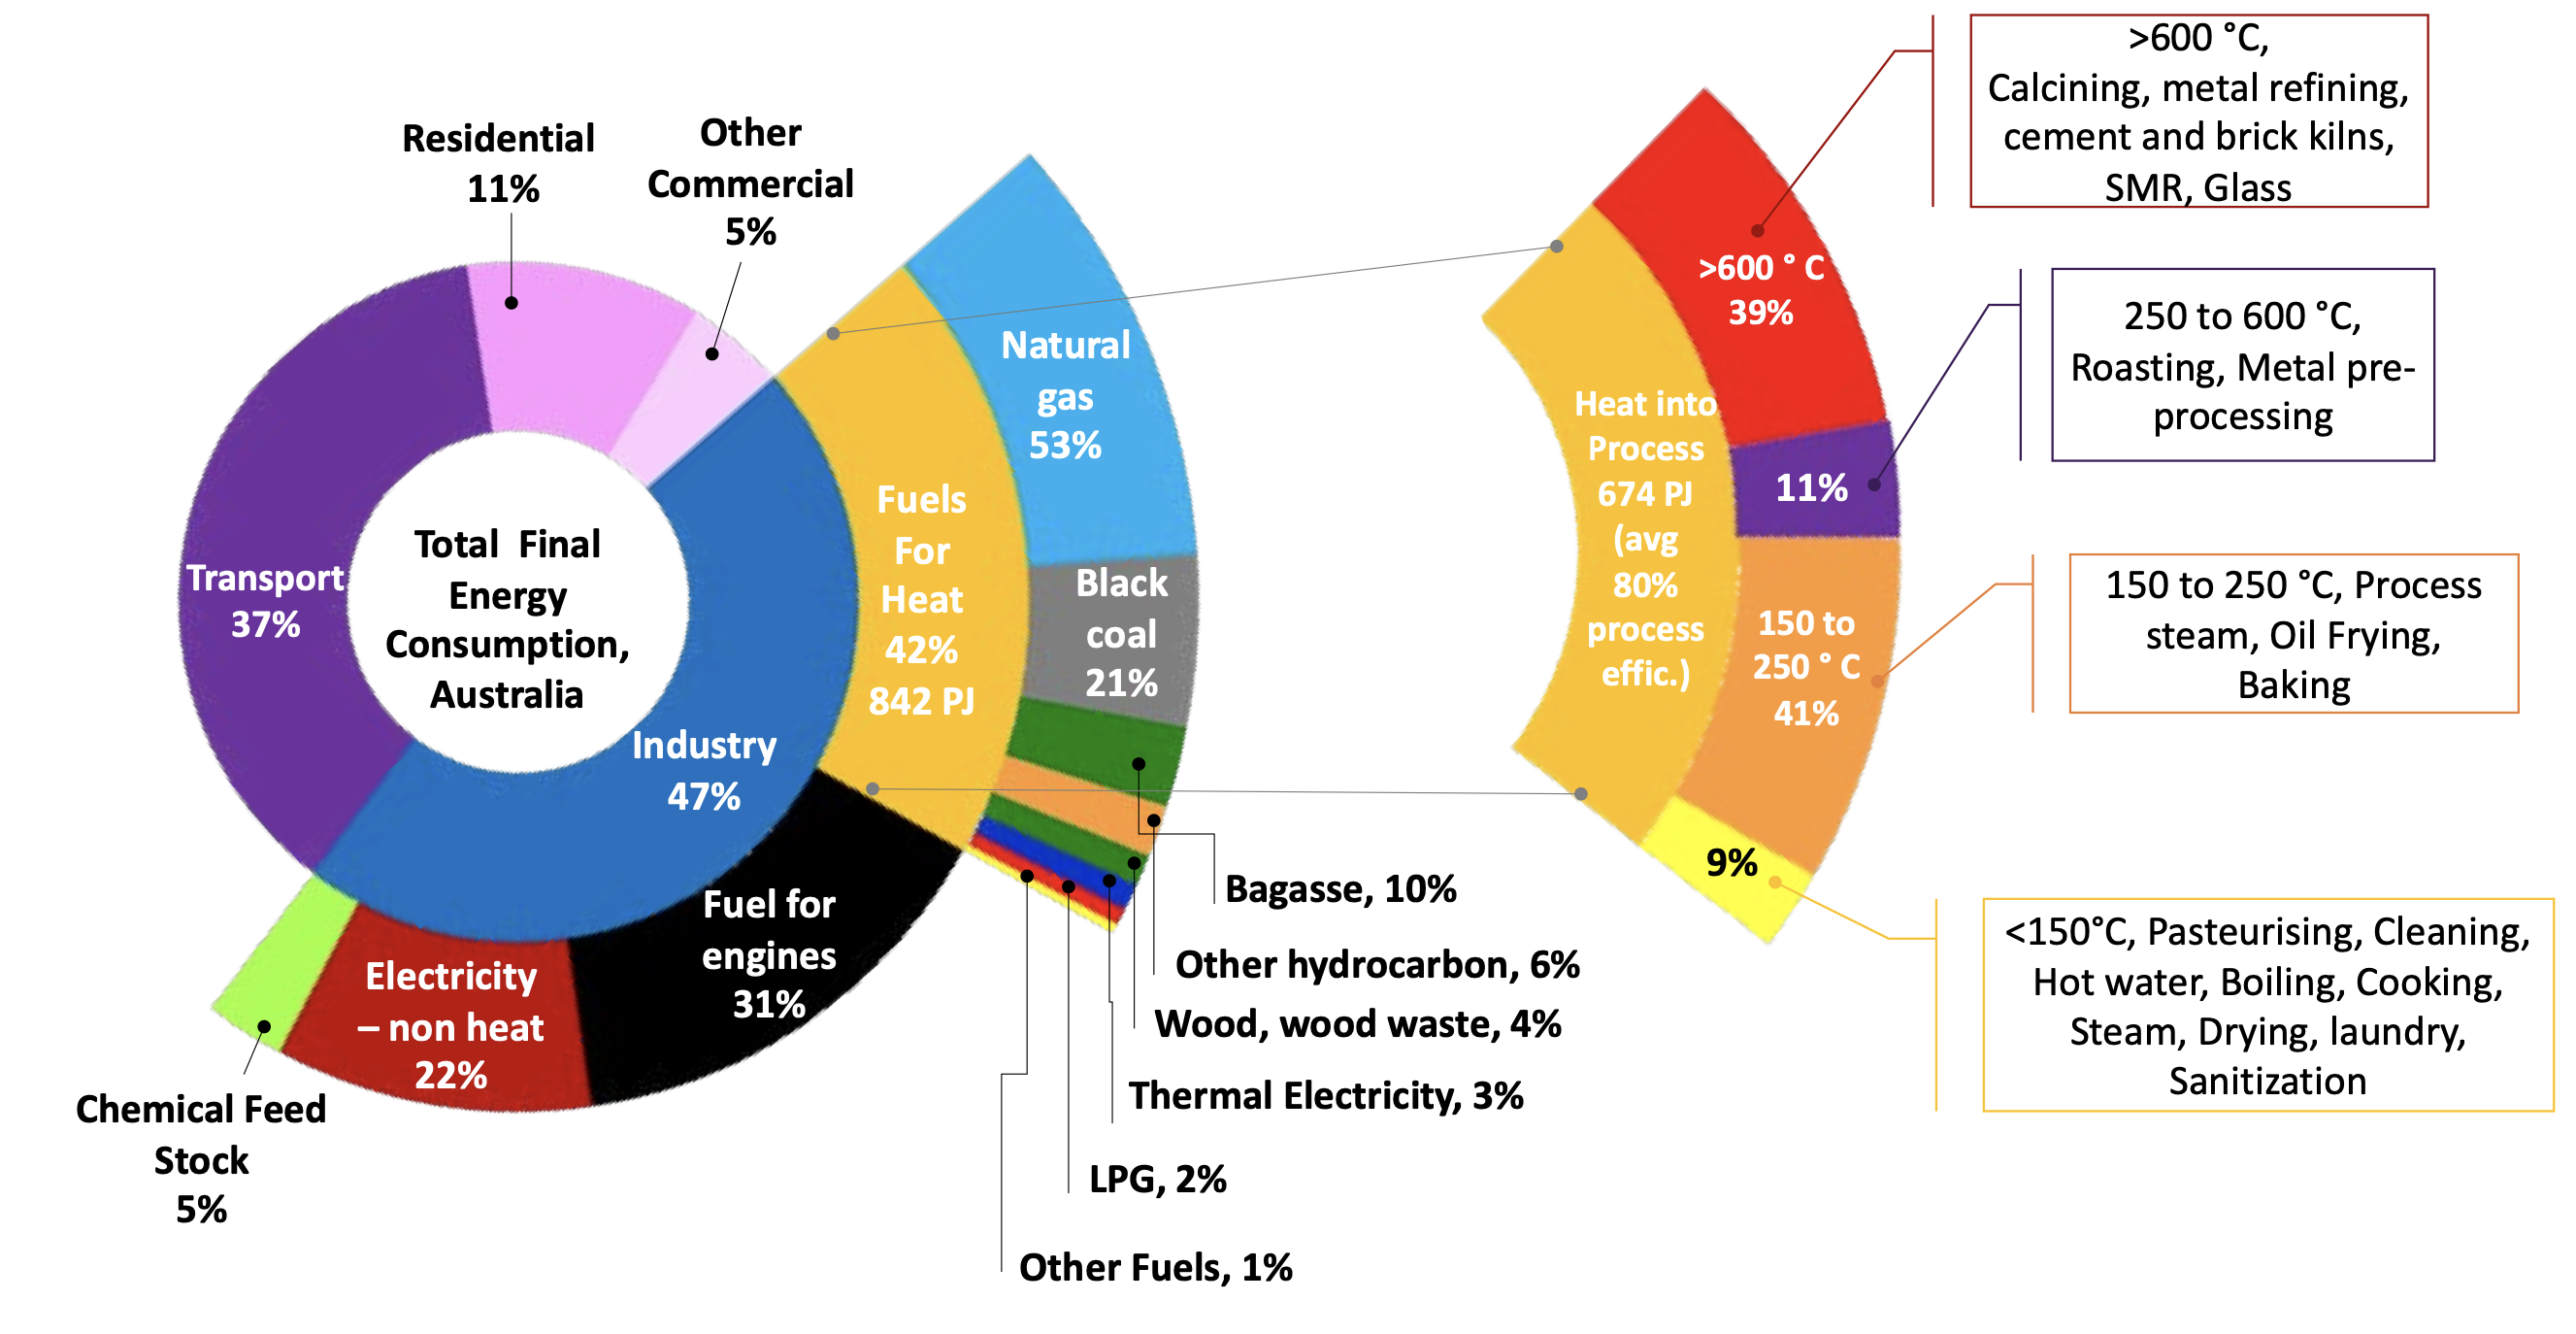
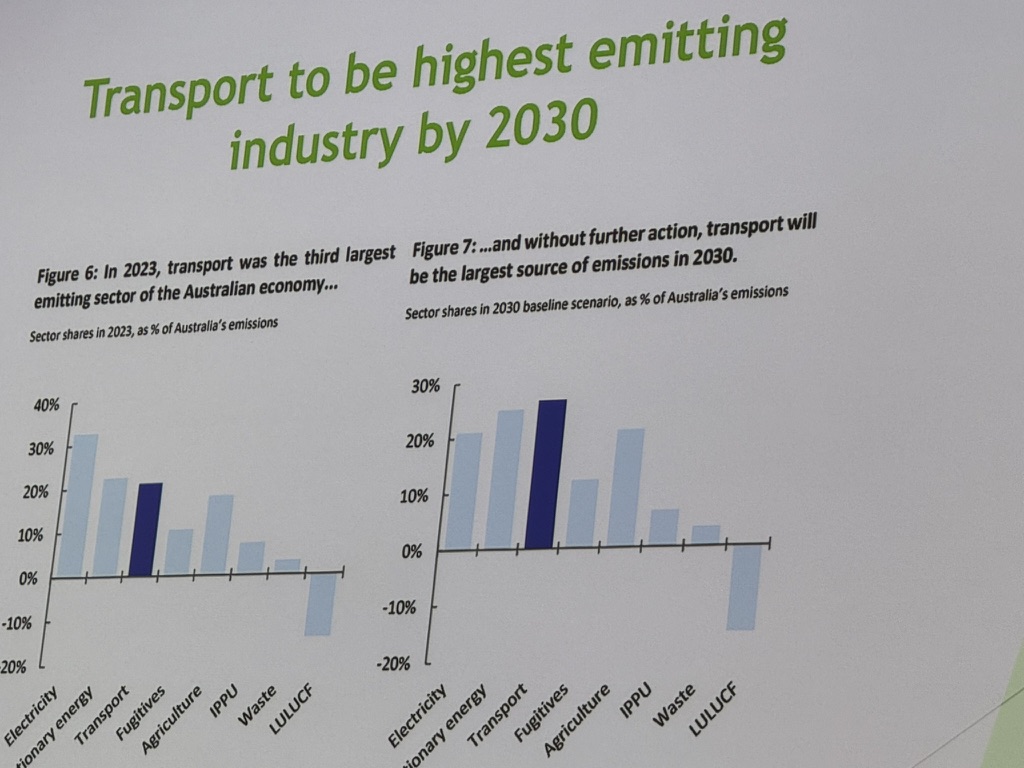
That was not unexpected based on previous work but in TIL (things I learned) it was the almost incidental presentation by Todd Hacking CEO of the Heavy Vehicle Association that made the most impact. There is no policy for decarbonising trucks in Australia, zero, even thought they will be about 10% of total emissions by 2030.
7 Apr
In my LLM and energy initiation note back in February I grandiosely talked about refining the PUE metric to allow for the processor output, ultimately amount of computing per unit of input energy to the data centre. Its somewhat please therefore to see Nvidia talking the same way as discussed by Foundation Capital.
Jensen argues that the same logic now applies to AI infrastructure. The inputs to these modern factories are electricity and data. The outputs are tokens – the atomic units of prediction, reasoning, and generation that power AI systems. The new unit of productivity is tokens per second per watt: a measure not only of how fast chips are, but of how efficiently intelligence can be produced at scale.
6 Apr
Like everything else the cost of gas generation has been rising. For instance this post on Linkedin shows the USA Homer City Redevelopment brownfields gas generation capital cost of US$ 2.2m/MW. And that’s brownfields. Translate to Australia at say 1 AUD = 0.65 USD, punch in a gas price of A$10/GJ and a capacity factor of 65% and I think your looking at around A$140/MWh. If you build that on a greenfields site, allow for an Australian cost premium and maybe even higher gas price you could get some big numbers. Certainly way higher than the futures price. I can’t see combined cycle gas a goer in Australia for generation investment, not without a big change in plans.
1 Apr
I wrote something on gas yesterday “Social hour at the gas rodeo” and in the TL:DR the main points were:
- The cost of gas in gas generation is not really the point. The point is the price that gas generation receives which generally is far above cost and reflects its pricing power, similar to batteries and hydro.
- There isn’t necessarily that much gas in the medium term and
- Santos has a very powerful and dominant position in the Southern Australian gas market. The LNG majors could challenge that position but have zero interest in doing so.
27 Mar
How would the electricity price look in a world of just solar and batteries? Imagine a flat load of 100 MW with just enough solar and batteries to meet that load and let’s ignore the transmission. The variable cost of solar is zero and LCOE is A$60/MWh. The batt
22 Mar
19 Mar
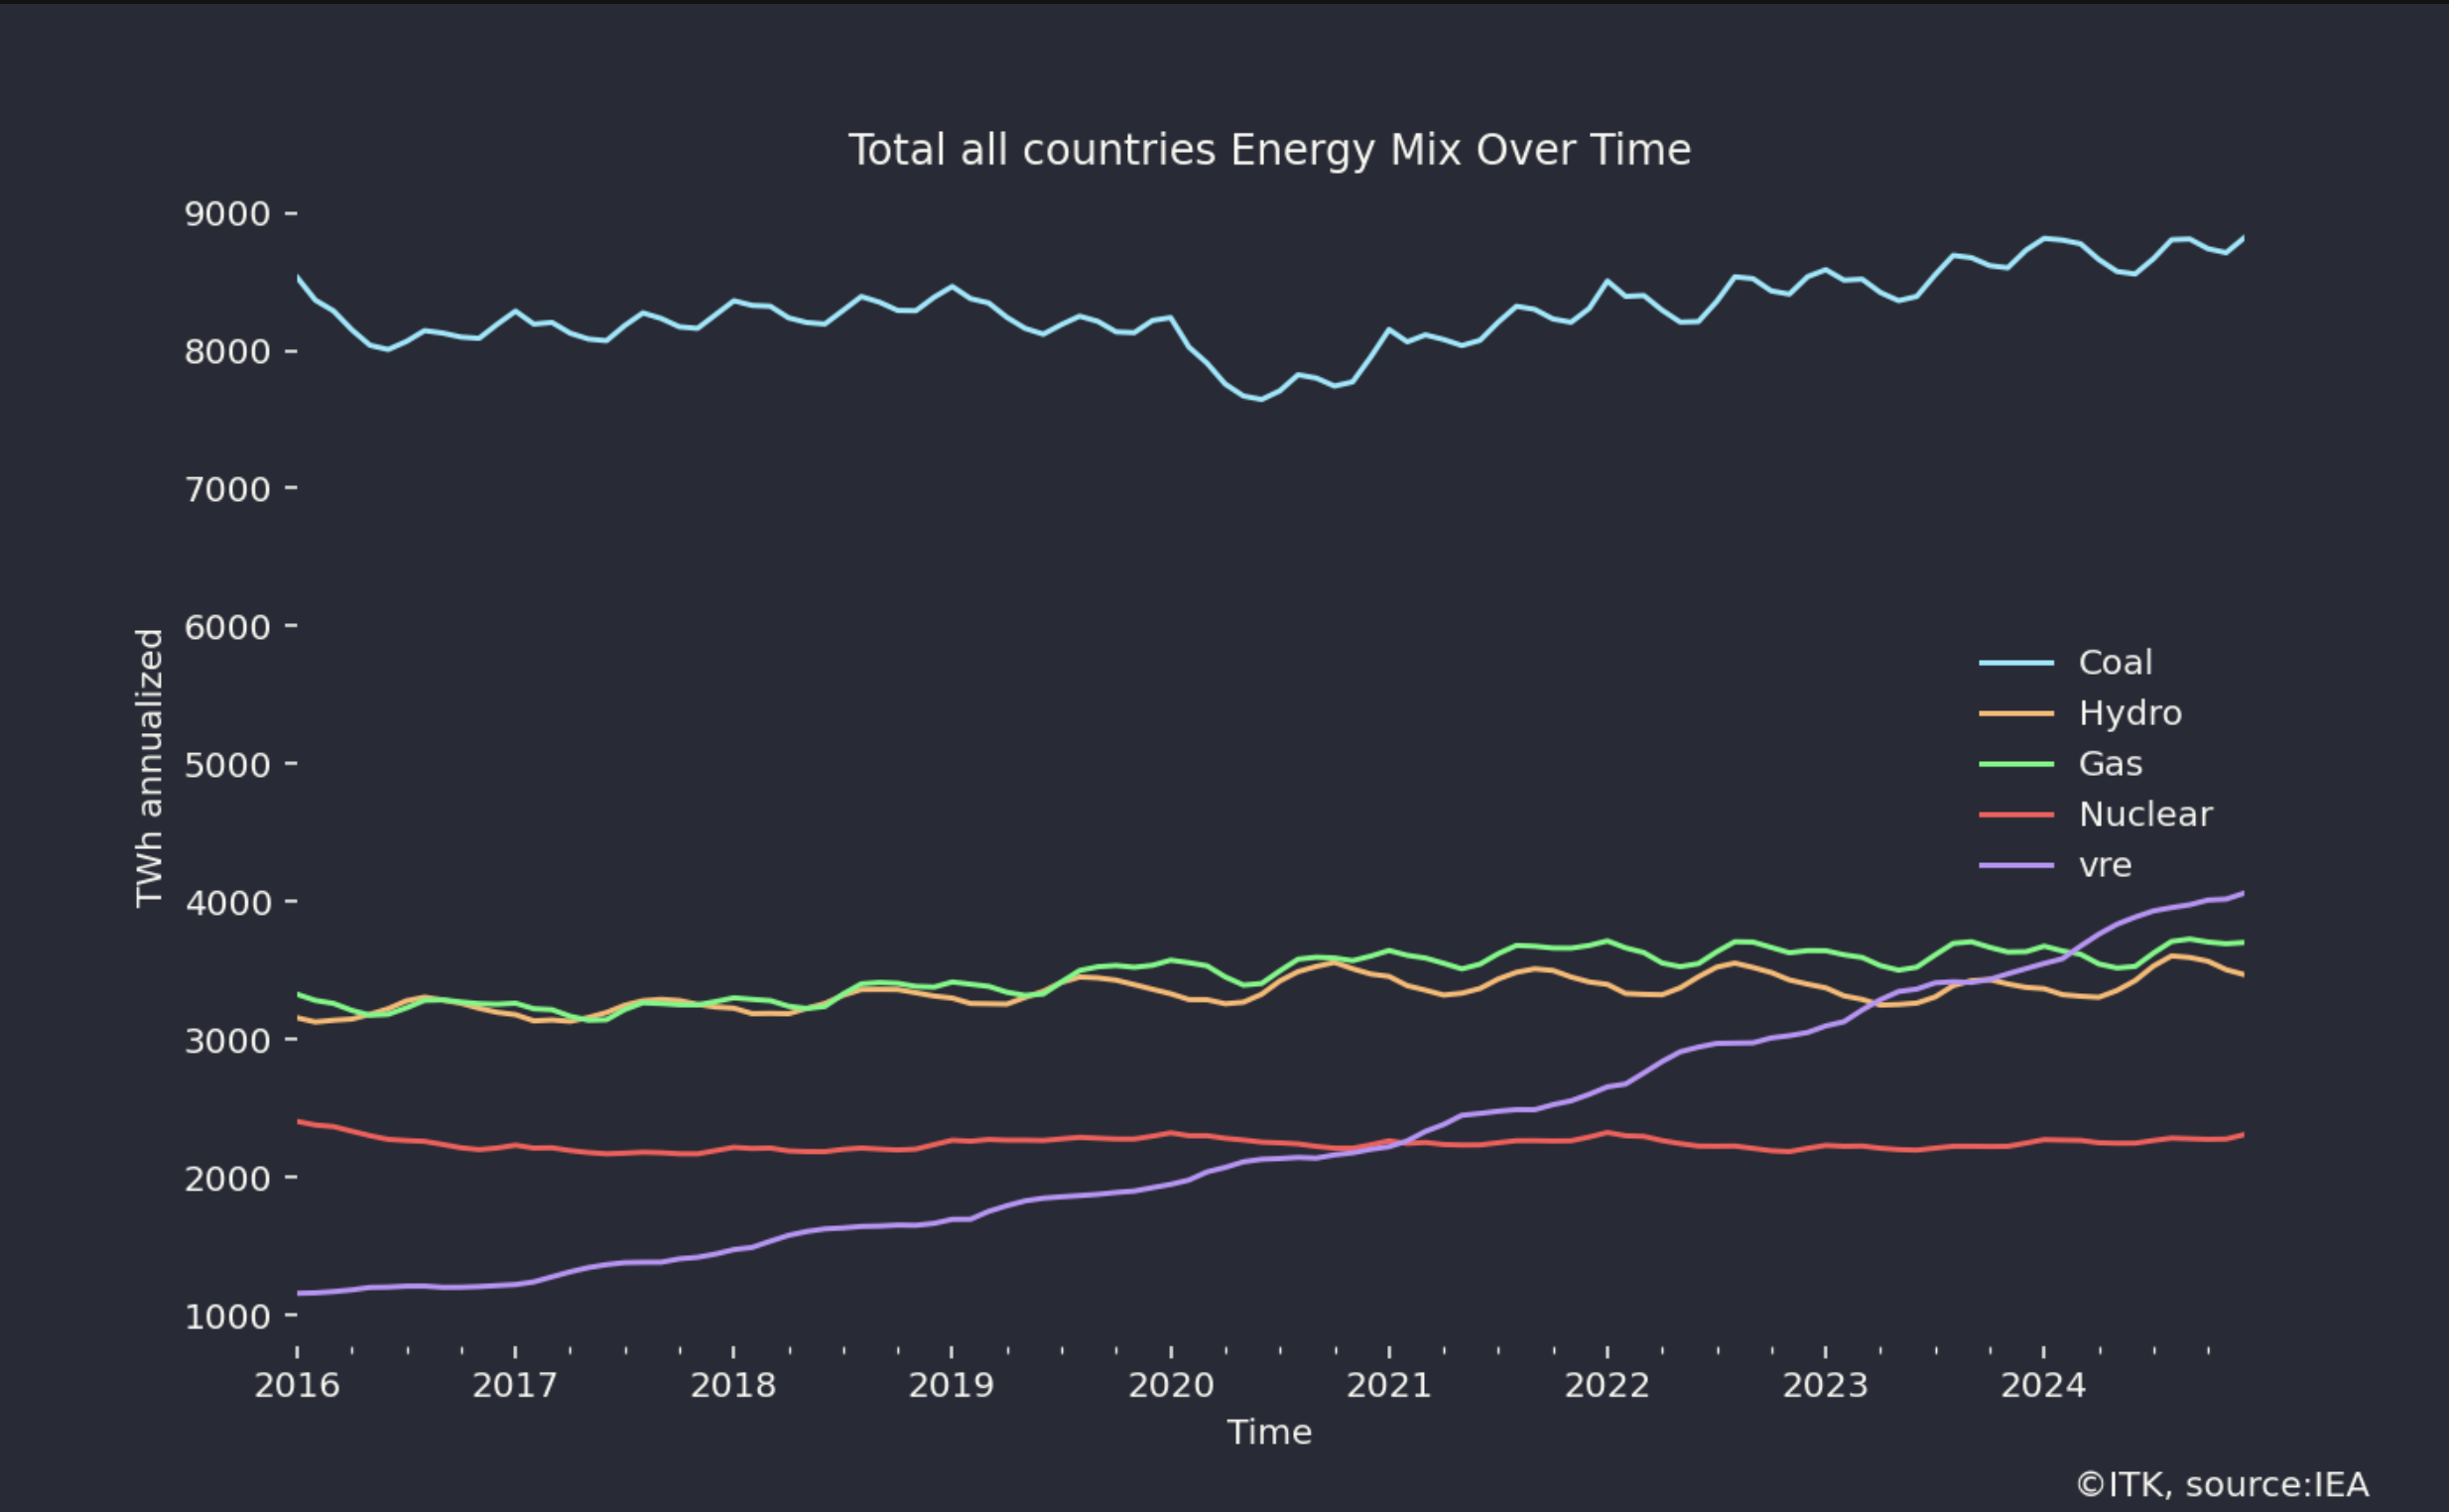
I eventually got around to adding up the data for all the countries in the IEA data base and including it in my visualise global energy app. For some reason the IEA and OECD total appear to exclude at least China even though the data is reported. My total includes the total for each country. It clearly shows that coal remains dominant but all the growth is coming from renewables.
17 Mar
I was asked and agreed to present at a politics in the pub session in Chatswood. A couple of slides from the presentation. Ahead of the presentation not sure I’m going to cover the points required.
12 Mar
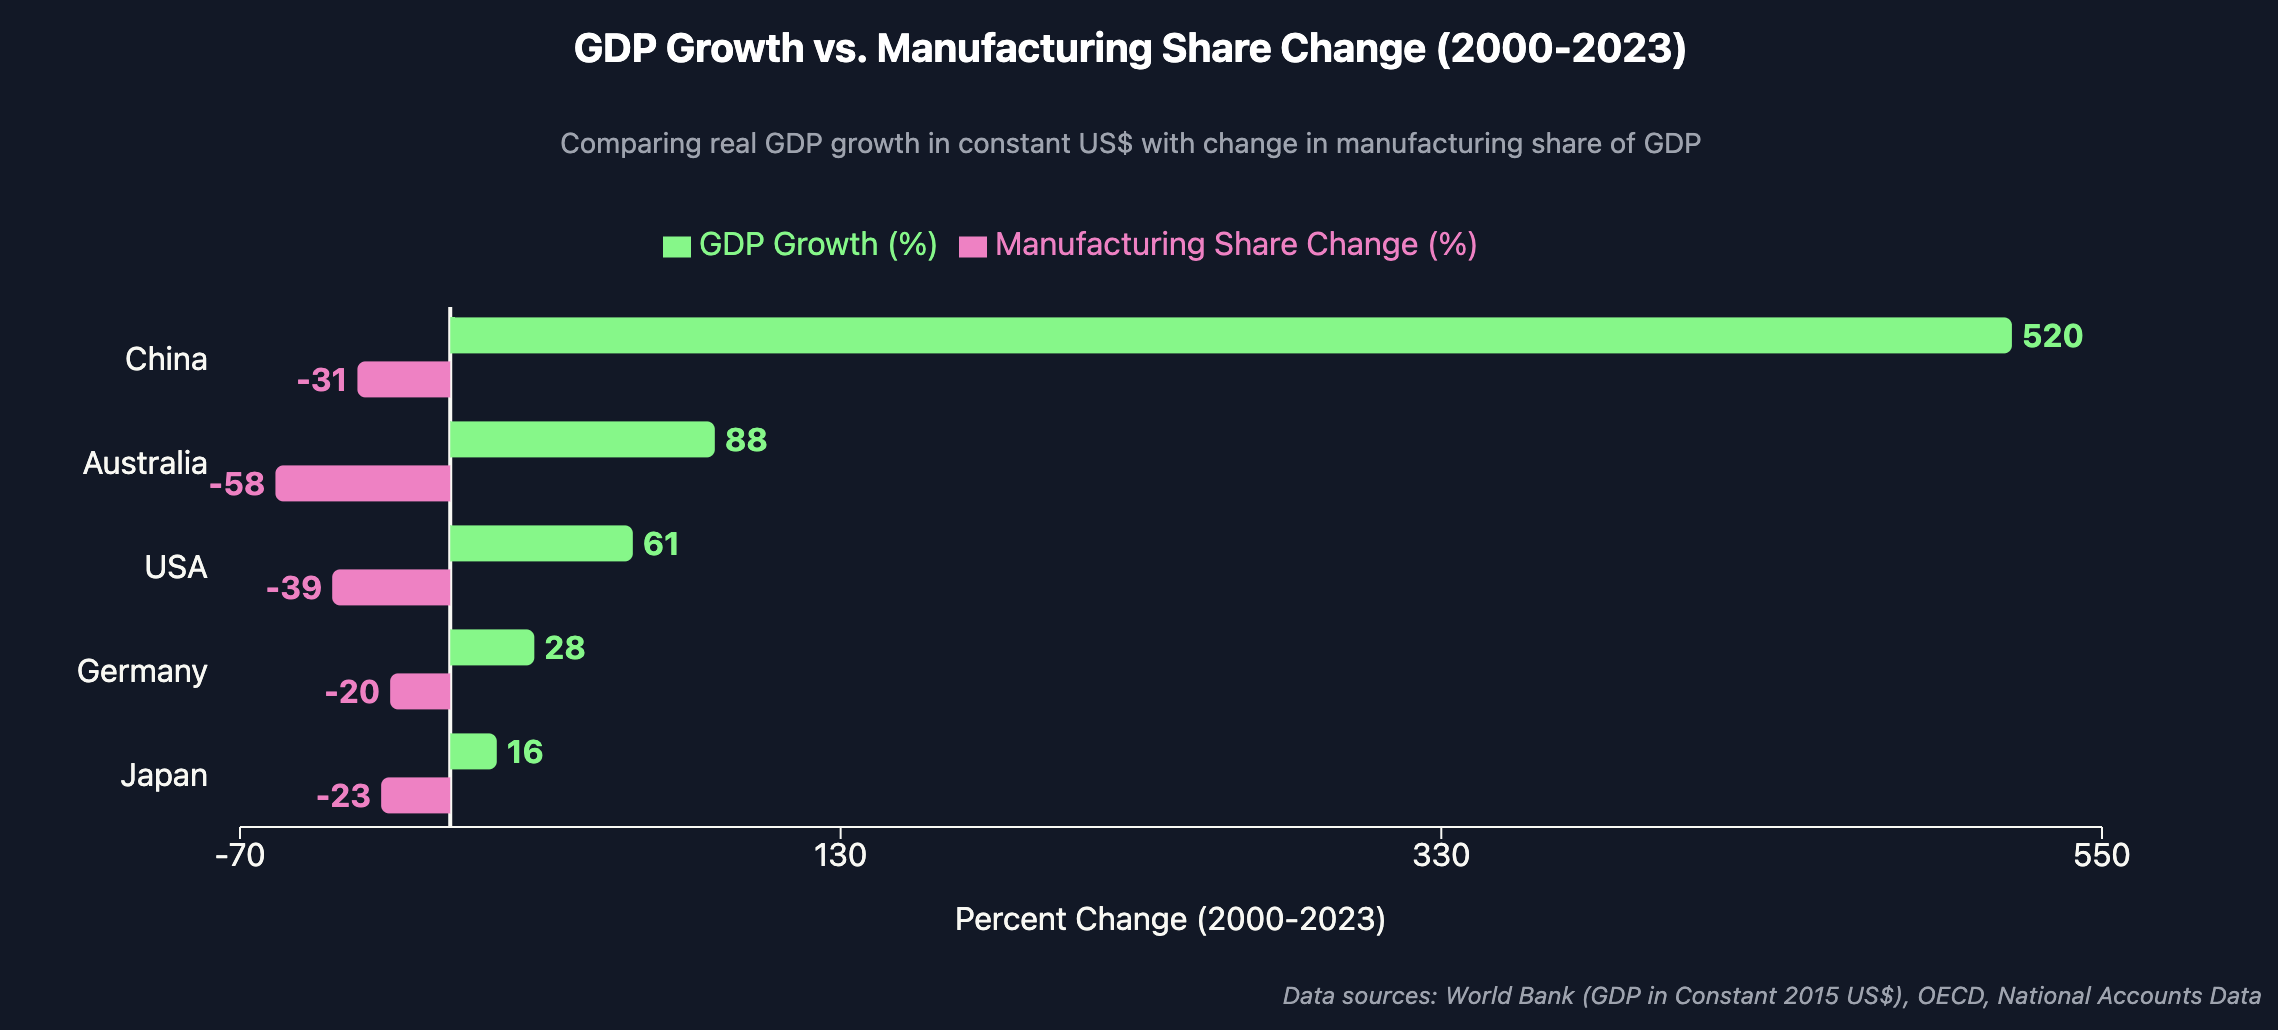
I am not even an Economist’s bootlace, probably why I wear slip-ons, financial analysis is more my thing. Also note the false zero in this chart from semianalysis but it does make me wonder how likely it is that the USA can base strong economic growth on a recovery in manufacturing even with all the multiplier impacts that manufacturing has.
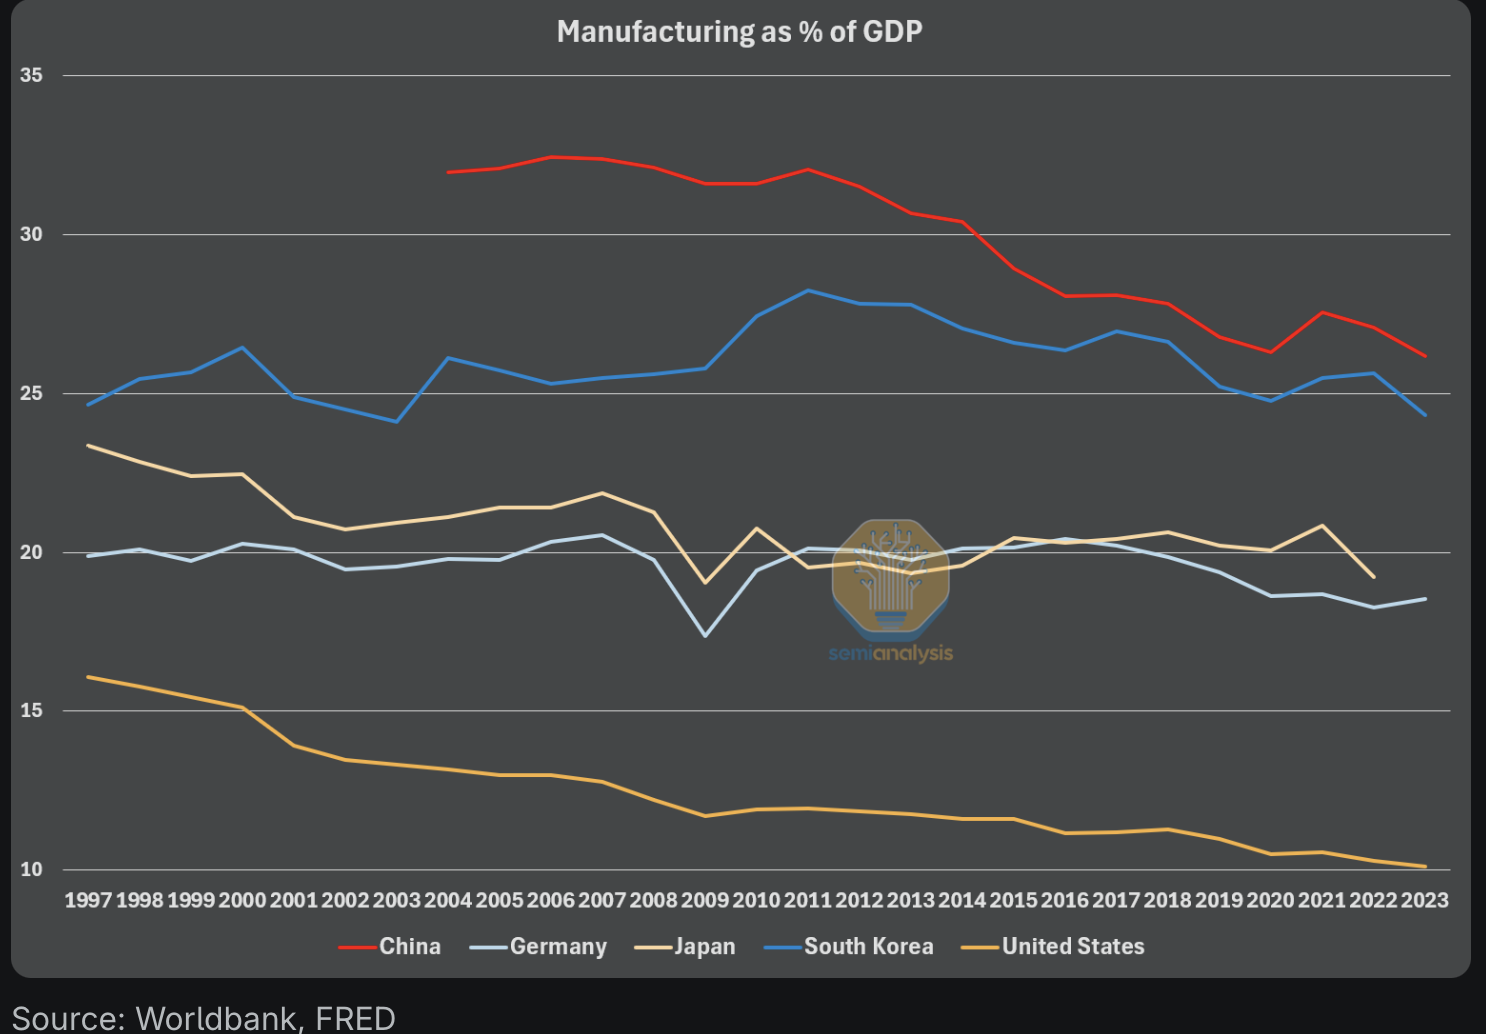
A great read as usual from Semianalysis
4 Mar
Finally I’ve added an iframe embedded menu link to EnergyInsiders podcast. This means that when you click on the link you go to the SoundCloud page and see a list of EnergyInsiders episodes but remain on the ITK site. Claude assisted with formatting the iframe reference. That’s what defeated my previous attempt last year.
28 Feb
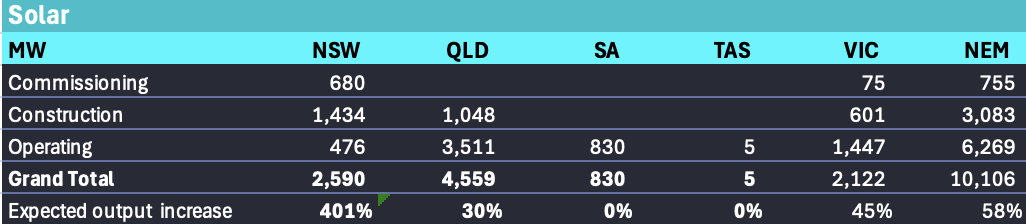
The following tables show the new wind, solar and batteries commissioning and under construction. The data is sourced from that great resource www.renewmap.com.au In percentage growth rows I have made some gross assumptions about how commissioned assets are. For instance Macintyre wind farm max output is about 180/950 MW. It wont output at max capacity so it could be regarded as fully commissioned at say 600 or 700 MW of output.
Overall the numbers show we can still expect about a 33% increase in wind output broadly split between commissioning and under construction, a 58% increase in utility solar output, assuming none of the new assets are curtailed, and that of course will be wrong. On my calculations depending on curtailment I expect the committed construction and commissioning assets to take renewable generation which also includes rooftop and hydro to take renewable generation to about 50% of demand. The batteries should result in less curtailment of utility solar as well as having an impact on prices.
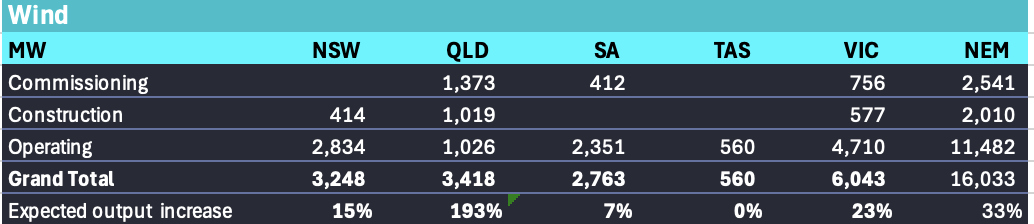
Batteries under construction seem to be growing 1 GW a month and as previously discussed huge increases are expected.
24 Feb
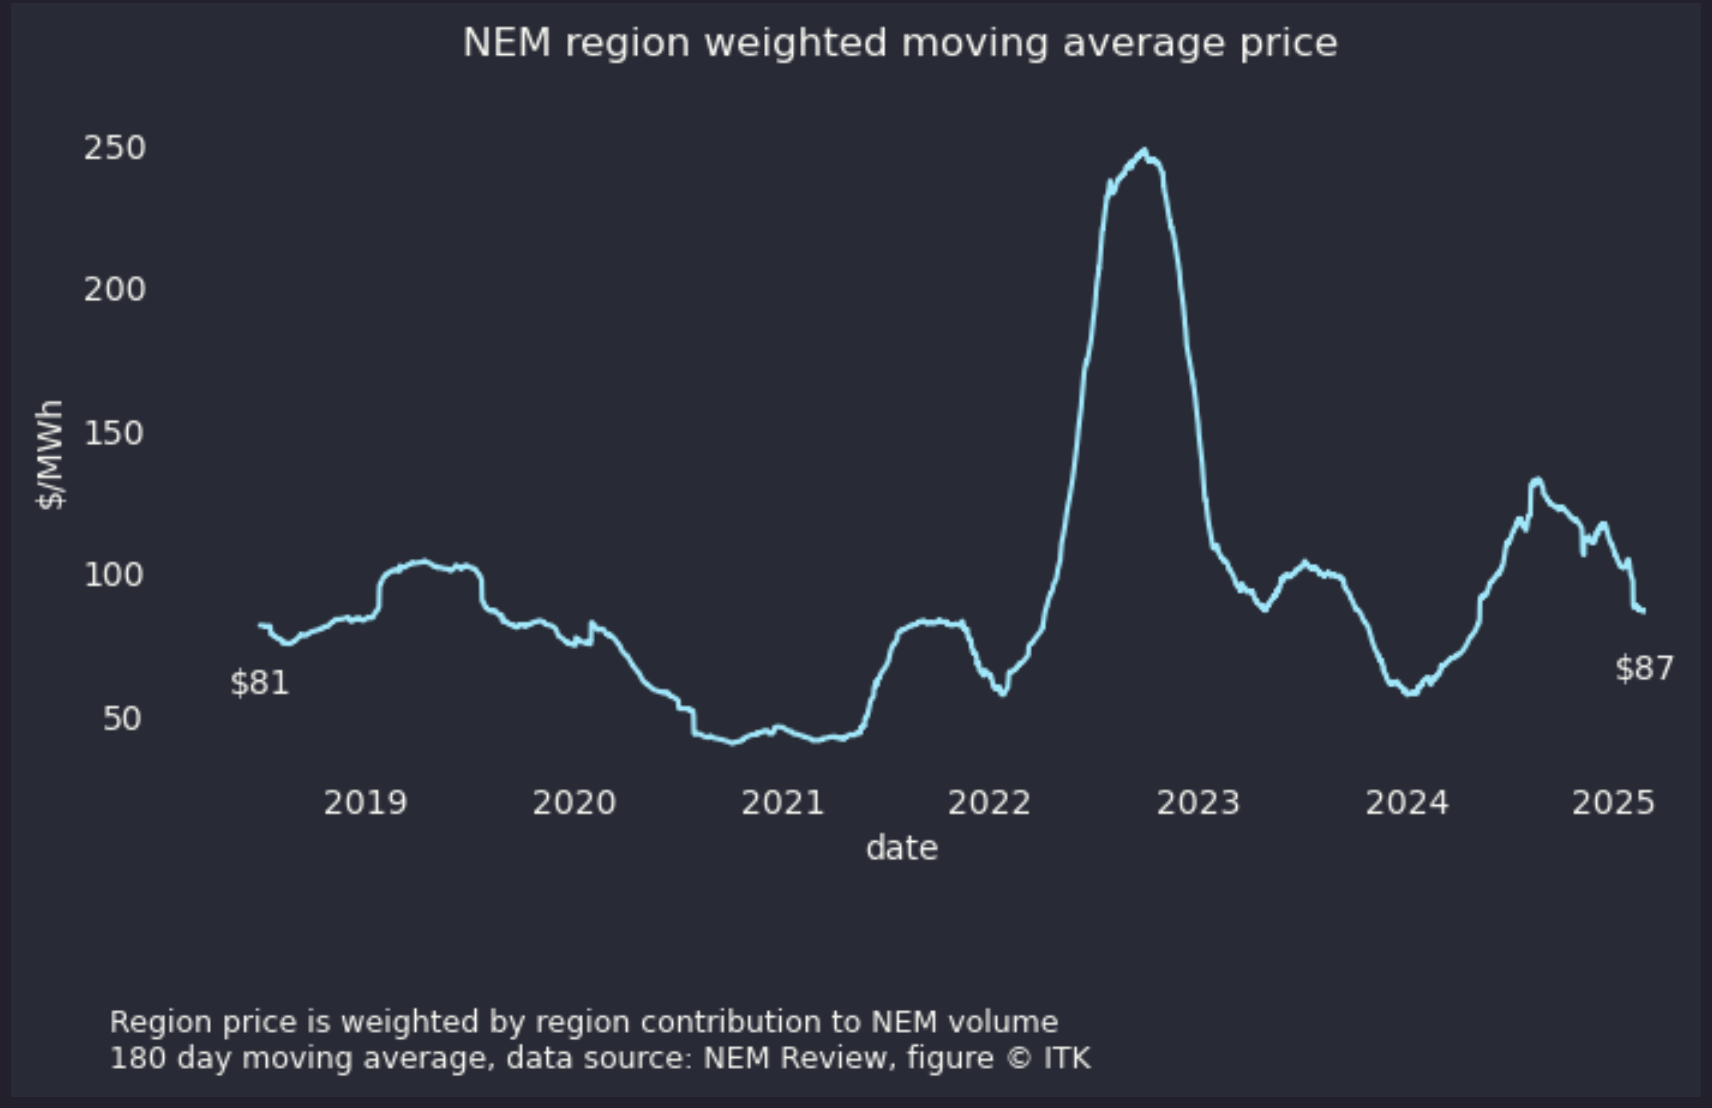
I was asked on Linked in by an anti renewables person to show the electricity price on a figure of mine that shows renewable generation compared to thermal generation. He probably expected the price to go shooting up as renewables penetration has increased. Normally I don’t show price on NEM total figures because prices are regional. Still the following figure shows a region volume weighted moving average price. Phew what mouthful. For each half hour get the region’s total production as a share of nem production and multiple the region spot price by that weight. Then get an 8760 half hours moving average.
Total volume includes rooftop volumes which dont of course have spot prices but still represents production. I was quite pleased to show that although volatile, prices are relatively flat (up $6 or about 8%) on six years ago. As Ben and everyone else knows the big price spike was due to coal and gas price increases. Even last year the wind drought caused prices to spike and that’s visible in the figure.
One of the less talked about benefits of renewables is that generally the cost is fixed. Not so with coal and gas where fuel prices vary.
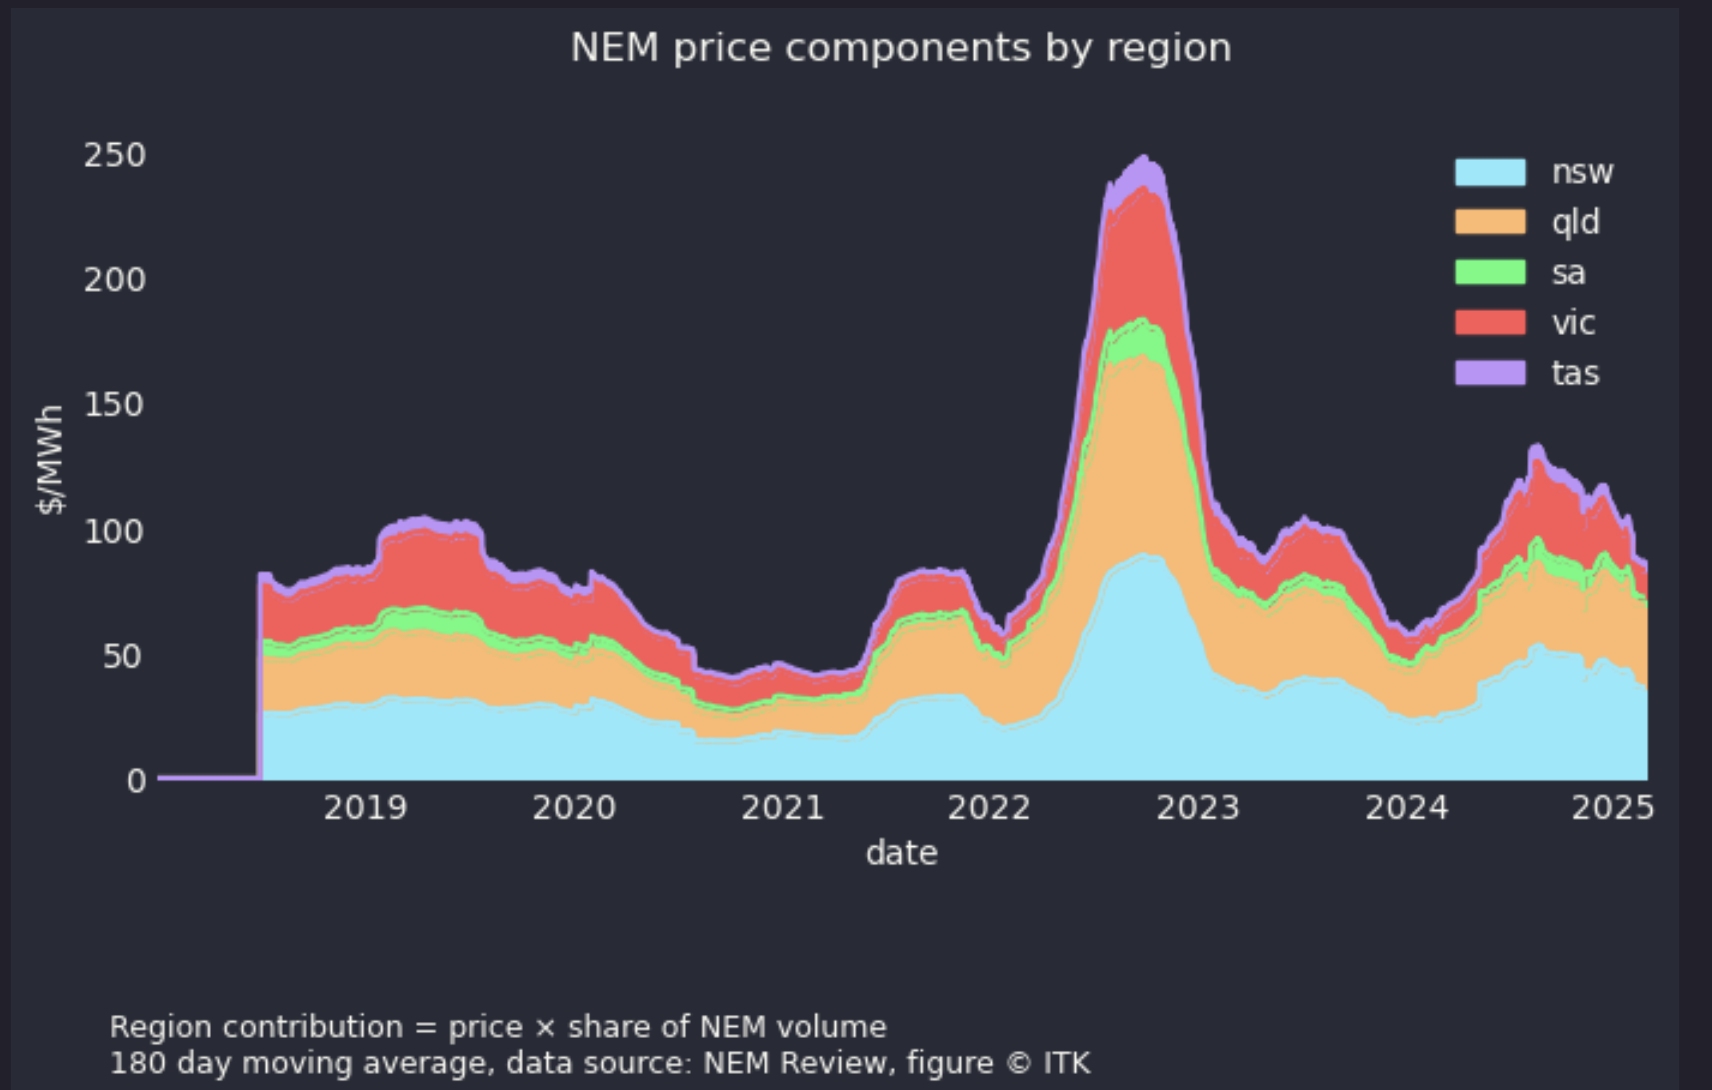
For completeness I also show a break down of the price by using the weighted regional prices in an area graph. More colourful but not much additional insight.
The main message is that really spot prices haven’t changed that much over time. And over time renewable penetration has increased to close to 50%.
18 Feb
VRE production has started 2025 well above 2024, largely due to rooftop solar but also
15 Feb
A quick note that all the writing on this site is done in markdown using Typora. Word is a great program but converting between Word and the internet is a constant struggle. Most content these days is consumed on a smart device and using “native” tools improves the experience. PDFs and Word documents were designed with the A4 page in mind. HTML text is designed the screen. Writing in Typora is easily translated via Pandoc to HTML. Rather than using Pandoc directly though it’s handled on my site with Quarto which is a static site building program designed by academics primarily for academic publishing. That is journal articles and books. However it turns out to be good at building static sites as well.
Typora costs US$14 and Quarto is free. Python is free as are all the packages that I use. VSCode, used to write the Python and the various other YAML (configuration files) is also free.
AEMO makes its ISP data available freely.
In short a determined analyst can go a long way with only minimal capital expenditure, but you have to put the time in.
10 Feb
Using end of January data from www.renewmap.com.au the battery wall keeps growing. 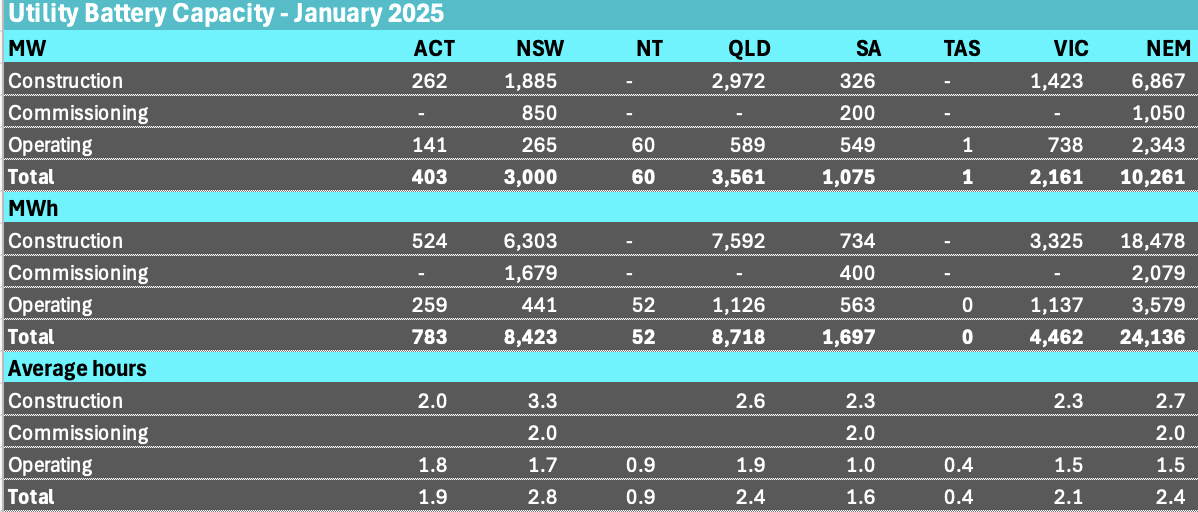
6 Feb
The world of electricity tariffs becomes a big deal when I start to think about the ongoing role of DER in Australia. Right now my focus is on what lies beneath Gentailer time of use policy. Extract from something I’m writing.
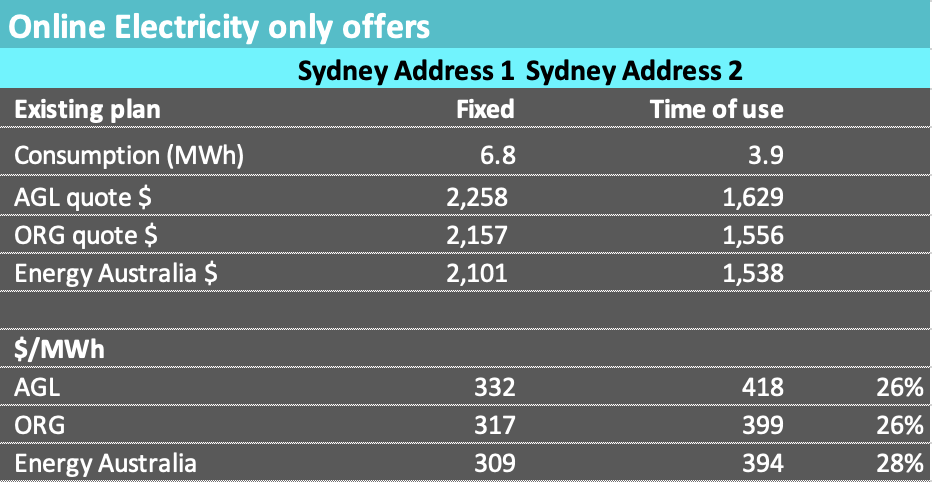
As far as I can tell when you get an online quote from one of the big gentailers the first thing that happens is that the retailer goes away and instantly retrieves meter information for the entered address. At a minimum that information includes total consumption and whether the address is on a fixed rate or time of use distribution plan. It may, for all I know, include other information.
The retailer will then provide a set of quotes that assumes the customer wants to stay on the same type of plan eg if you were on a fixed rate the retailer assumes you want to stay on fixed rate and so you will only see fixed rate quotes. If you were on a time of use plan you will only see time of use plans. Unless you are a well informed customer and provided to talk either to the call centre or the chatbot you will never even know that the other type of plan is available.
In early February 2025 a summary of the quotes I received for two premises in the same street in the Ausgrid distribution franchise are in the table below.
29 Jan
If you are following the LLM progress and debate, arguably the biggest thing in world productivity since the internet became popular then I thoroughly recommend bookmarking Simon Willison It will still help if you are used to discussing programming concepts. As well as being a true expert in his own right with Django authorship on his CV, Simon is completely switched into the LLM/Python/AI blogging network and picks the eyes out of what needs to be read.
Regarding climate change I also recommend reading Ben Strauss’s piece on Sea Level Rise
These combined factors yield about 2.3 m of long-term SLR per 1 ∘C global warming, consistent with a wide range of paleo records [8, 14, 15], long-term projections from physical models of the components [16–19] and the newest assessment of the IPCC [20].
The point here which I tend to forget is that we have 10 CM of sea level rise to date but the 1.5C of locked in warming means that about 3.5 metres of sea level rise is locked in over the next century or so. Of course there will dykes and other defences but there is also going to be misery. Glaciers once melted wont be recreated in a hurry.