IEA dashboard, early stage
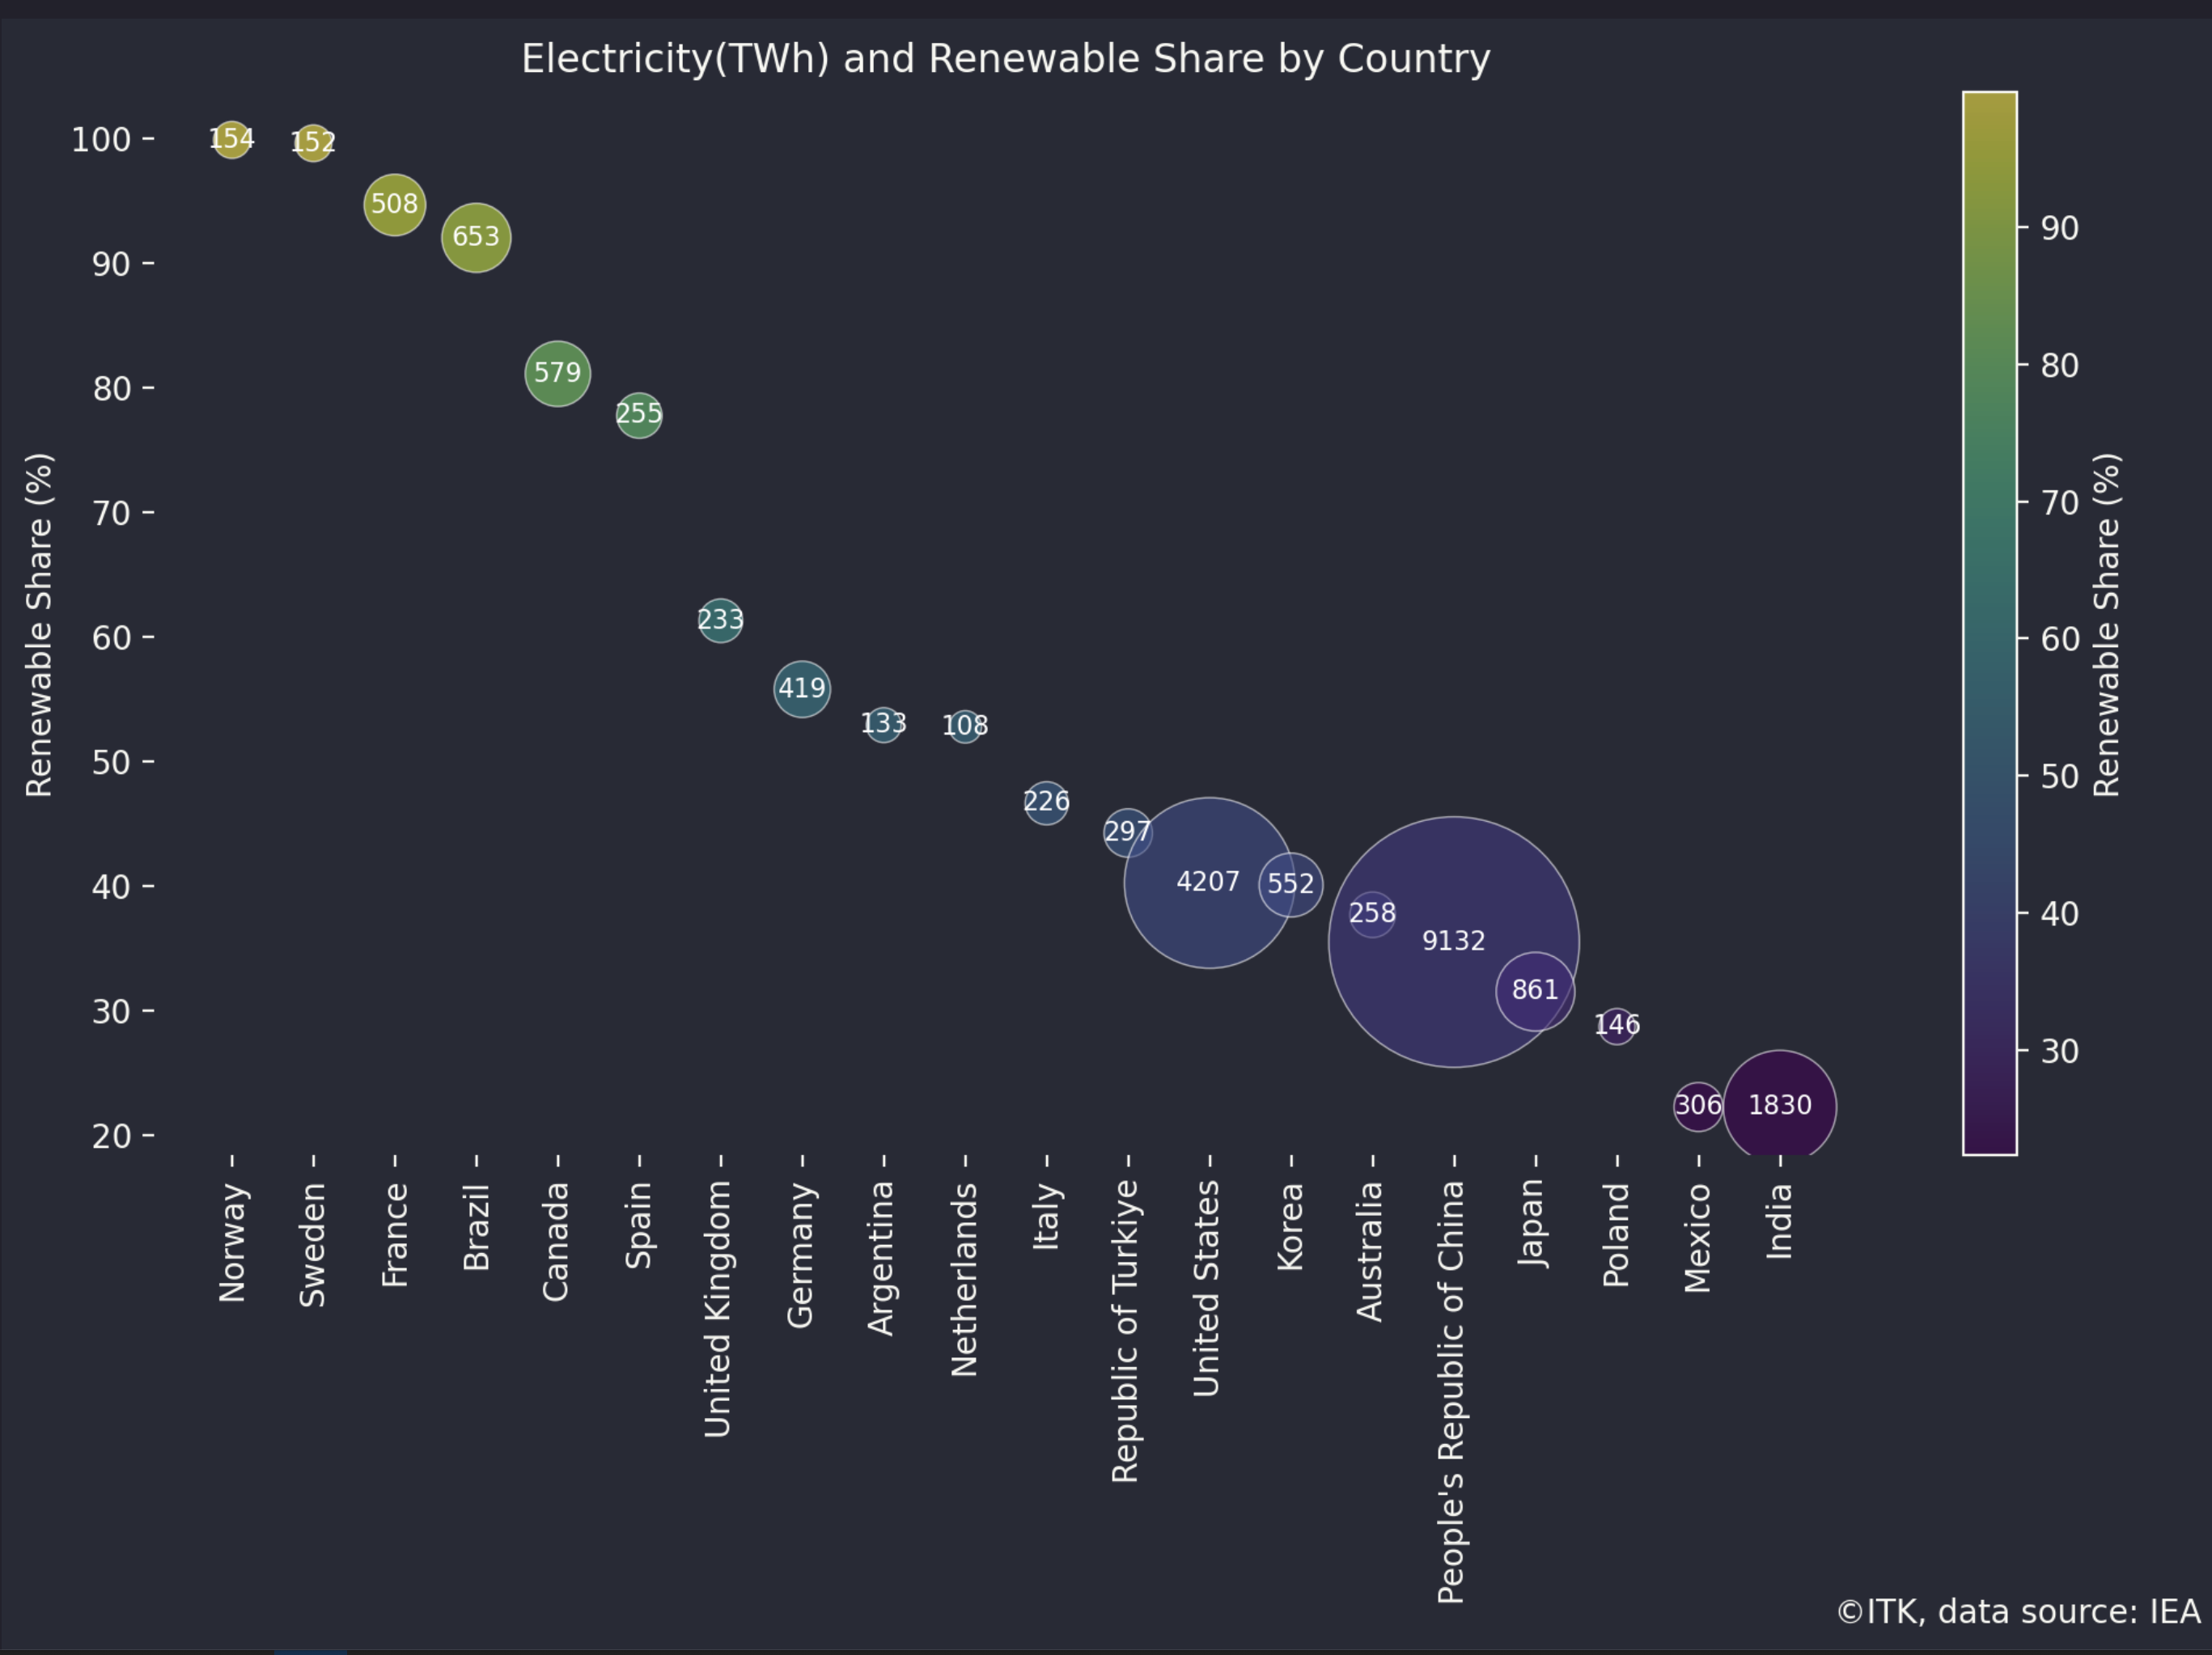
Your analyst has been stuck in the dark ages. In this note I try to take analysis online and let you my dear audience interact. The chosen data set is the IEA electricity data set. This shows by country and fuel, electricity production. It’s updated monthly but with about a 3 month lag so that the latest data is for May, 2024. Also like the vast majority of data sets other than Australia, it doesn’t do a good job of capturing behind the meter. In most places that doesn’t matter that much but it does matter in China and probably in California.
Laurie Mylliverta, arguably provides the most useful publicly available english discussion of China with his July report at Laurie at Carbon Brief
Still using the IEA’s dataset provides IMHO a reasonable view of global progress.
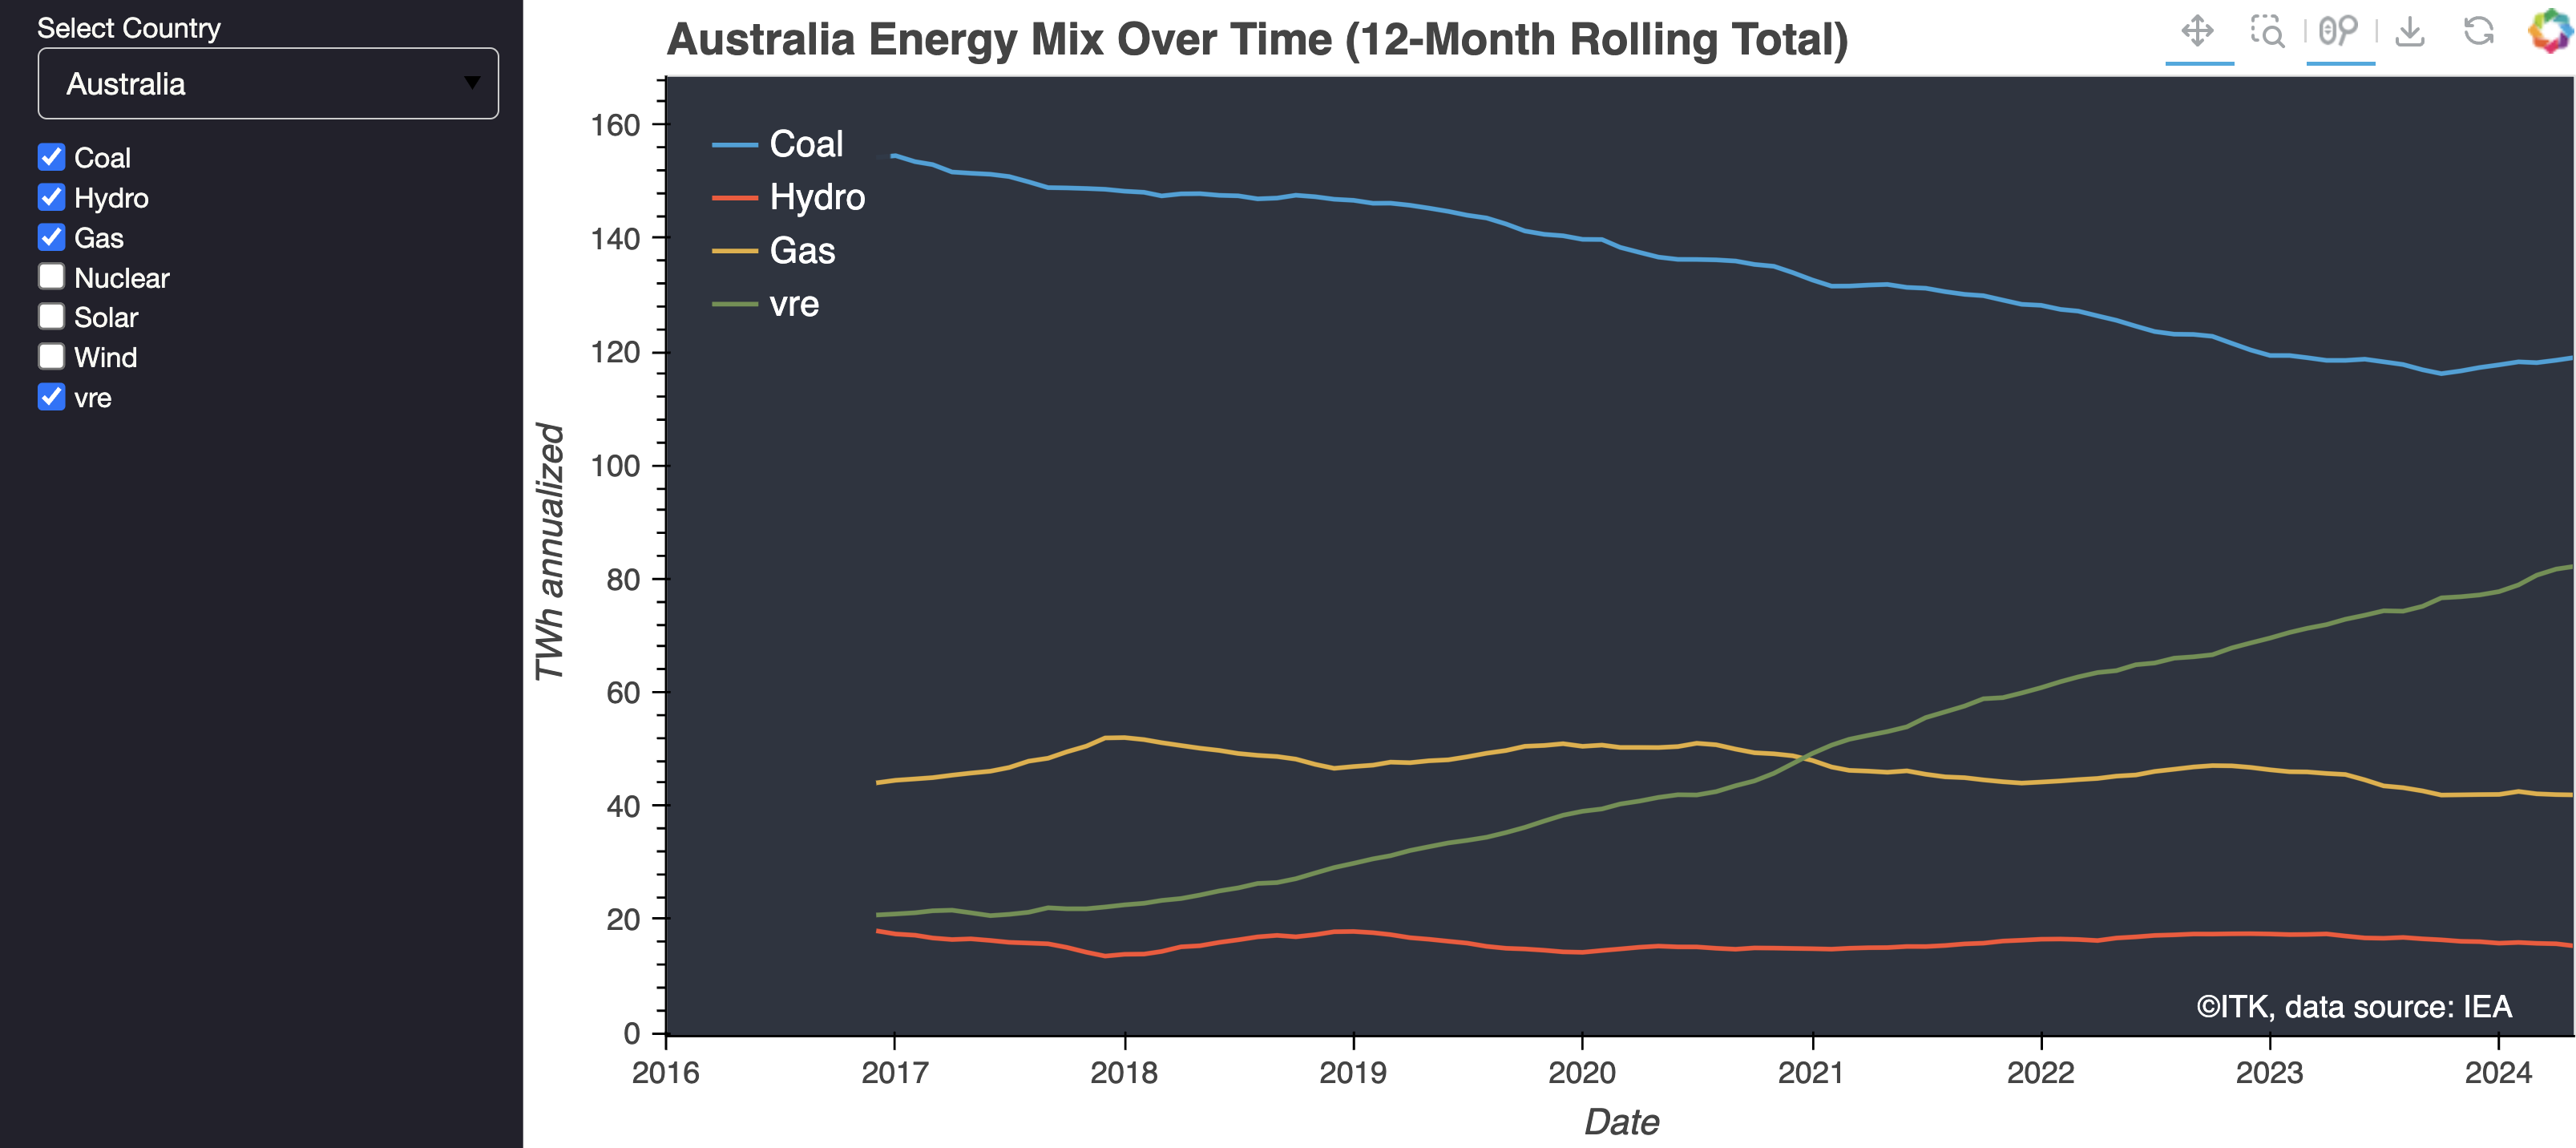
As much as I would like to show the trends here in this document the technology is still not quite there and so we have to head off to ITK website. There you can select the country and the fuel and see 12 month moving average trends of generation by fuel in a graph. A 12 month moving trend has been used to remove seasonal impacts. That comes at the cost of a six month lag as compared to using say a weighted trend. Here is a sample for Australia.
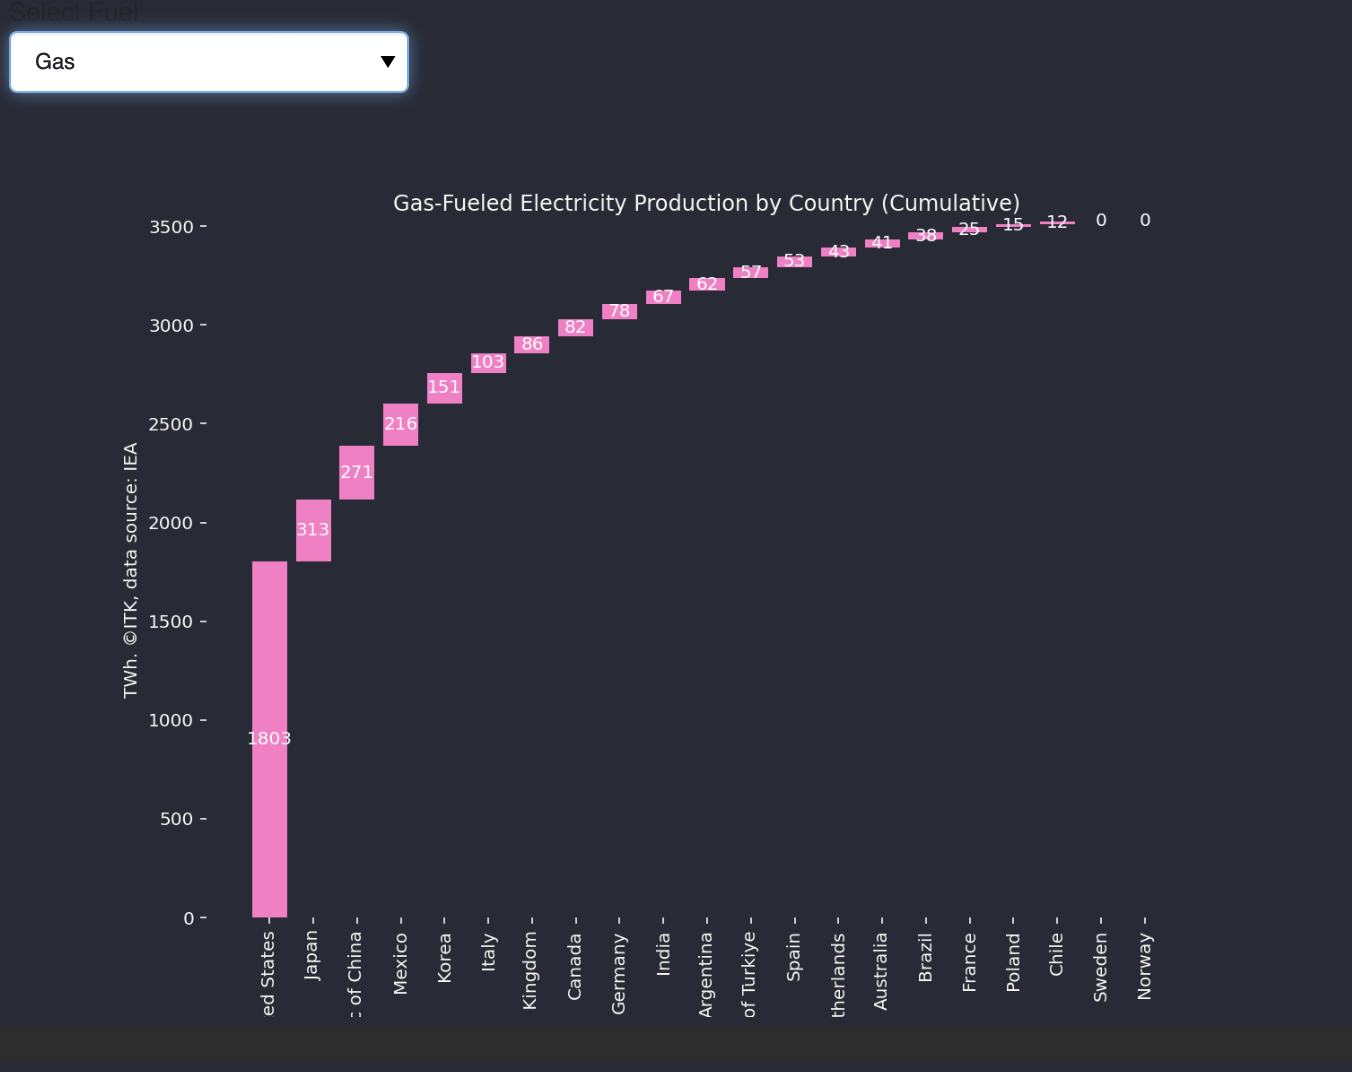
And also from the same data set we can see which countries are using, eg gas, for electricity generation. There’s a menu to choose your fuel and the data is for the 12 months ended May ’24.
It’s on the front page of the website for now and I’ll try to update it every month. Eventually it may go off to a page somewhere else on the site. Because its on the front-page a number of compromises had to be made and so it looks better on a bigger screen.