Renewable share procesession
After a year where questions of social license were heavily debated, recent events make it seem like the transition is much more of a done deal. Specifically the Capacity Investment Scheme (CIS) is like a bellows fuelling a forge. The CIS accomplishes a number of goals:
- The size of the scheme sends a signal to all players;
- Its speed:
- Offers will be sought for 10 GW of wind and solar supply in 2024
- Of that 10 GW, 6 GW of contracts will be awared in 2024, and probably a further 10 GW will be awarded in 2025.
- The fact that the Federal Govt is doing it, brings the NEM back together, although only in part. States will still have their own agendas. Formally this happens via “Renewable Energy Transformation Agreements” (RETAs) negotiated with the States.
- State environmental/social license managers and transmission managers now have both the certainty of their task and also the pressure to get it done.
Renewable energy’s share of NEM supply will exceed 50% certainly in 2026 and possibly by the end of 2025
Its hard enough to work out how much new renewable energy will be built over the next couple of years. That’s not the end of the forecasting task though, because, and ignoring spillage, we also have to think about demand growth. If demand grew fast enough coal generation could continue at its current level no matter how much renewable generation was built.
One of the several brave calls the AEMO forecasting team has made in the ISP is that there will be demand growth. That contrasts with the last 15 years.
Since 2015 total demand has grown at a compound rate of 0.8% per year to be 7% higher than in 2015.
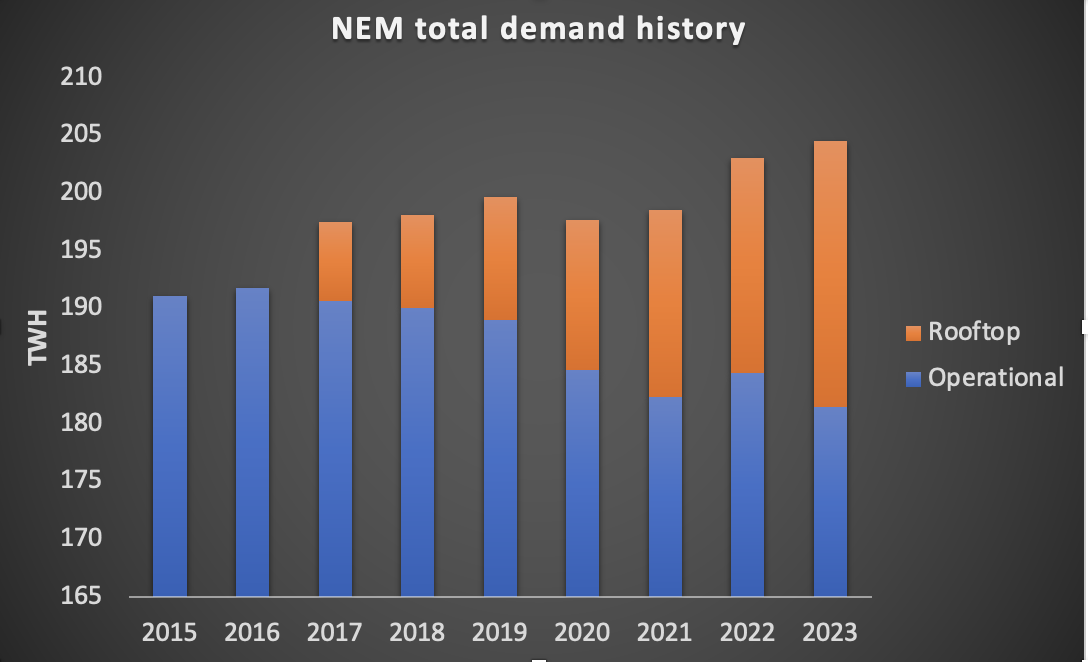
AEMO didn’t start reporting estimated rooftop output until 2015 but prior to then the numbers were small. Operational demand, that is what is supply by large generators has been flat since well before 2015
However going forward, electrification (including but not limited to EVs) and population growth are expected to grow demand at between 2% and 2.5% compound out to 2030. Readers will appreciate that it could just as easily be 1% or 3% if not wider bounds. Forecasting compound growth rates is a guess. However on the AEMO numbers total demand will be somewhere round 240-250 TWh in 2030.
ITK forecast as of March 2024
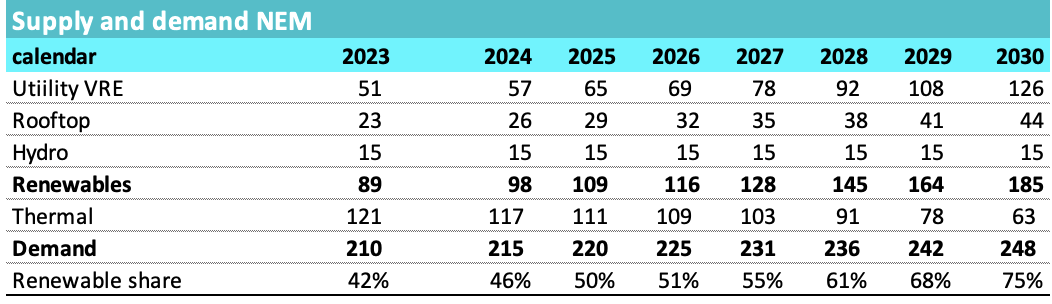
So when I doodle the numbers, and I am certain they will be revised often, I presently see about 75% renewable by 2030 and over 50% in 2026.

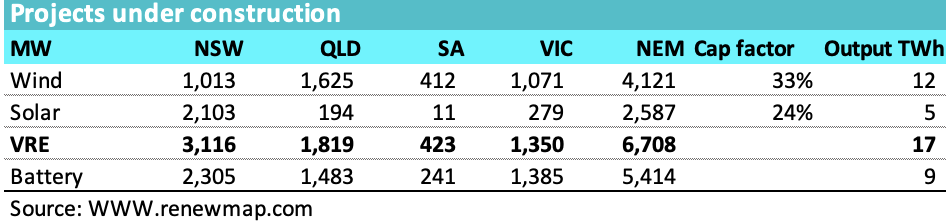
7 GW of Utility VRE are under construction
The wind and solar currently under construction makes it certain we will be over 50% renewable in the NEM by mid 2026 at the latest and I suspect by late 2025.
Despite all the doom and gloom there is a bit of building:
The big wind projects are advancing at a good pace and most look like being commissioned by mid 2026.
Rye Park is already producing 200 MW (installed capacity is 396)
Ryan corner, all turbine foundations poured, 87% components delivered as of January
Mcintyre wind farm (stage 1 1024 MW) is about 1 year behind what was initially announced as startup date but should be largely commisioned by March 2025.
Stage 1 of Golden Plains East wind farm (the first 750 MW ) is off to a great start with foundations poured and several of the 121 turbines already up. Stage 2 will start this year. The project in total will supply about 9% of Victorian demand. Worth checking out the vimeo.
Stage 1 of Clarke Creek is behind schedule with turbines going up now. It should still be at commissioning stage by late 2025
Goyder South has energised the transmission connection and turbines started installation in October 2023. Neoen has traditionally been reasonably on time with project deliver.
It can still be that hold point testing can slow things down, but my guess is that AEMO will be doing its level best to avoid that.
The vast majority of the utility solar is in NSW. New England stage 2 is brownfield and unlikely to be delayed. Wellington North at 425 MW is expected to begin commercial operation in H2 of 2024. Probably around 4000 panels have by now been installed at the 400 MW Stubbo farm.
In short I’d expect well over 1000 MW of additional utility solar to be operational in NSW by the end of this year, perhaps subject to commissioning hold points. With the balance well on track to be complete in 2025.
NSW
3.1 GW of projects are under construction in NSW and leaving out Uungula around 0.5 MW of wind and close to 2 GW of solar should be operating by the end of 2025, ie by the time that Eraring closes. That’s around 6.4 TWh of eneragy plus a further say 2 TWh for new NSW rooftop capacity. All up around 50% of Eraring output. The rest will have to be made from imports, plus say Tallawarra B gas and higher operating rates from Bayswater and maybe even Mt Piper. Things still look tight around the time of announced Eraring closure.
New projects and the CIS
Beyond what’s under construction new projects need to be committed this year if coal plants are going to be able to retire. As things stand 2026 will start to see a slowdown although there is still a bit to commission that year.
A good start has been made with RIO’s PPA with the 1400 MW Bungaban wind farm. the Wambo wind farm (stage 2, 250 MW) should also get built and the afore mentioned Golden Plains West should add another 600 MW.
Bungaban, Goldens Plains stage 2 and Wambo state 2 might still be able to qualify for CIS funding
CIS impact
In the last week of February 2024, the Federal Deparment of Climate Change, Energy, the Envionment and Water (“DCCEEW”) released its “Implementation Design Paper” for the CIS. I’ve discussed the CIS in previous articles and also on the EnergyInsiders podcast. However there is lots of new information in the Implementation Design Paper. In this note I will focus on the “renewable capacity” and ignore “clean dispatchible capacity”. Note that this paper is only indicative and market responses are invited. Still there are typically only modest changes and time is short.
- the CIS wants to have 23 GW of renewable capacity to be delivered by 2030.
- Tenders will be awarded 6-8 months after the closing date for bids
- The present schedule calls for tenders totalling 6 GW in the June quarter of 2024 and 4 GW in the December quarter. I have allowed 3.5 years between tender award announcement and energisation.
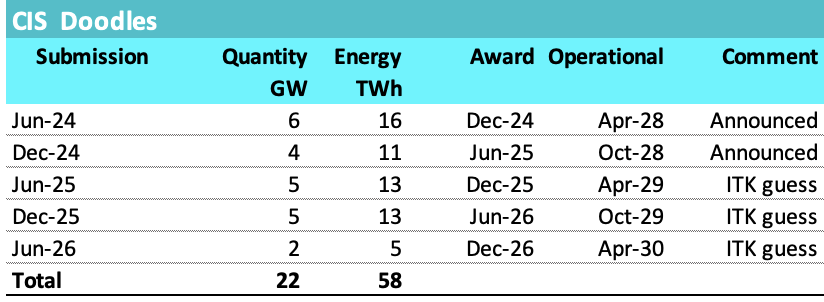
Its important to note that WA will likely get its share of tender awards. But also I suppose that some projects will be built without CIS funding, eg Wambo wind farm mentioned above and Golden Plains Stage 2.
Also on the assumption that solar can be built faster than wind and to spread things out a bit more my table and chart allow for 9 TWh to be produced in 2027 effectively from CIS tenders.
On this schedule and allowing for rooftop development to continue the follwing supply and demand table results and is reflected in the chart above.
Other points about Generation CISAs
CISAs are based on revenue from all sources including capacity revenues and green certificates. However negative revenues, eg below zero prices are excluded. Put another way participants retain the risk of negative prices. Alternative to gross revenue the Govt also contemplates an option process similar to NSW LTESA and also only to net volumes ie those not covered by another PPA contract.
Projects have to have progressed beyond “early development” but not be committed as of November ’23.
Tenders may have to specify targetted commissioning dates and not be subjed to “new” technology risk. Bye bye SMR.
The merit criteria place high weight on reliability as well as price. For that reason a hybrid project may be viewed favourably compared to say a solar only project, even though the battery component of the hybrid project is not eligible for a dispatchible generation CISA on its own.
Social license and transmission
Its clear that social license for this transition is an ongoing process. Clearly not everyone accepts that climate change is a thing no matter how obvious it is. Neither will there ever be universal acceptance that wind and solar bulk energy backed up on demand firming and hydro is ever going to be the right approach for any country let alone one that has until recently depended on coal.
But these national objections are not where the discussion needs to take place. Mostly its the opinions of residents and other stakeholders in the impacted areas that need to be onboard, accepting even if neither approving let alone trusting. Money will help but will not be enough.
I hear that Energyco still looks like a Kafaeseque Govt Department to people. Lots of egos, not enough focus on just getting the job done etc. Renewable developers consistently suggest that NSW is a difficult State and QLD is preferred.
NSW is also a very expensive State for transmission.
For the benefit of lucky Reneweconomy readers here are a couple tables that guide my thinking. Look at the $/MW/km cost in NSW compared to QLD. Partly this reflects, in my opinion the Federal NSW Nationals who are determined to make electricity in NSW as expensive as they possibly can and stir up fear, uncertainty and doubt.