How generation cost is built
Solar A$76/MWh, wind A$124/MWh at the plant gate, A$93 blended.
All slides · Open in the deck · Change log
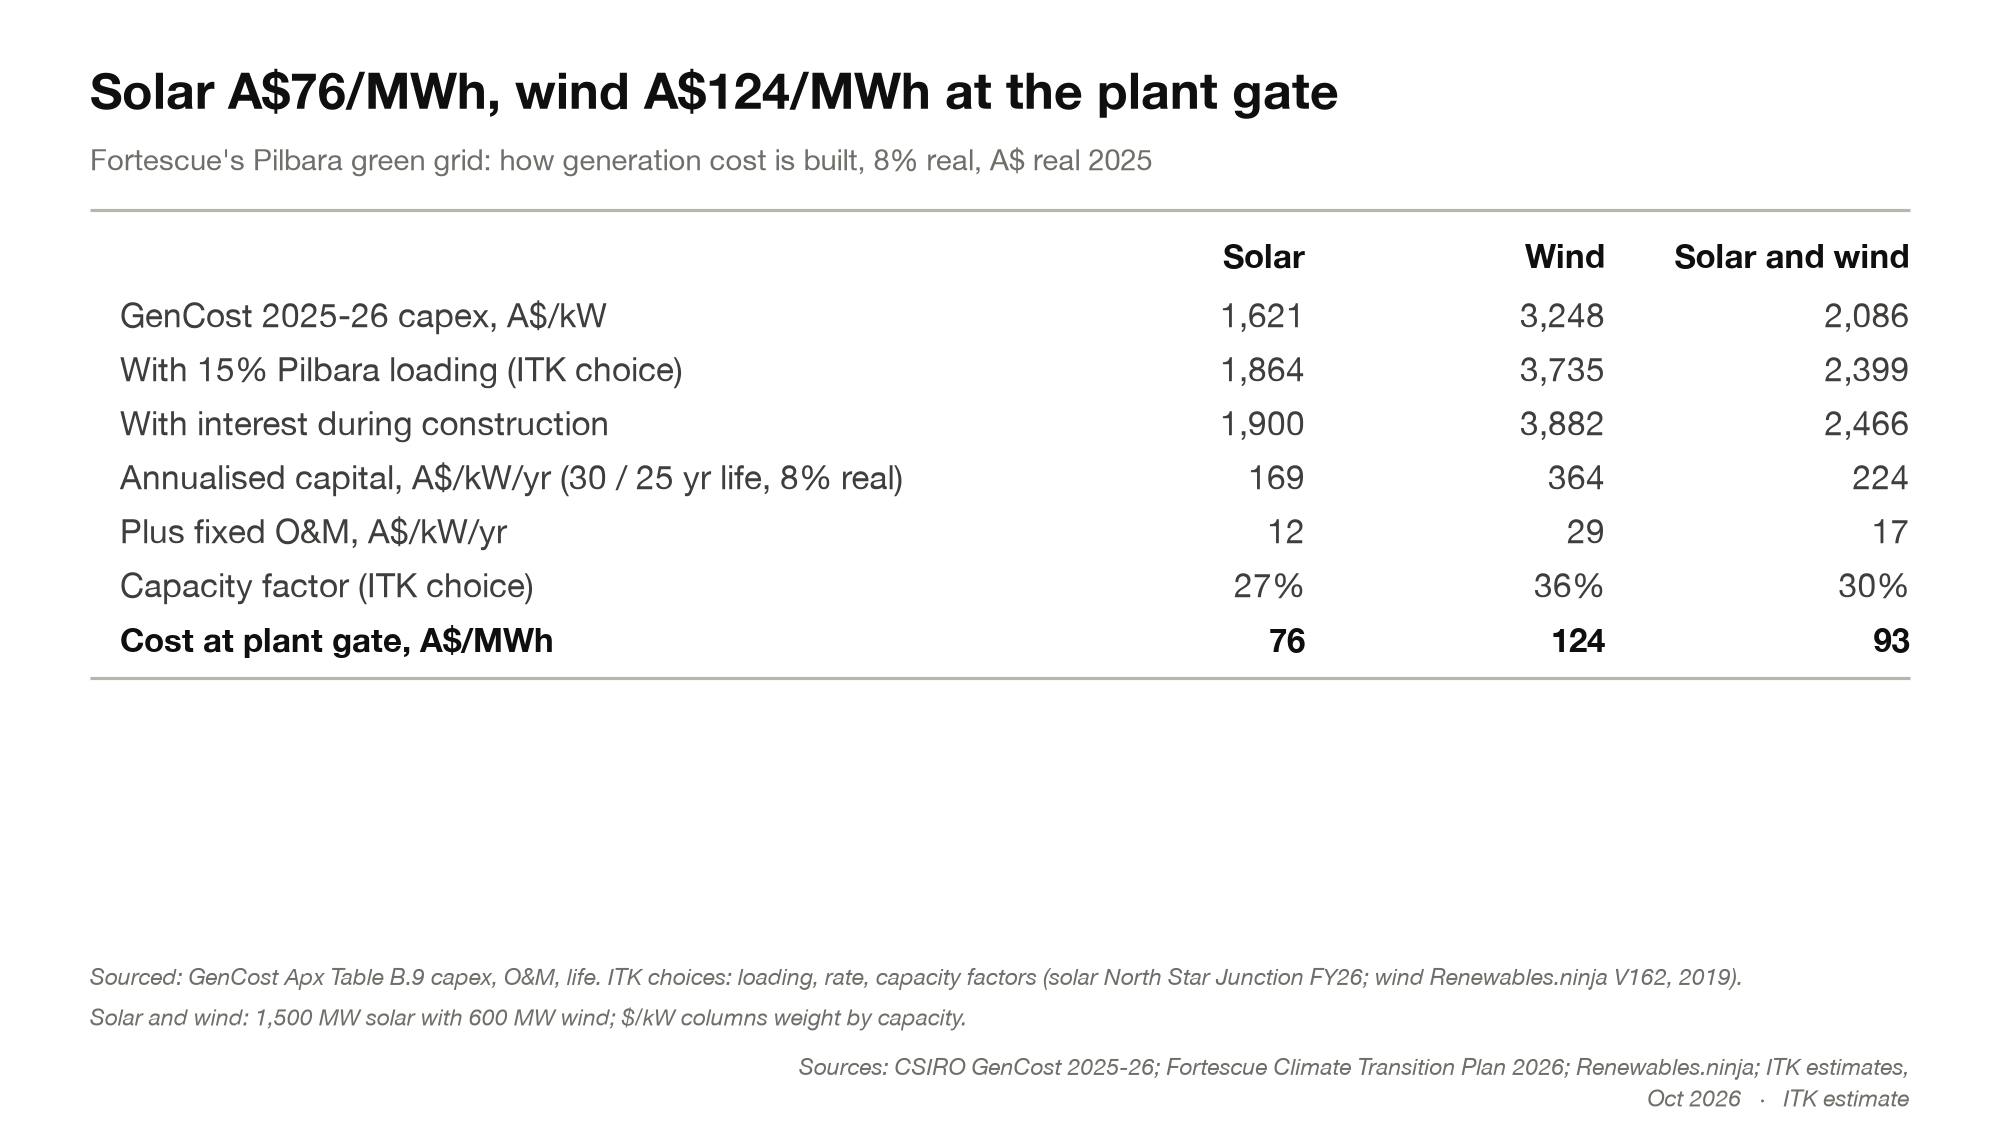
- Capital, fixed O&M and economic lives are CSIRO GenCost 2025-26 (Appendix Table B.9, 2025 costs).
- ITK adds 15% for Pilbara construction, and interest during construction as GenCost does.
- Capital is annualised at an 8% real pre-tax WACC over 30 years (solar) and 25 years (wind).
- Capacity factors: solar 27%, North Star Junction’s FY26 output (236 GWh from 100 MW); wind 36%, a Vestas V162 at 120 m hub height near Port Hedland in 2019 weather (Renewables.ninja).
This is cost per MWh generated. Storage, transmission and spilled output come in the delivered cost.
Sources: CSIRO GenCost 2025-26; Fortescue Climate Transition Plan 2026; Renewables.ninja; ITK estimates.