How the grid runs hour by hour
Solar and wind supply 93% of a flat 525 MW load; gas fills the gaps.
All slides · Open in the deck · Change log
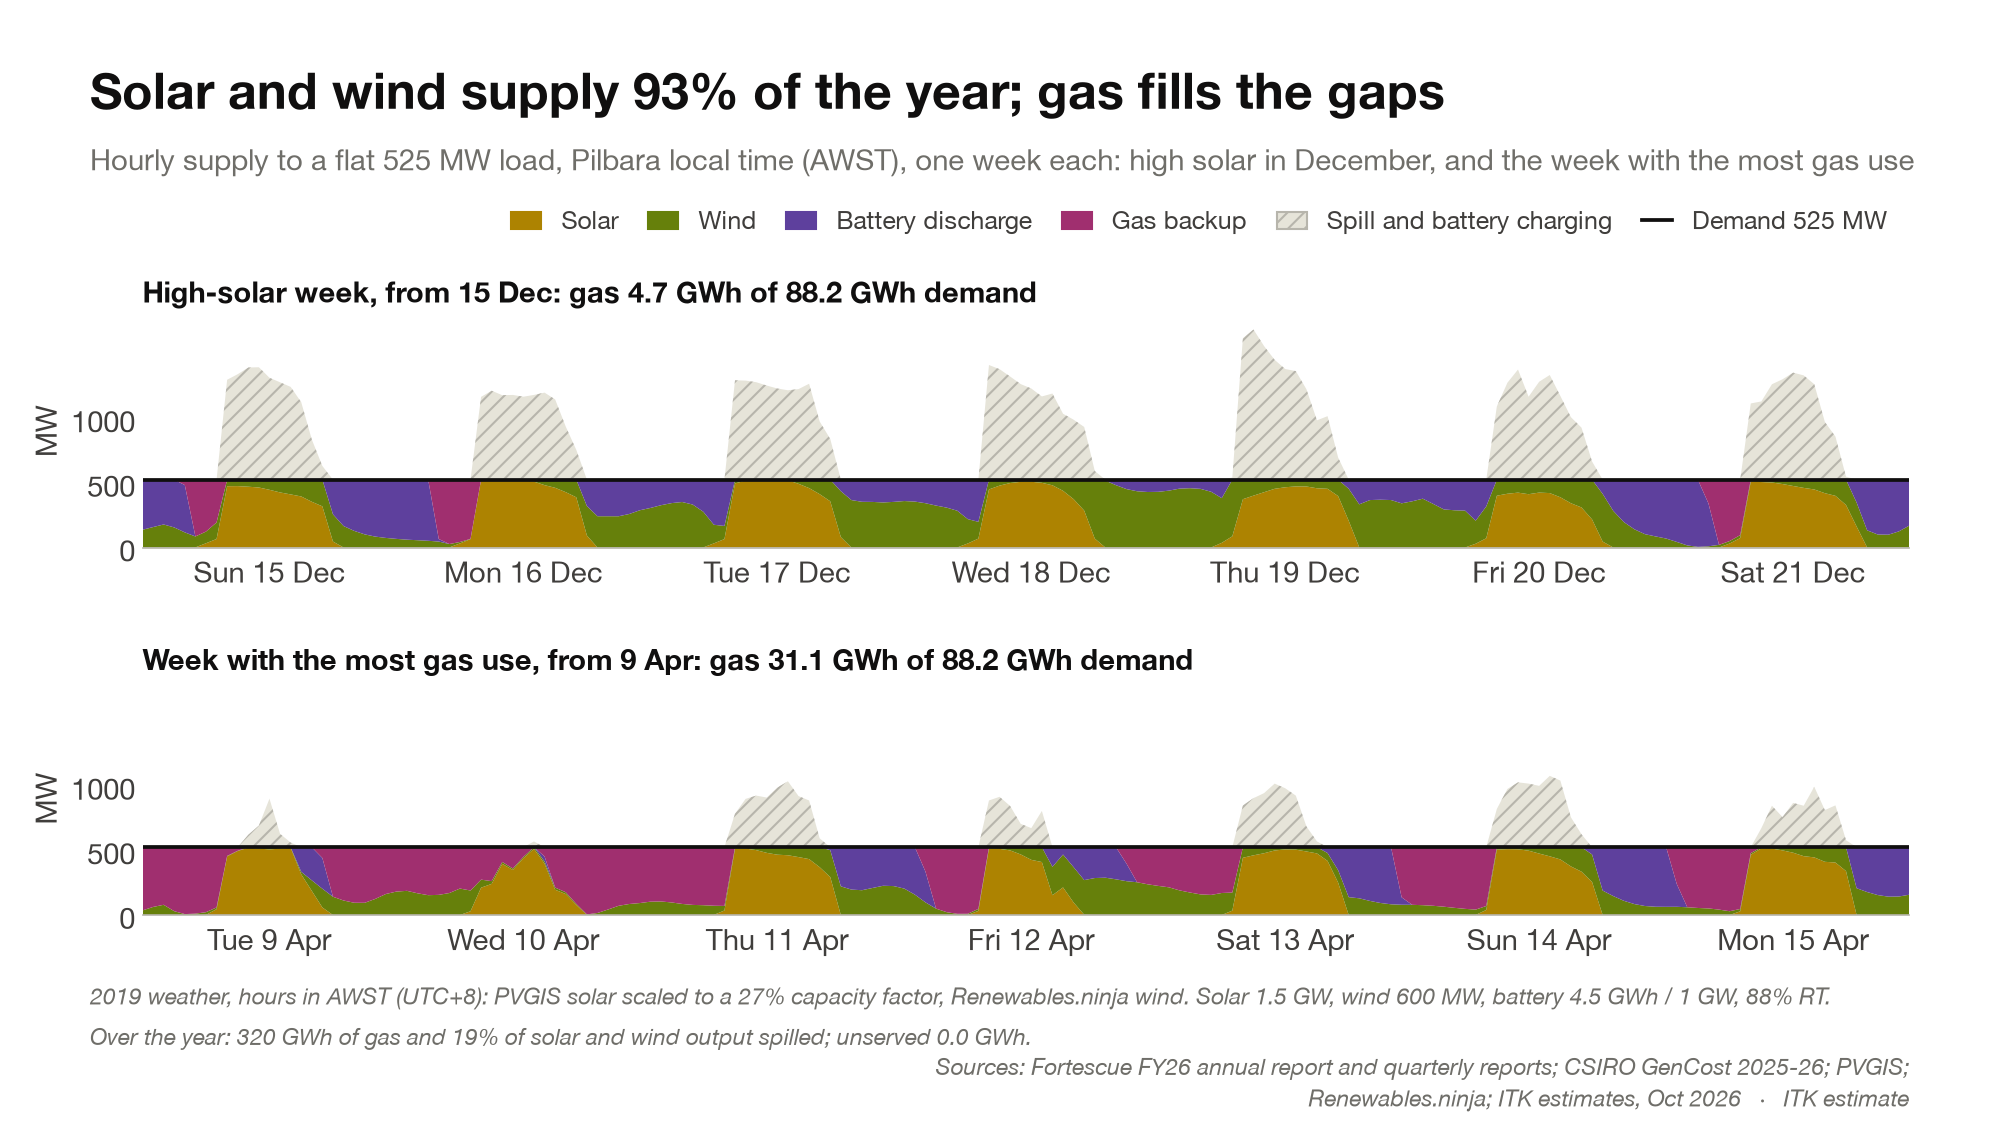
An hourly simulation over 2019 weather: 1.5 GW of solar, 600 MW of wind and a 4.5 GWh, 1 GW battery (88% round trip) serve a flat 525 MW load. Surplus output charges the battery, then is spilled; shortfalls draw on the battery, then on existing gas plant and bought-in supply.
Over the year solar and wind supply 93% of demand, gas 320 GWh, and 19% of solar and wind output is spilled. The two weeks shown are a high-solar week in December and the week with the most gas use, in April. Times are Pilbara local time (AWST).
Sources: PVGIS (solar, scaled to a 27% capacity factor); Renewables.ninja (wind); Fortescue FY26 reports; ITK model.