Batteries start to drive up midday prices
When you have dashboards it behoves you to use them, but as I am lazy I often don’t. Still, being somewhat self-aware of my lazy tendencies, and wanting to pretend I was still at an investment bank, I set up a couple of daily emails (you can sign up for them at the website) which send me an automated summary of what’s going on at lunchtime and in the evening, for example:
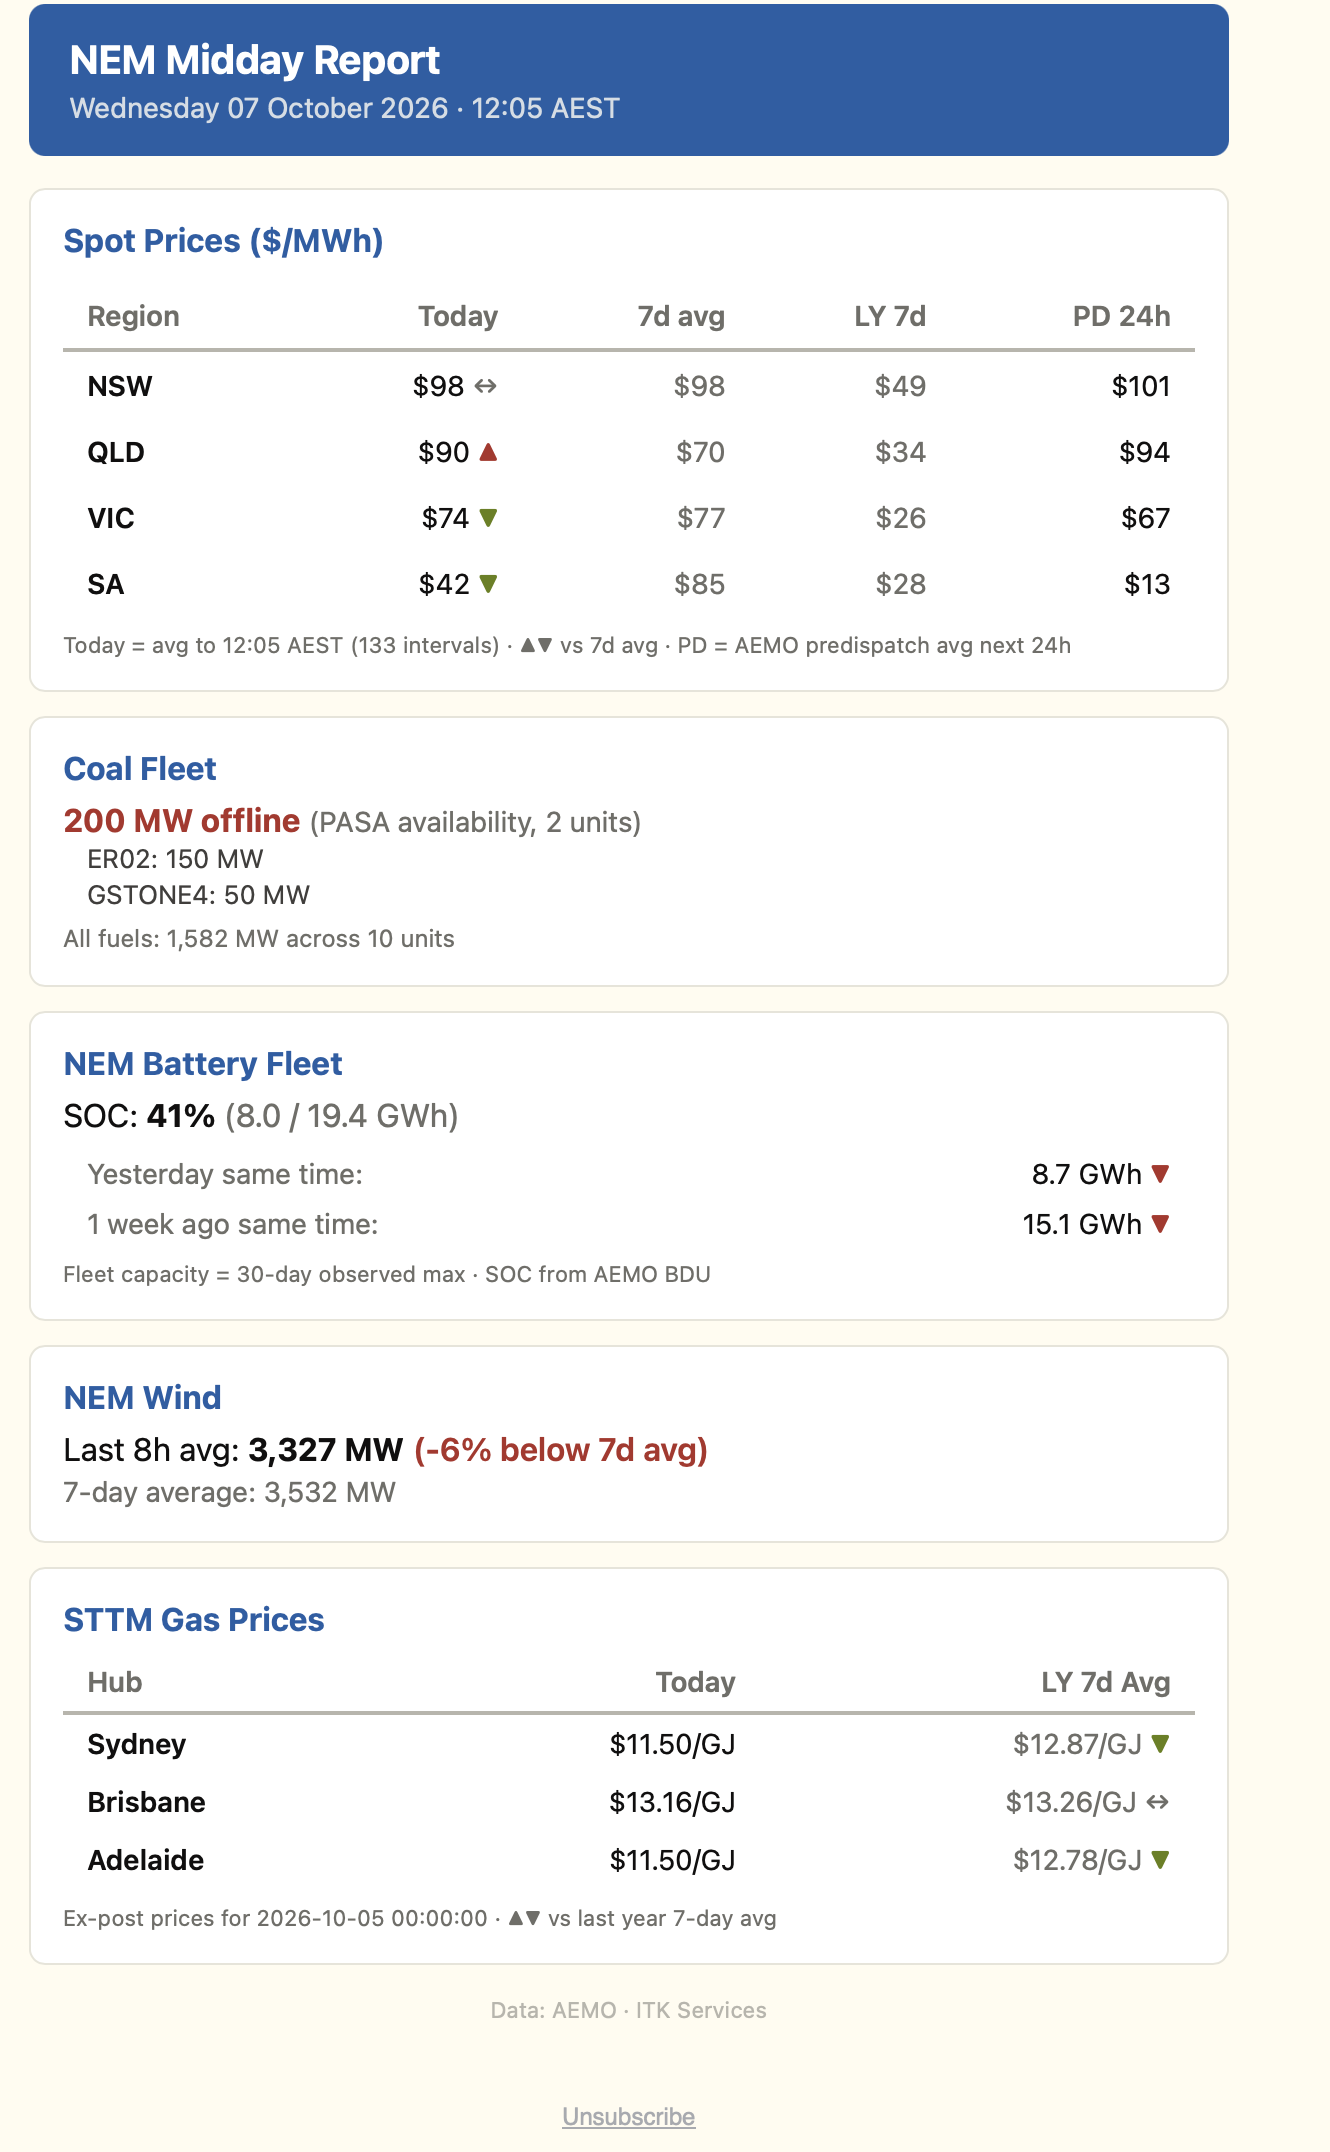
For ages the spot prices were below last year. Then about a month ago I started seeing spot prices being above last year and much higher than I would expect in spring. It took about 30 days for the message to finally sink in that maybe “things have changed” (such a good Bob Dylan song).
Over the past 30 days the NEM price averaged $68/MWh against $59 a year earlier. Midday prices rose from around zero to $25–30, and that outweighed a fall in the evening peak from about $130 to $95.
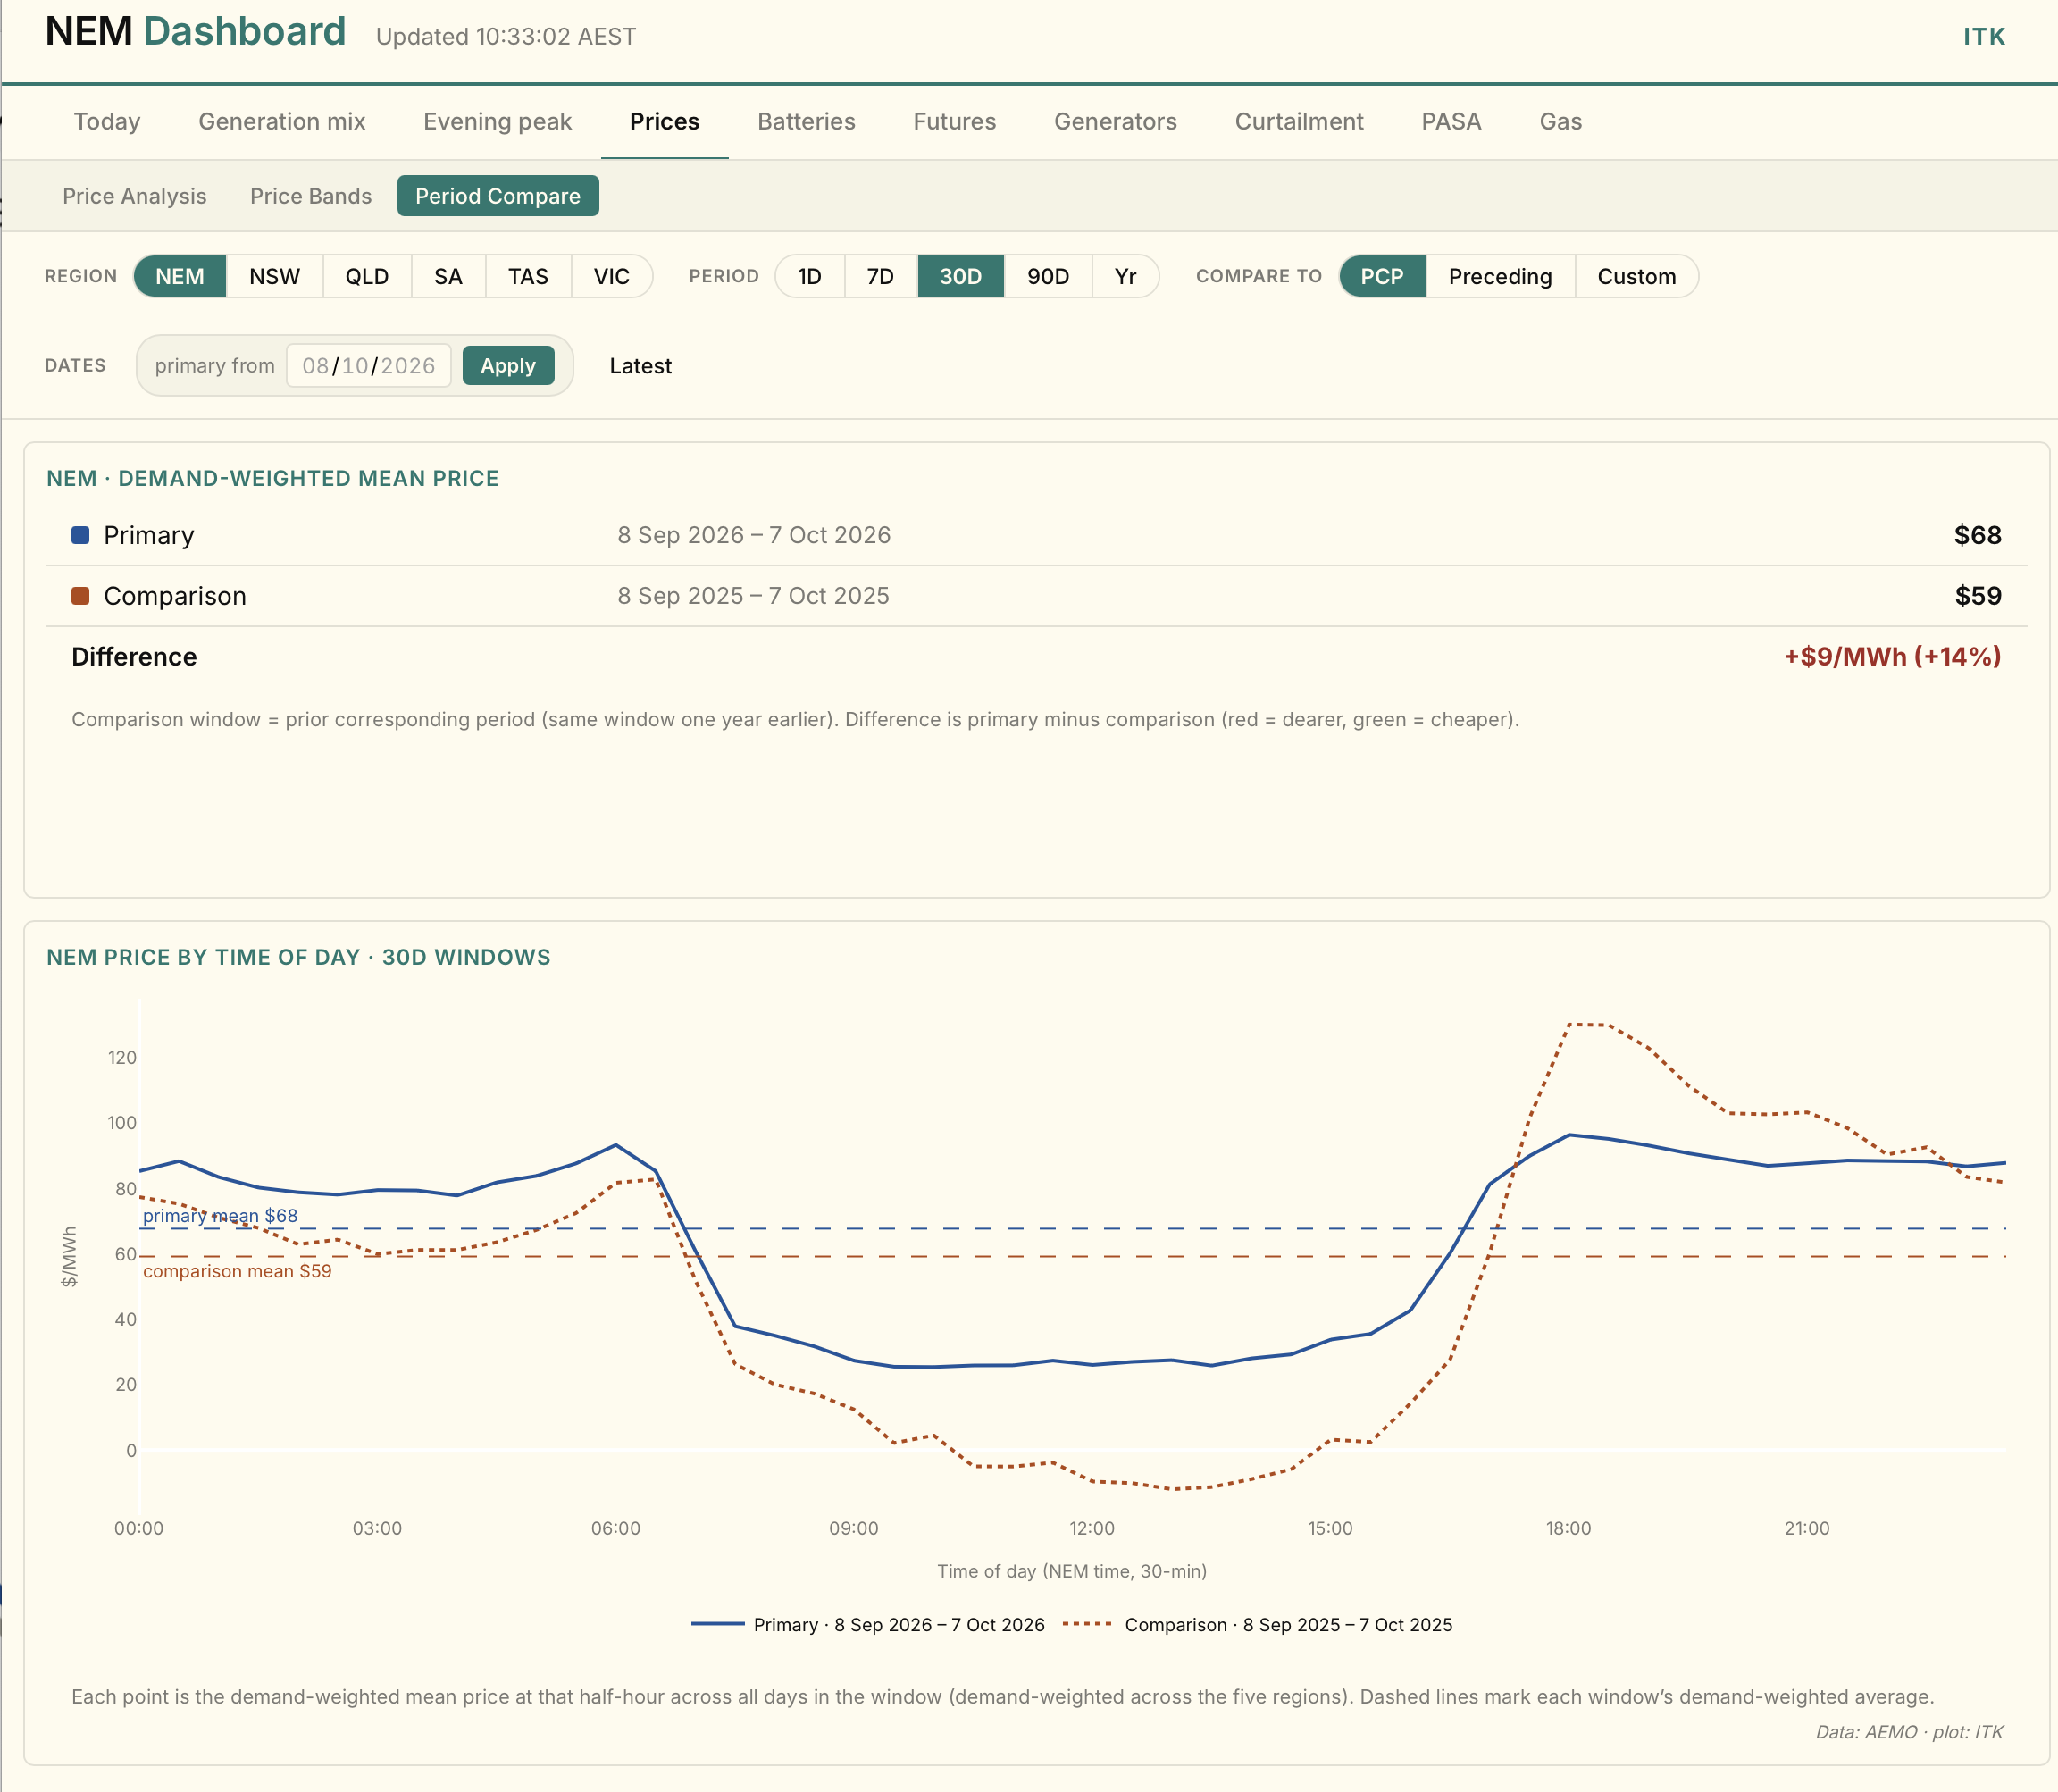
That the overall price rose is partly a spring effect. Spring evening peaks are modest, so there was less for batteries to take off them than there was to add at midday. Over a full year, lower evening prices have so far mattered more to the average than higher midday prices.
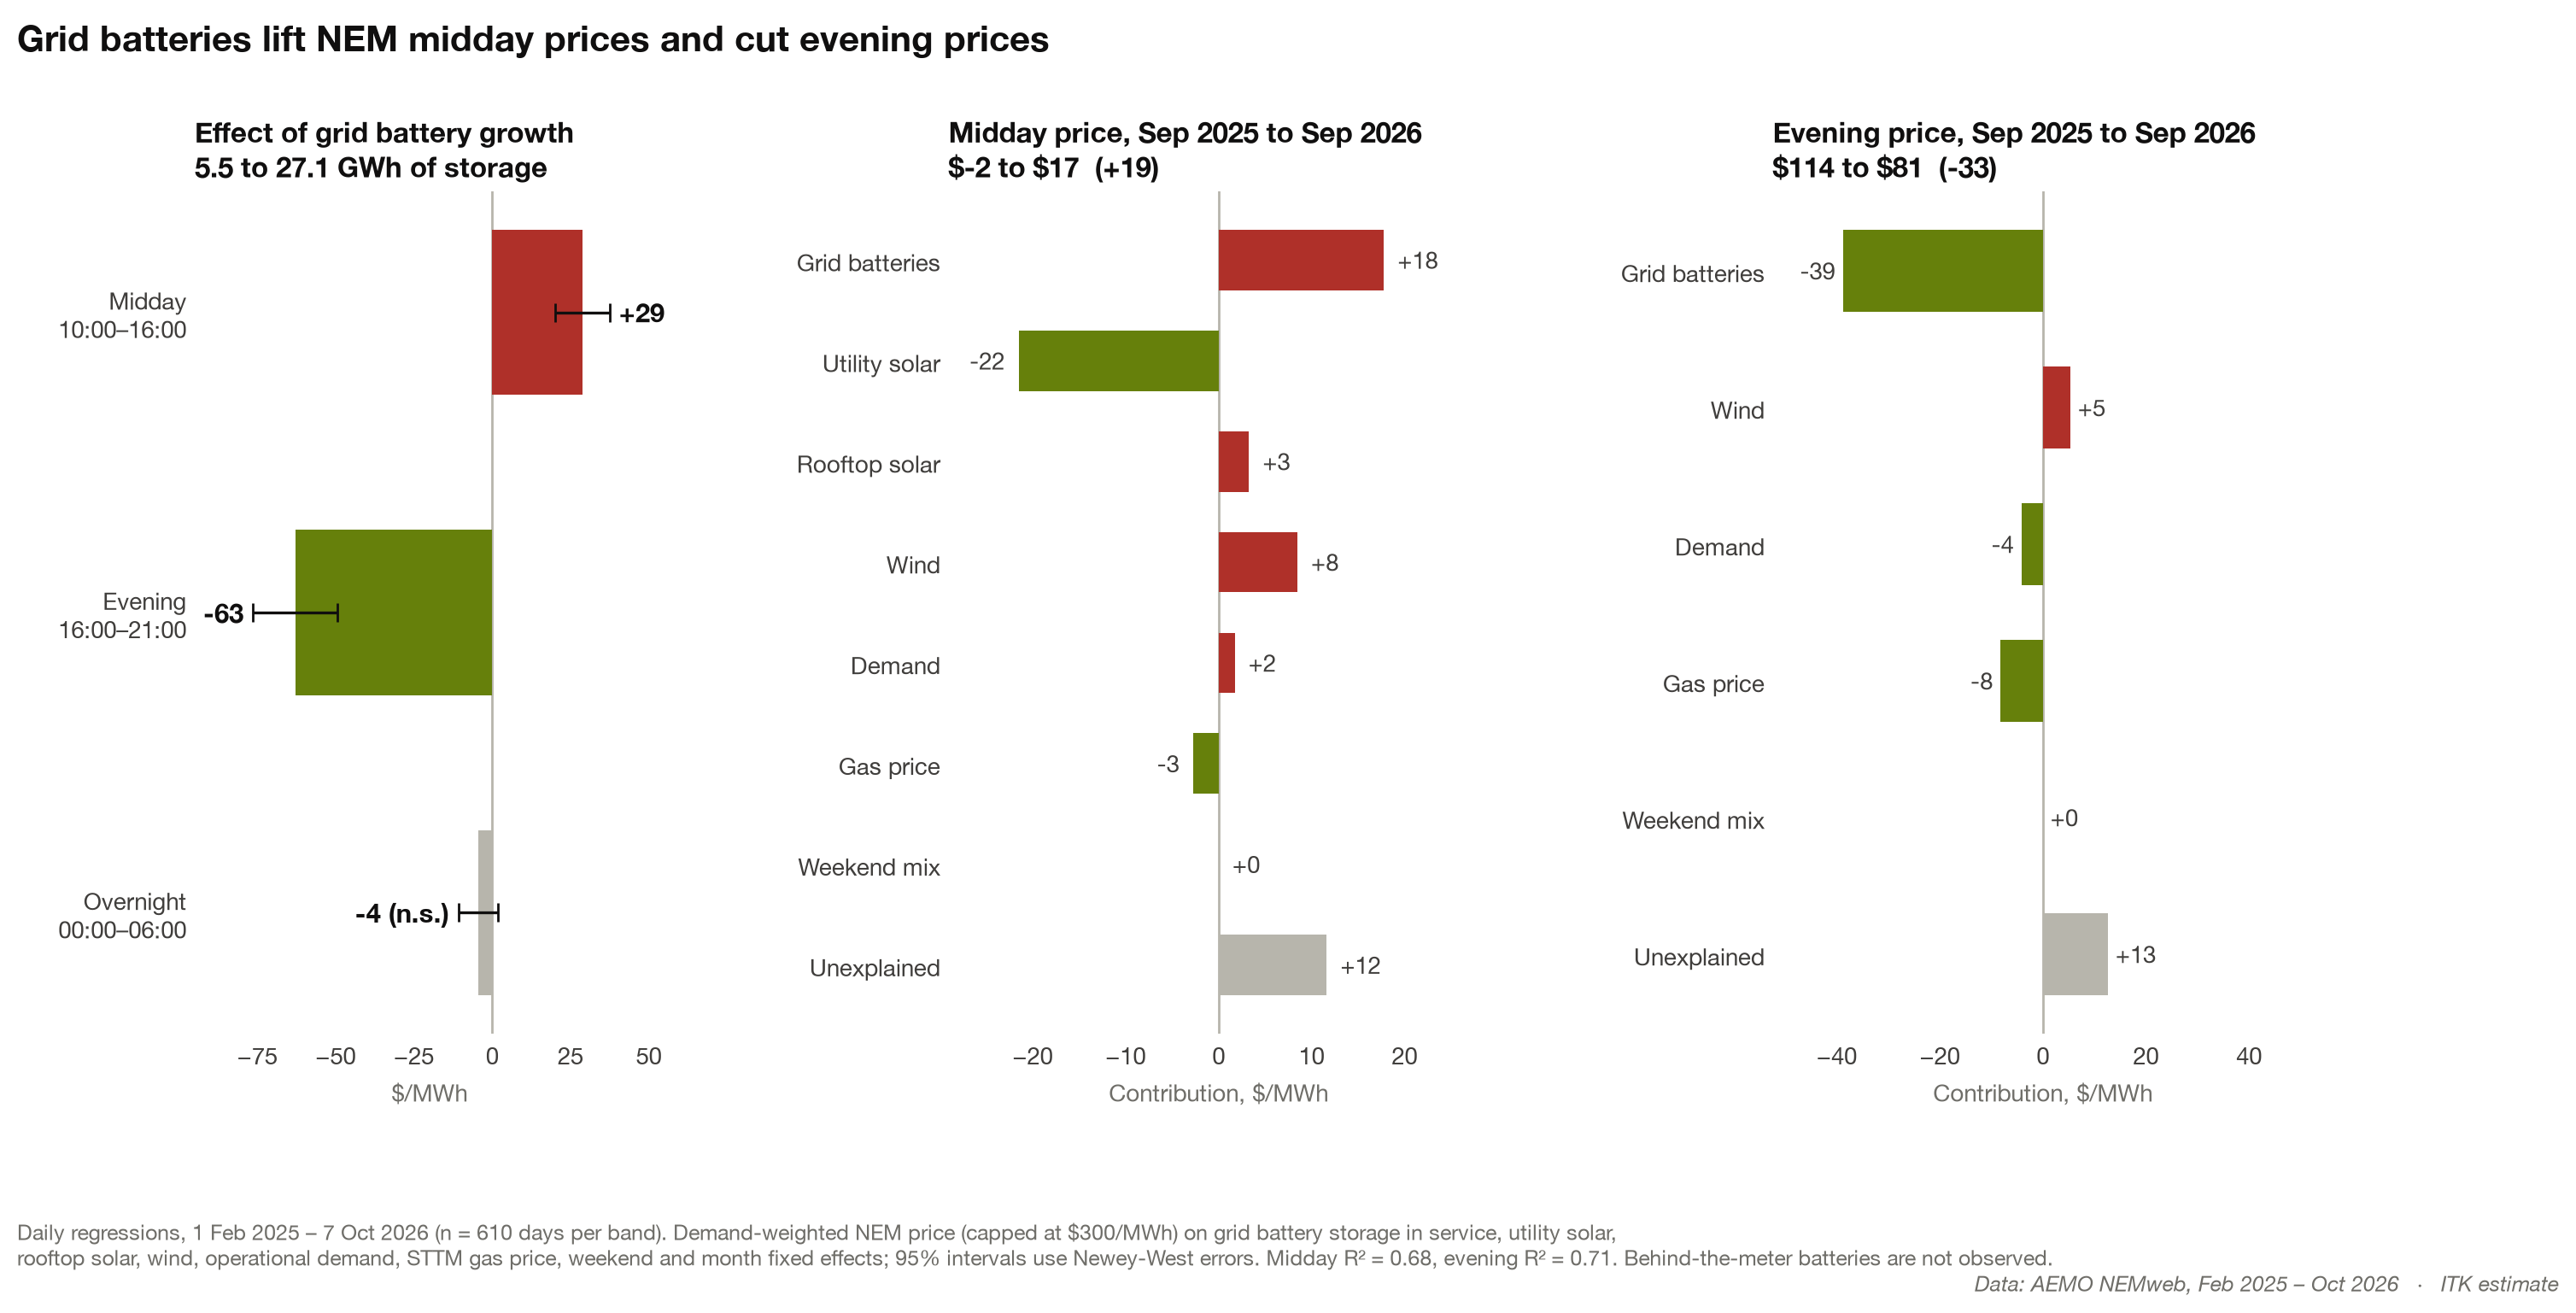
Even so, that midday prices had gone up at all was interesting. The basic expectation was that the increase in battery charging was outweighing the increase in solar.
First though I had Claude run a multiple regression on the data to see whether demand, wind, gas or other factors were driving prices. The results of such studies are of interest but can change very quickly. The R² (explanatory power) was around 68%, which is close enough for jazz. You have to look at the plot below carefully. The left panel shows the estimated effect of the growth in grid battery storage, from 5.5 to 27.1 GWh: plus $29/MWh at midday and minus $63 in the evening. The other two panels split the change between September 2025 and September 2026 into its causes. For instance, less wind at midday added $8.
Then we can look at the impact of utility batteries:
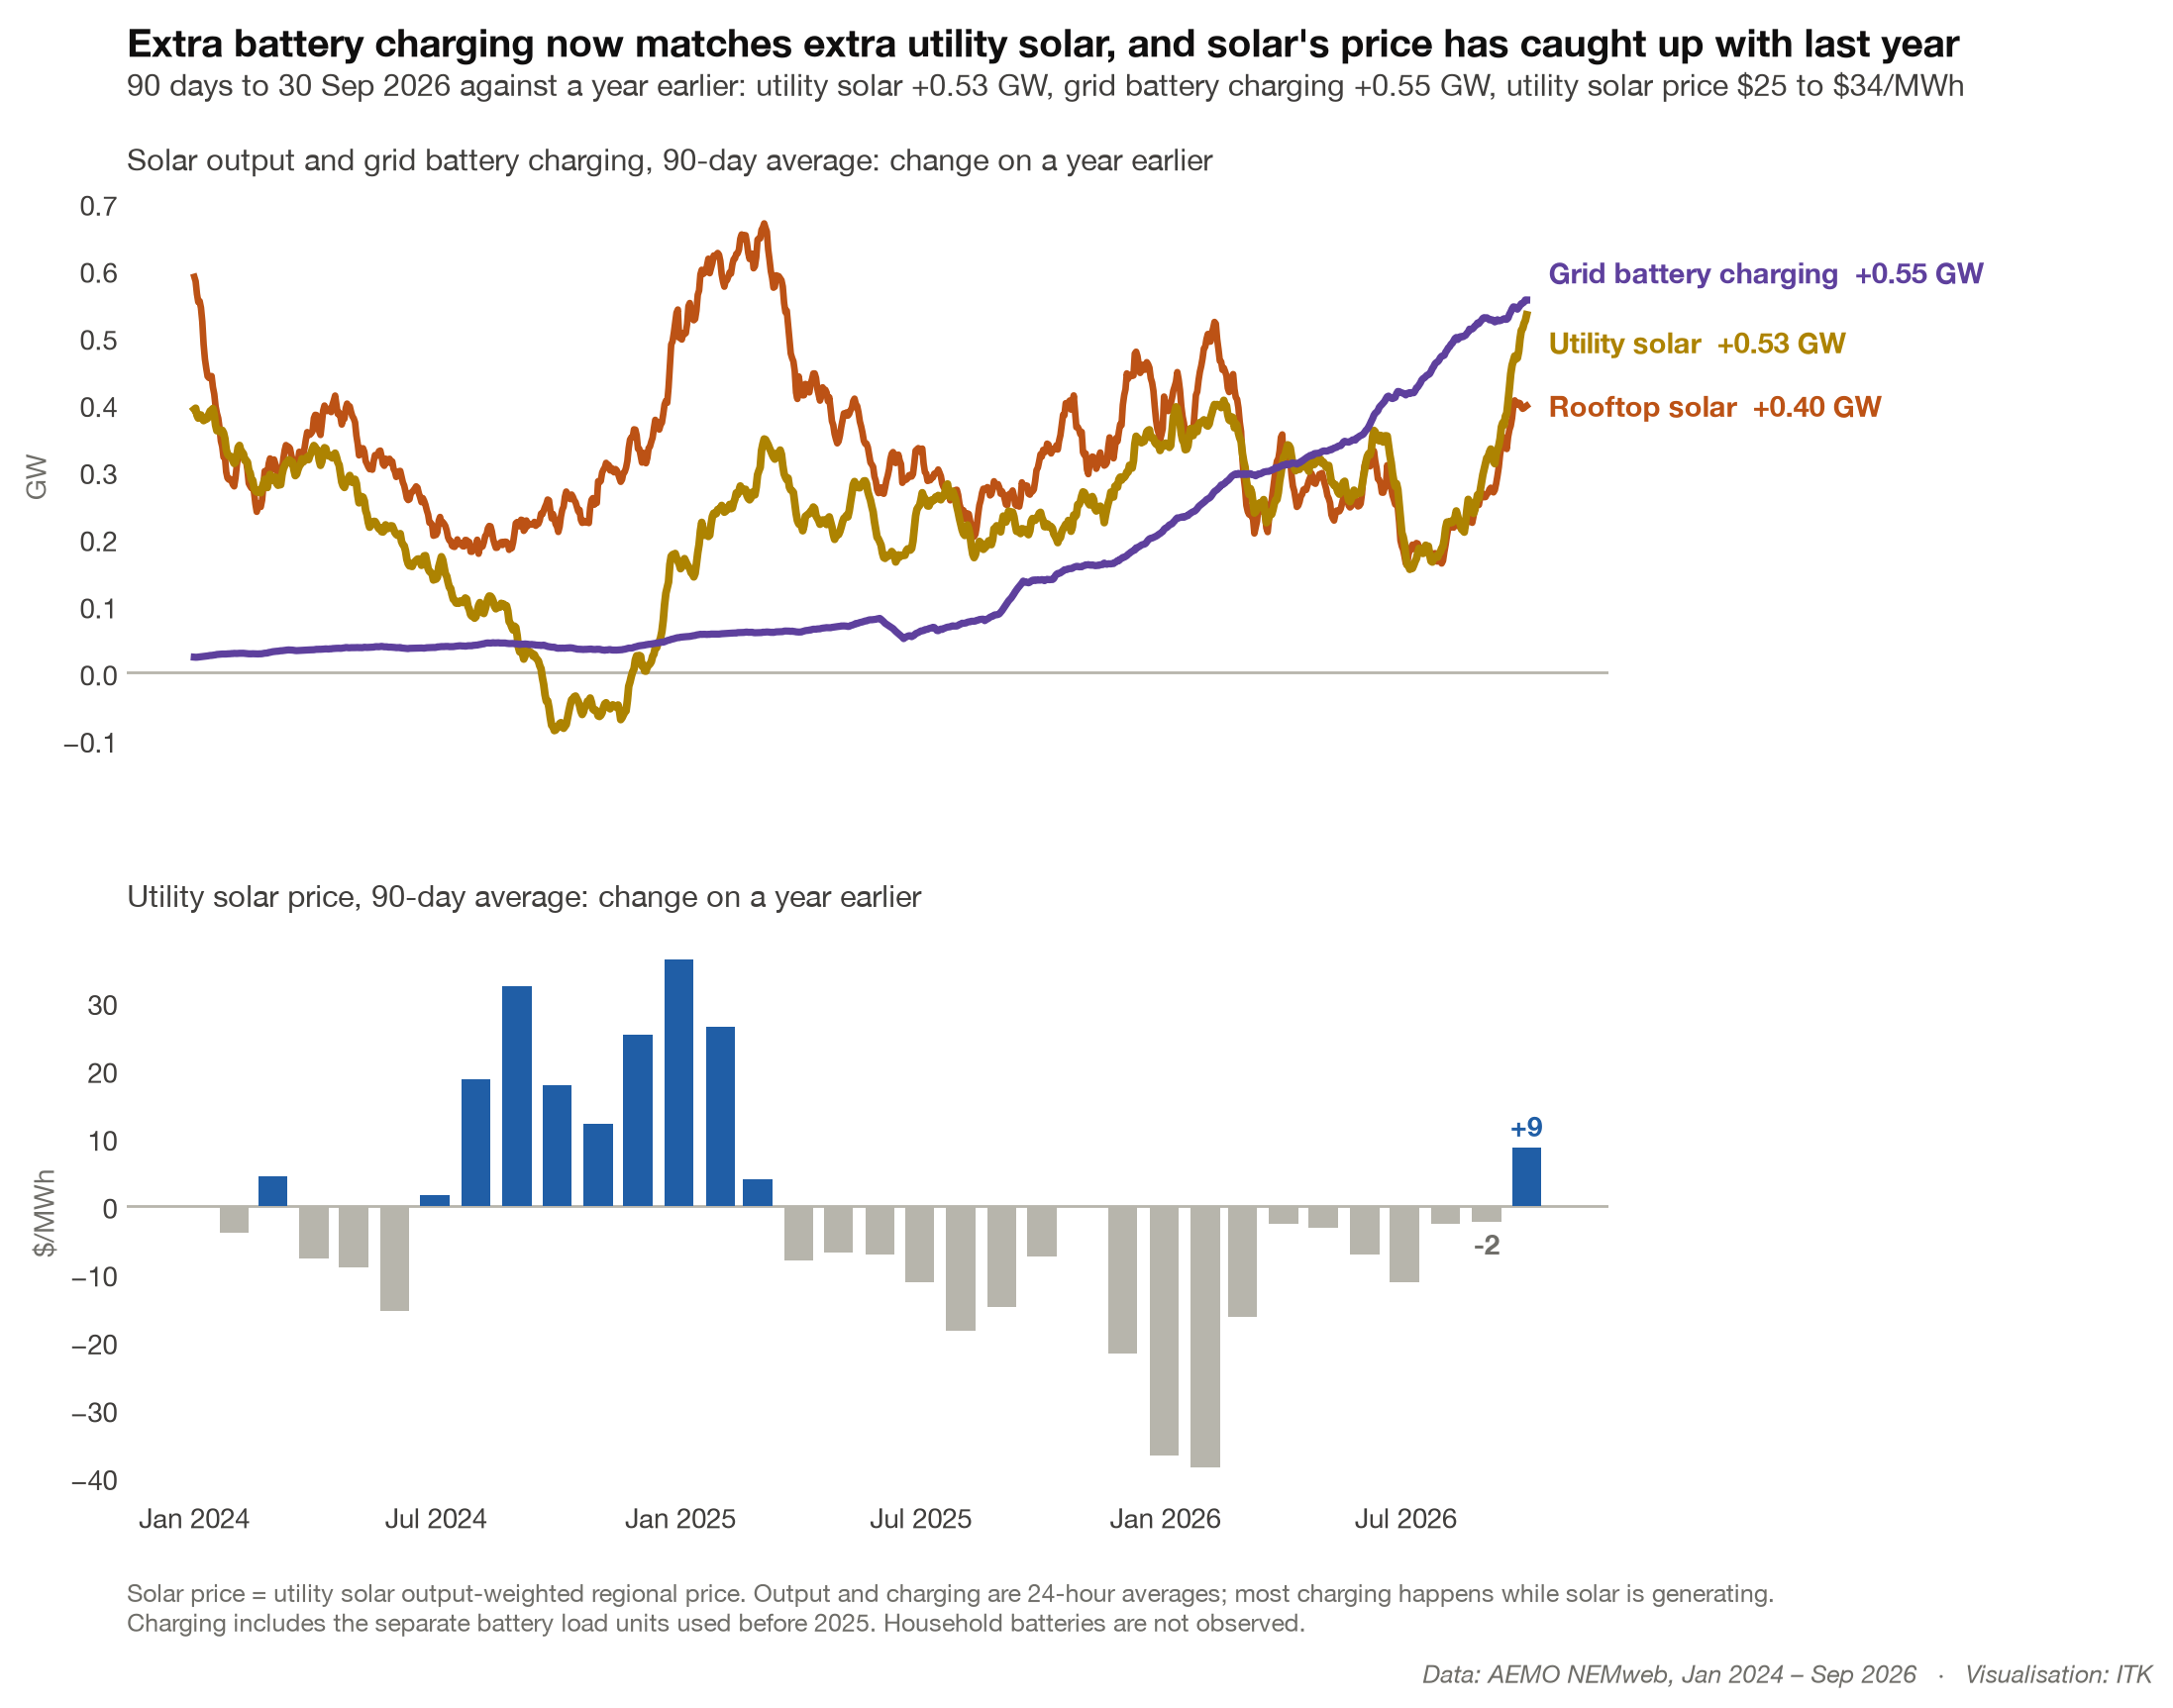
You can see that the increase in grid battery demand exceeds the increase in utility solar and for that matter the increase in rooftop solar. The output-weighted solar price has also more or less stopped declining and even went up using the 90 day average for the last month.
We still can’t see directly what household batteries are doing, but we can infer it from underlying demand: grid demand plus rooftop solar output. A home battery charging from rooftop solar at midday cuts exports, which shows up as higher underlying demand; discharging in the evening cuts it.
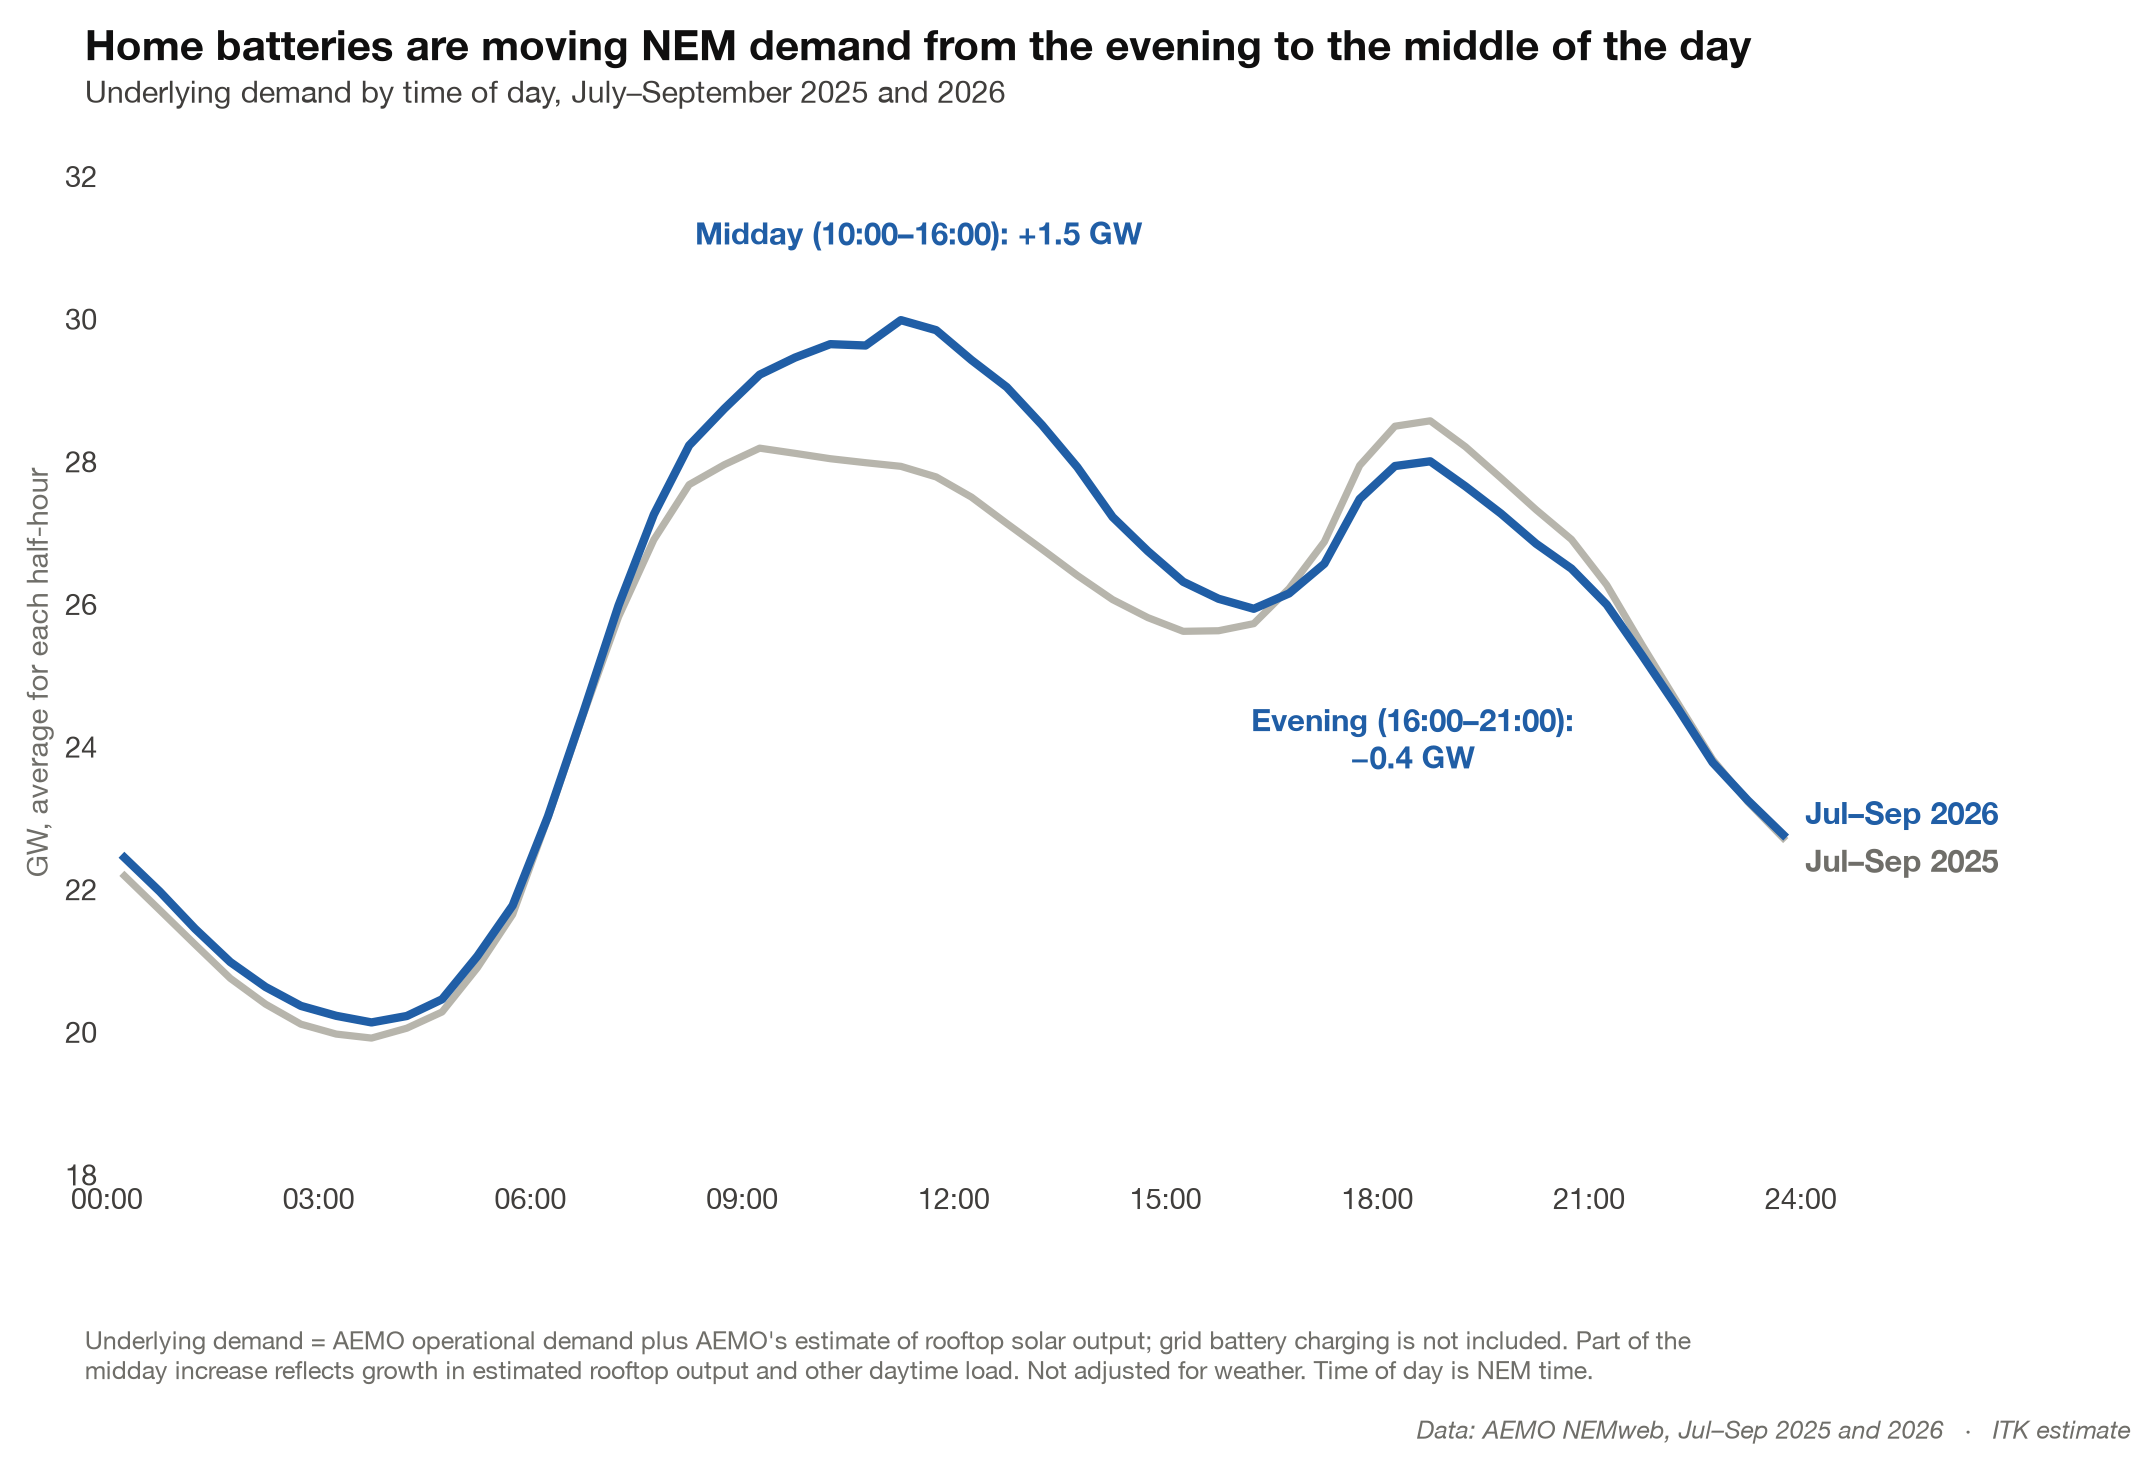
Underlying demand is up 1.5 GW in the middle of the day; some of that is EV charging, but on our estimate only about 0.05 GW. Evening demand is down 0.4 GW. The midday increase exceeds the evening reduction, so total demand has risen, and the extra demand arrives at the time of day when prices were lowest. Who knew? The cure for low prices is low prices.
Looking forward
Solar prices will need to rise a lot more before developers get excited. The following plot is a seasonally adjusted trend; the table on the chart shows the actual price over the past 12 months.
Funnily enough, the trend is a more sophisticated version of a time series analysis methodology that I first learned at the University of New England in 1973 and was arguably the only useful academic thing I learned that year, that is if we exclude Hare’s rejection of moral relativism from Philosophy 101.
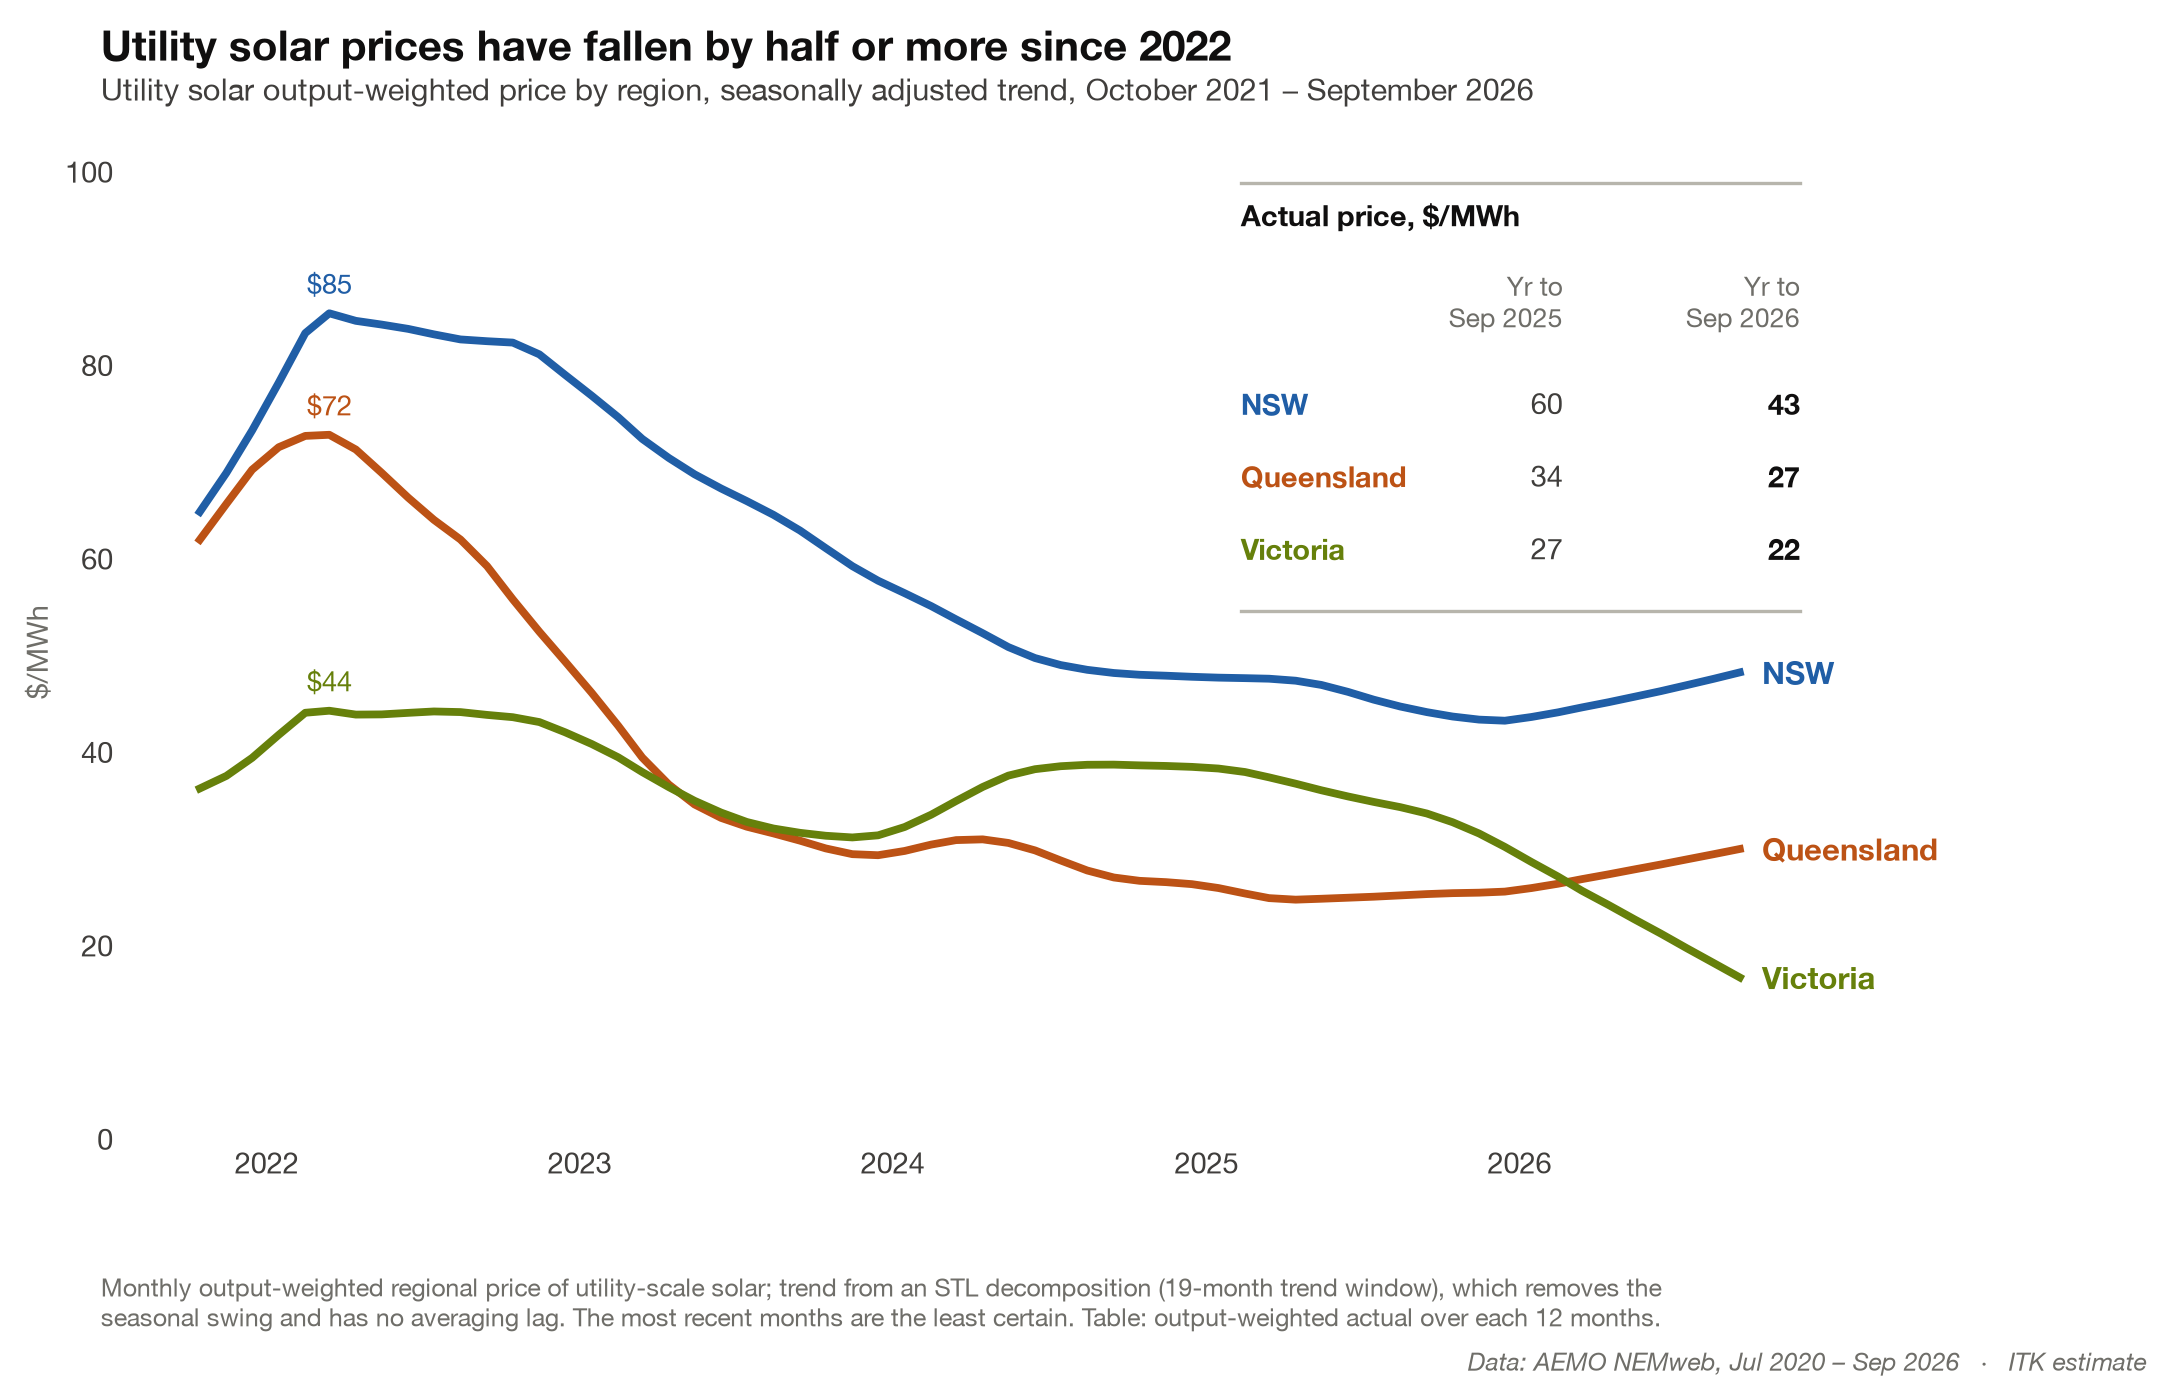
NSW, at $43/MWh, is closest. At $27, Queensland solar prices need to at least double, and at $22 Victoria’s are beyond hope; arguably even a Yallourn closure won’t provide a sufficient lift.