A global battery and cell brief
In this note I have refreshed my understanding of the global battery market. The focus is technology, applications and end markets and letting visualisations do the talking.
Normally reviews of this kind start with a hockey stick showing how the end market was very small and then took off. That is undoubtedly true for batteries where lithium turned the battery industry from powering torches to running the country and an ever increasing share of the world’s car industry. But as ever I try to look forward where the hockey stick has less relevance.
Captain Matthew Henry Phineas Ryall Sankey (1853–1925) lights the way
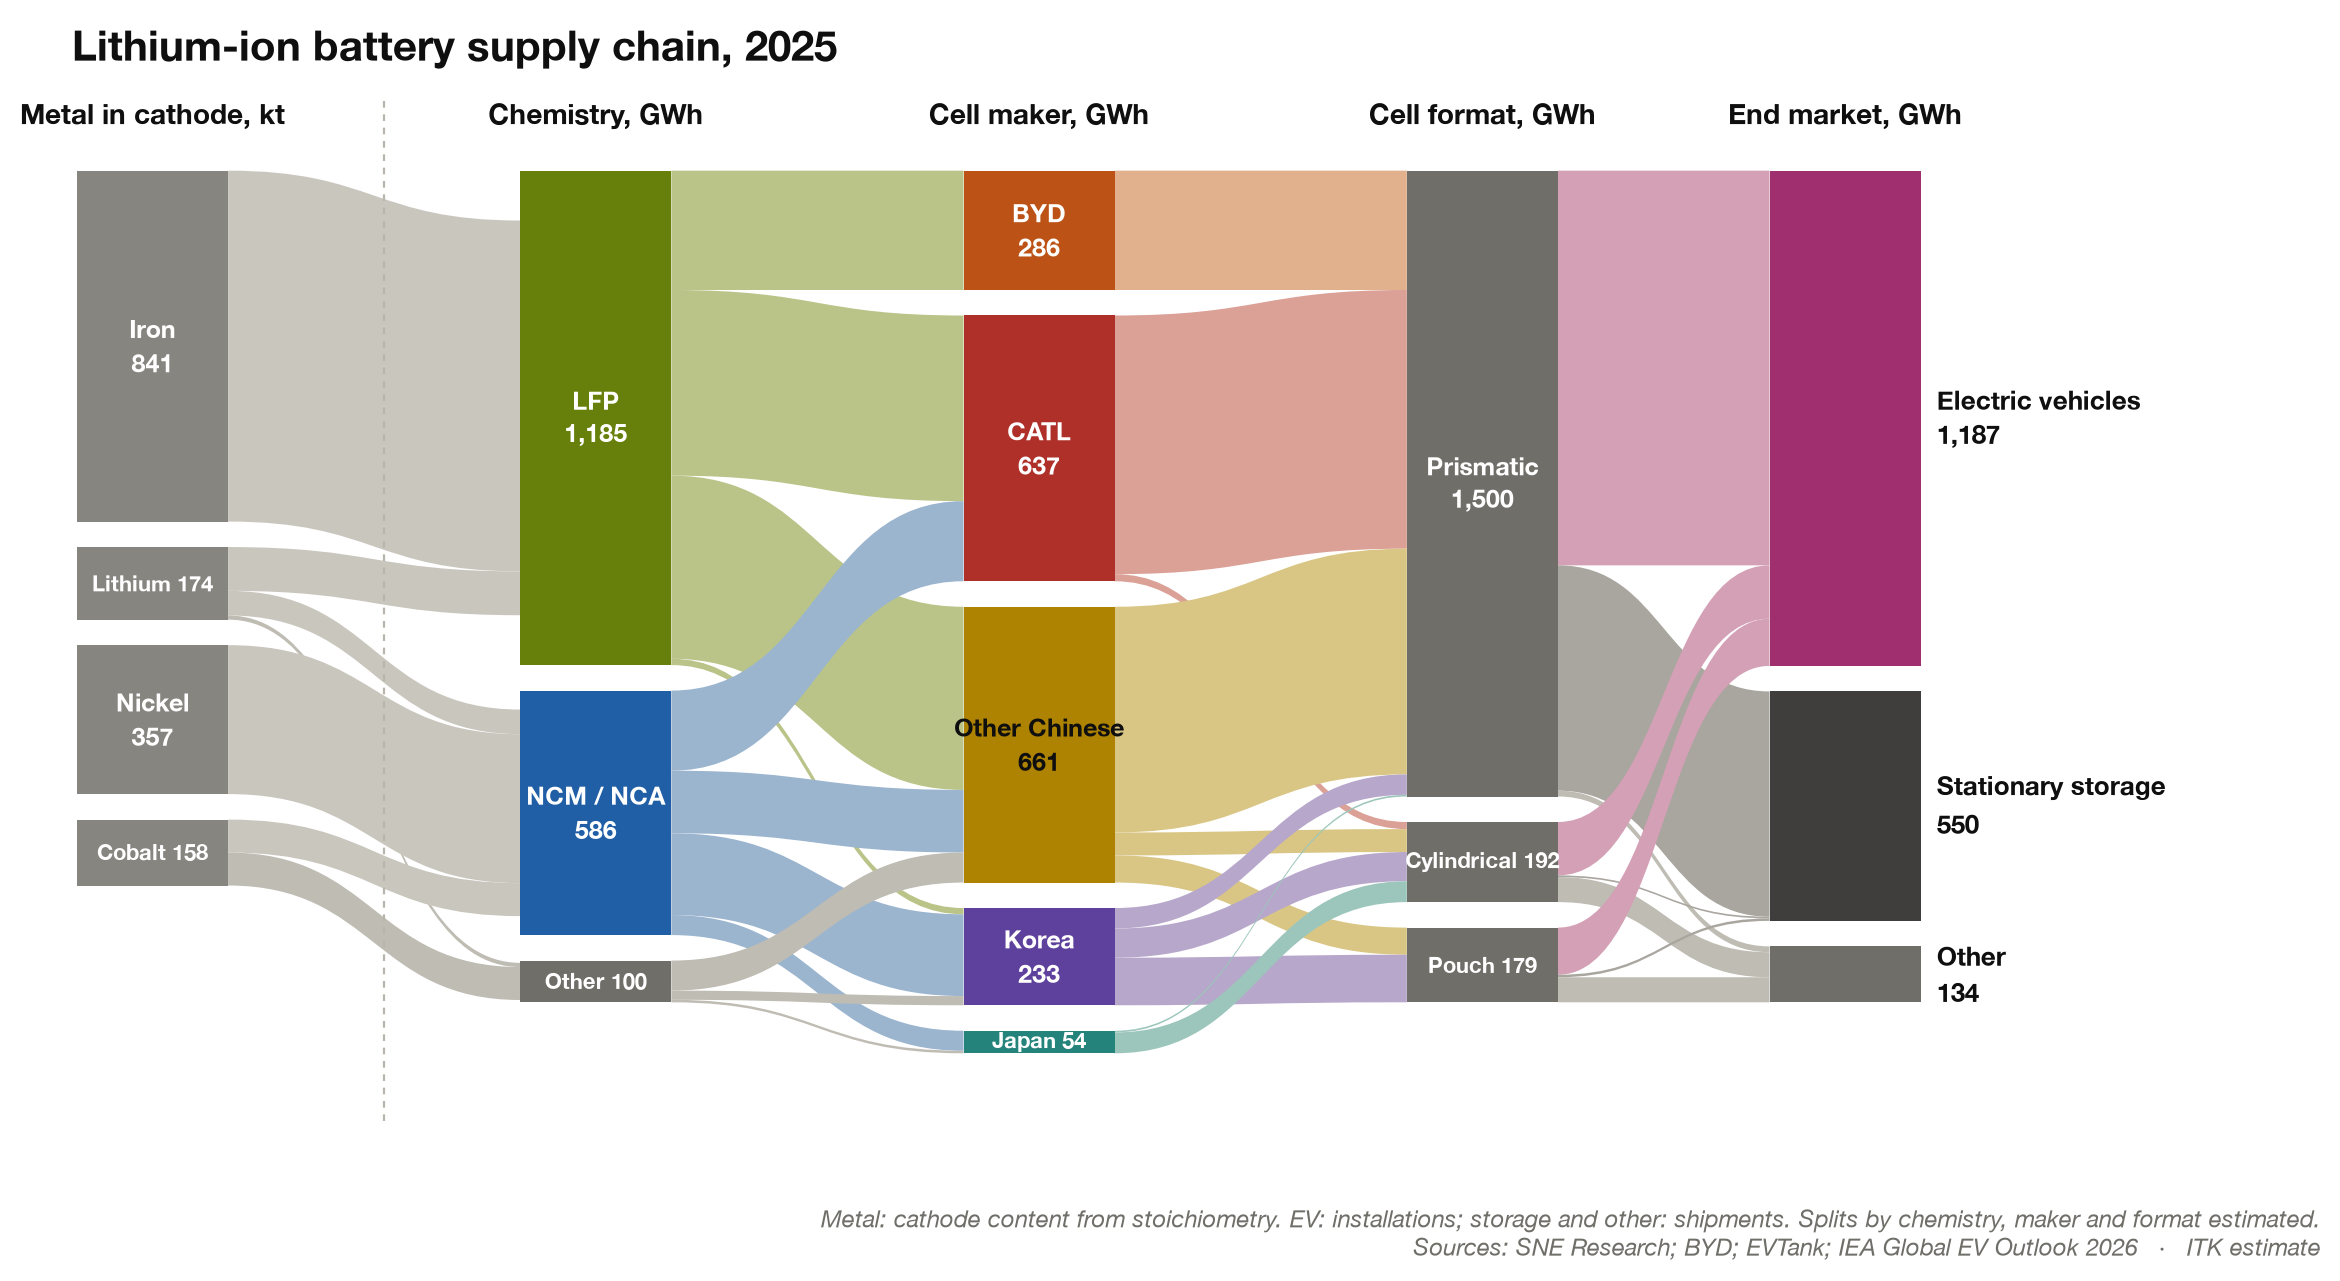
If we want to look at the industry flows by stage, a Sankey diagram is the way to go. Who doesn’t love a good Sankey? Some people, though, consider Minard’s 1869 depiction of the 1812 retreat from Moscow (arguably the world’s most famous graph) the true origin.
Only a year ago I’d have been so proud of this diagram it would have been worth framing. Look at how much information there is and how well it’s summarised. Might be wrong but it looks good. Now it’s a morning’s work. Ho hum.
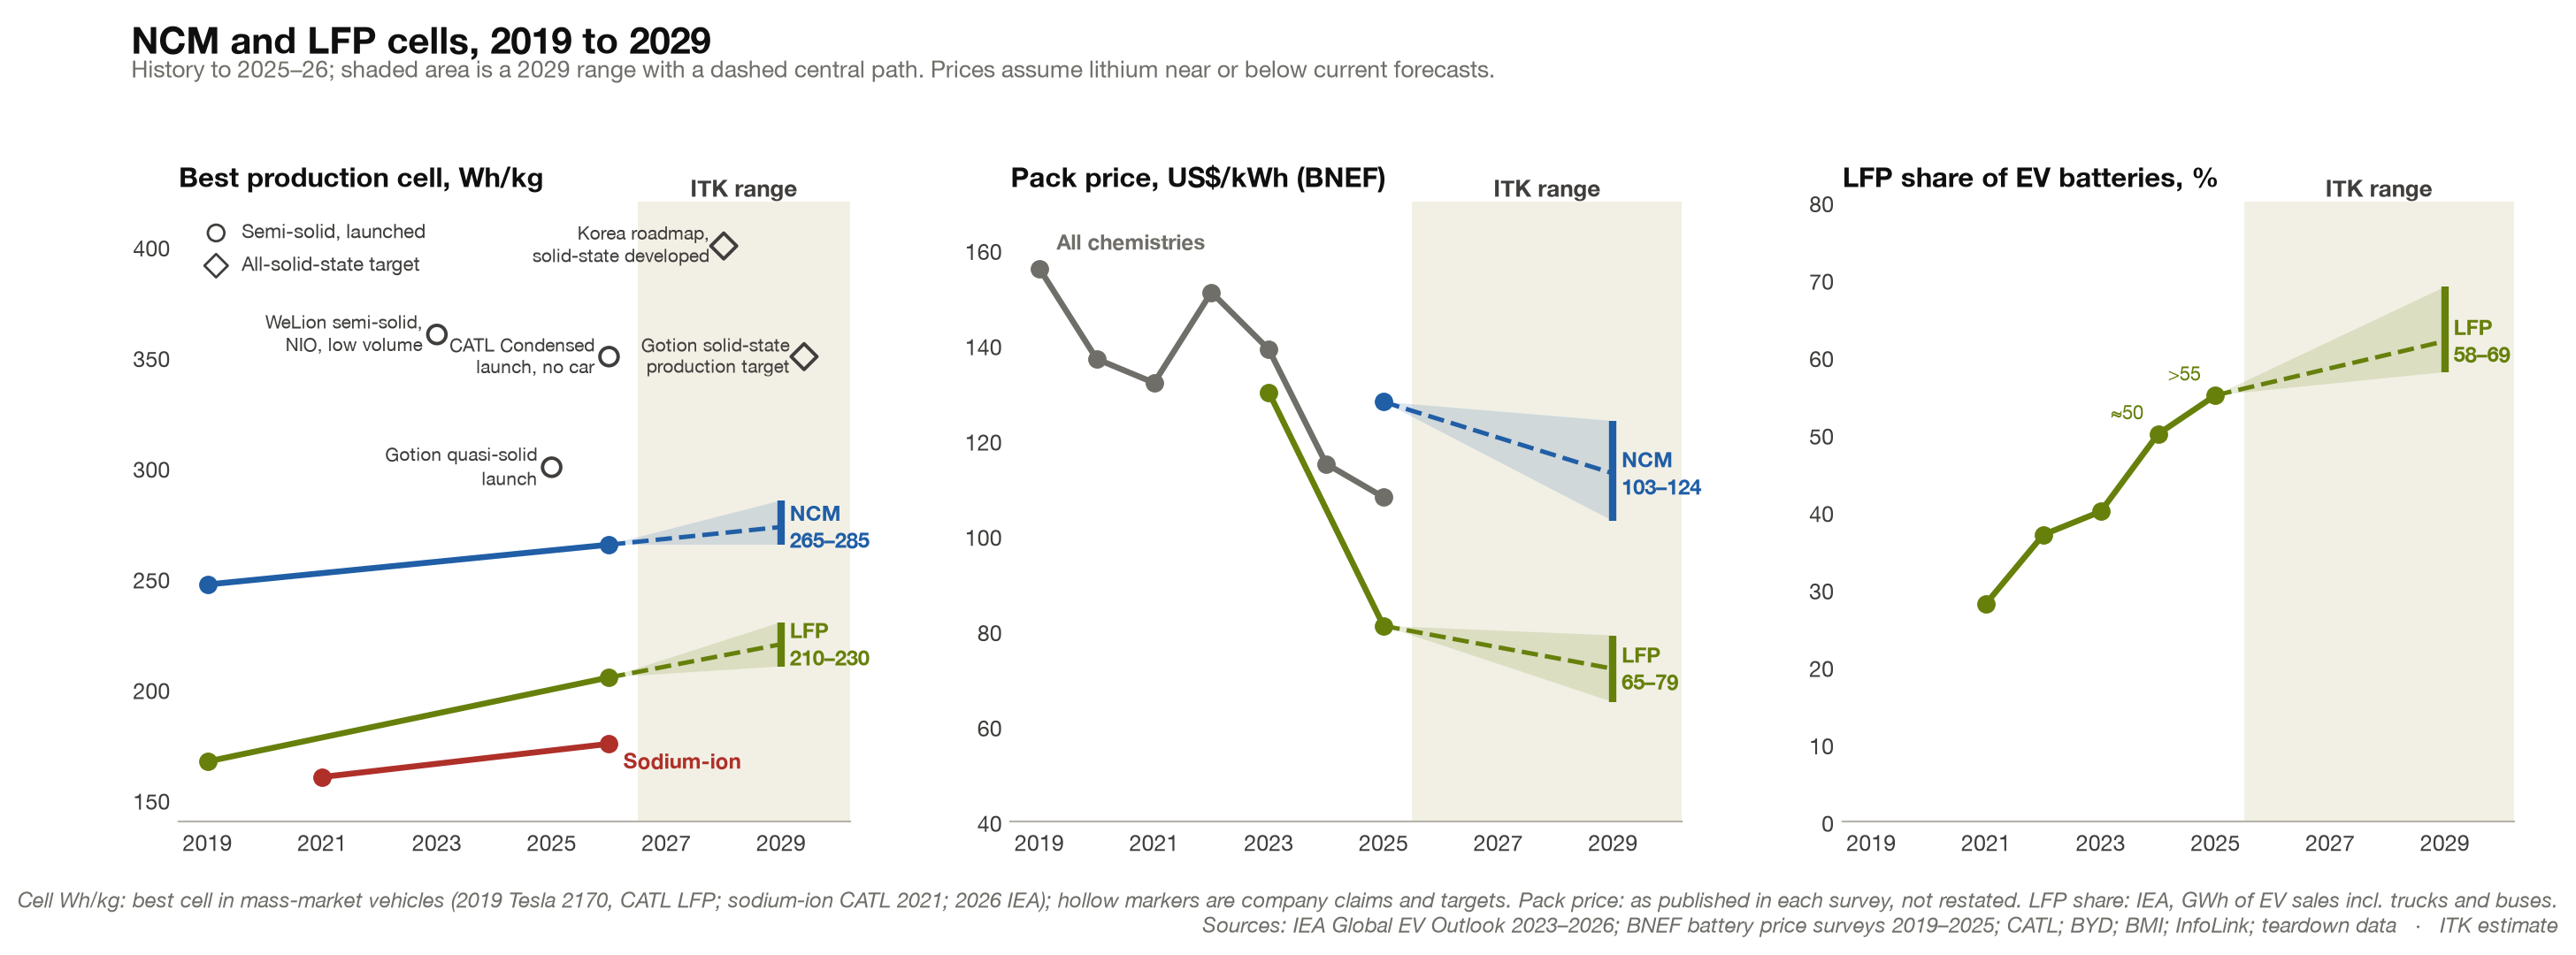
Next we can look at the technology progress since 2019 and some more or less naive projections of the future.
Then we can look at the trade-offs between nickel-cobalt-manganese (NCM) and lithium iron phosphate (LFP) cells.
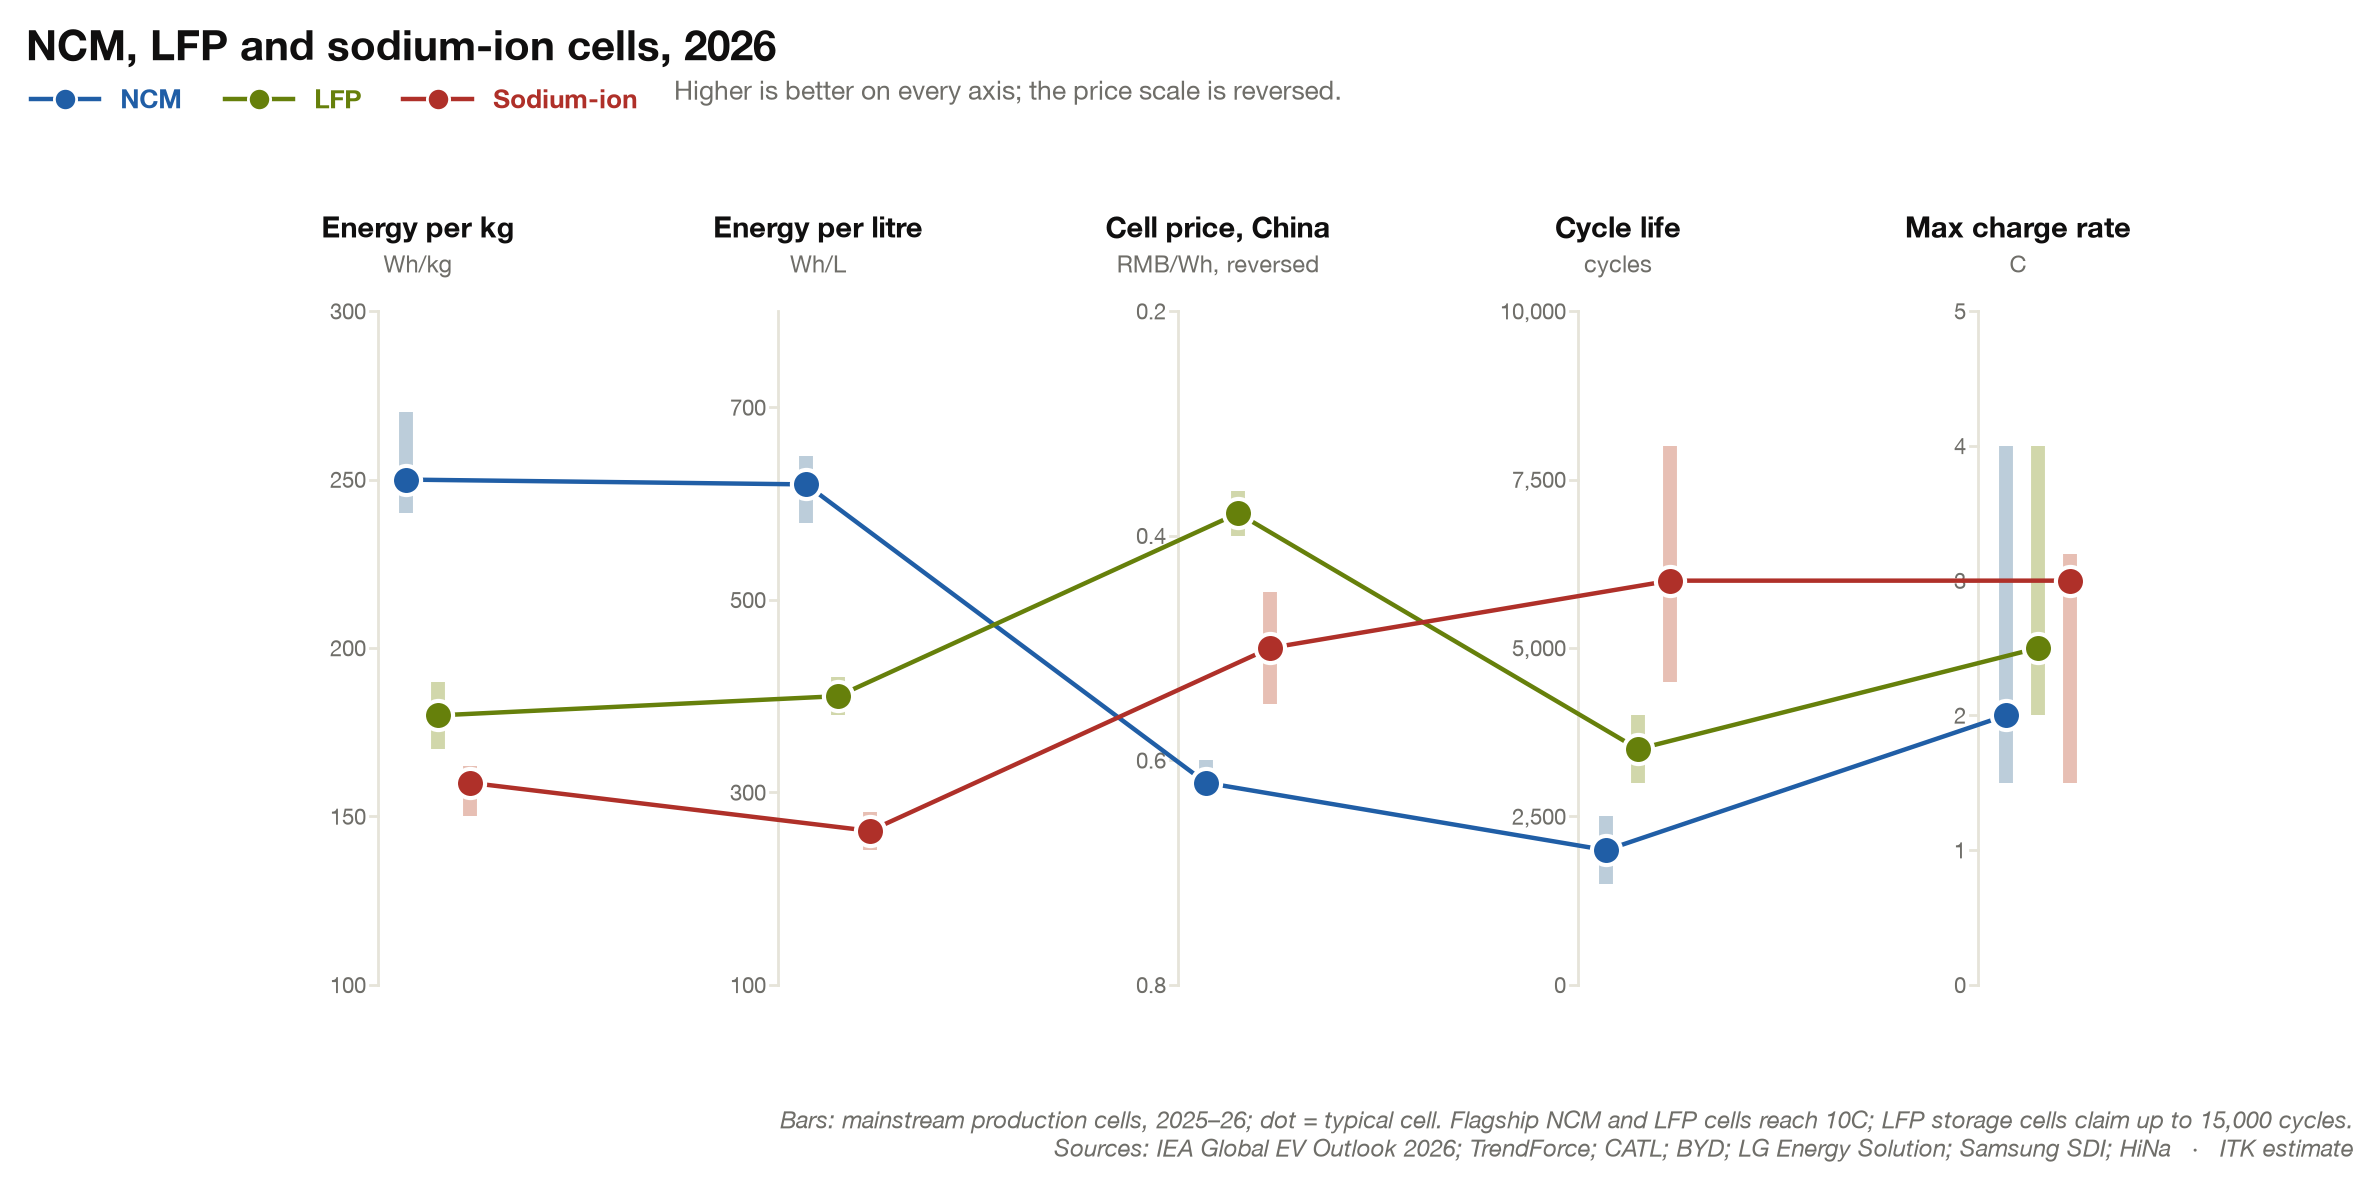
NCM batteries are used in premium cars where the greater energy density means you can push more energy into a given volume and the price differential doesn’t worry the buyer. Because the battery is only part of the car, the price gap between the chemistries is a smaller share of the car’s price than of the battery’s.
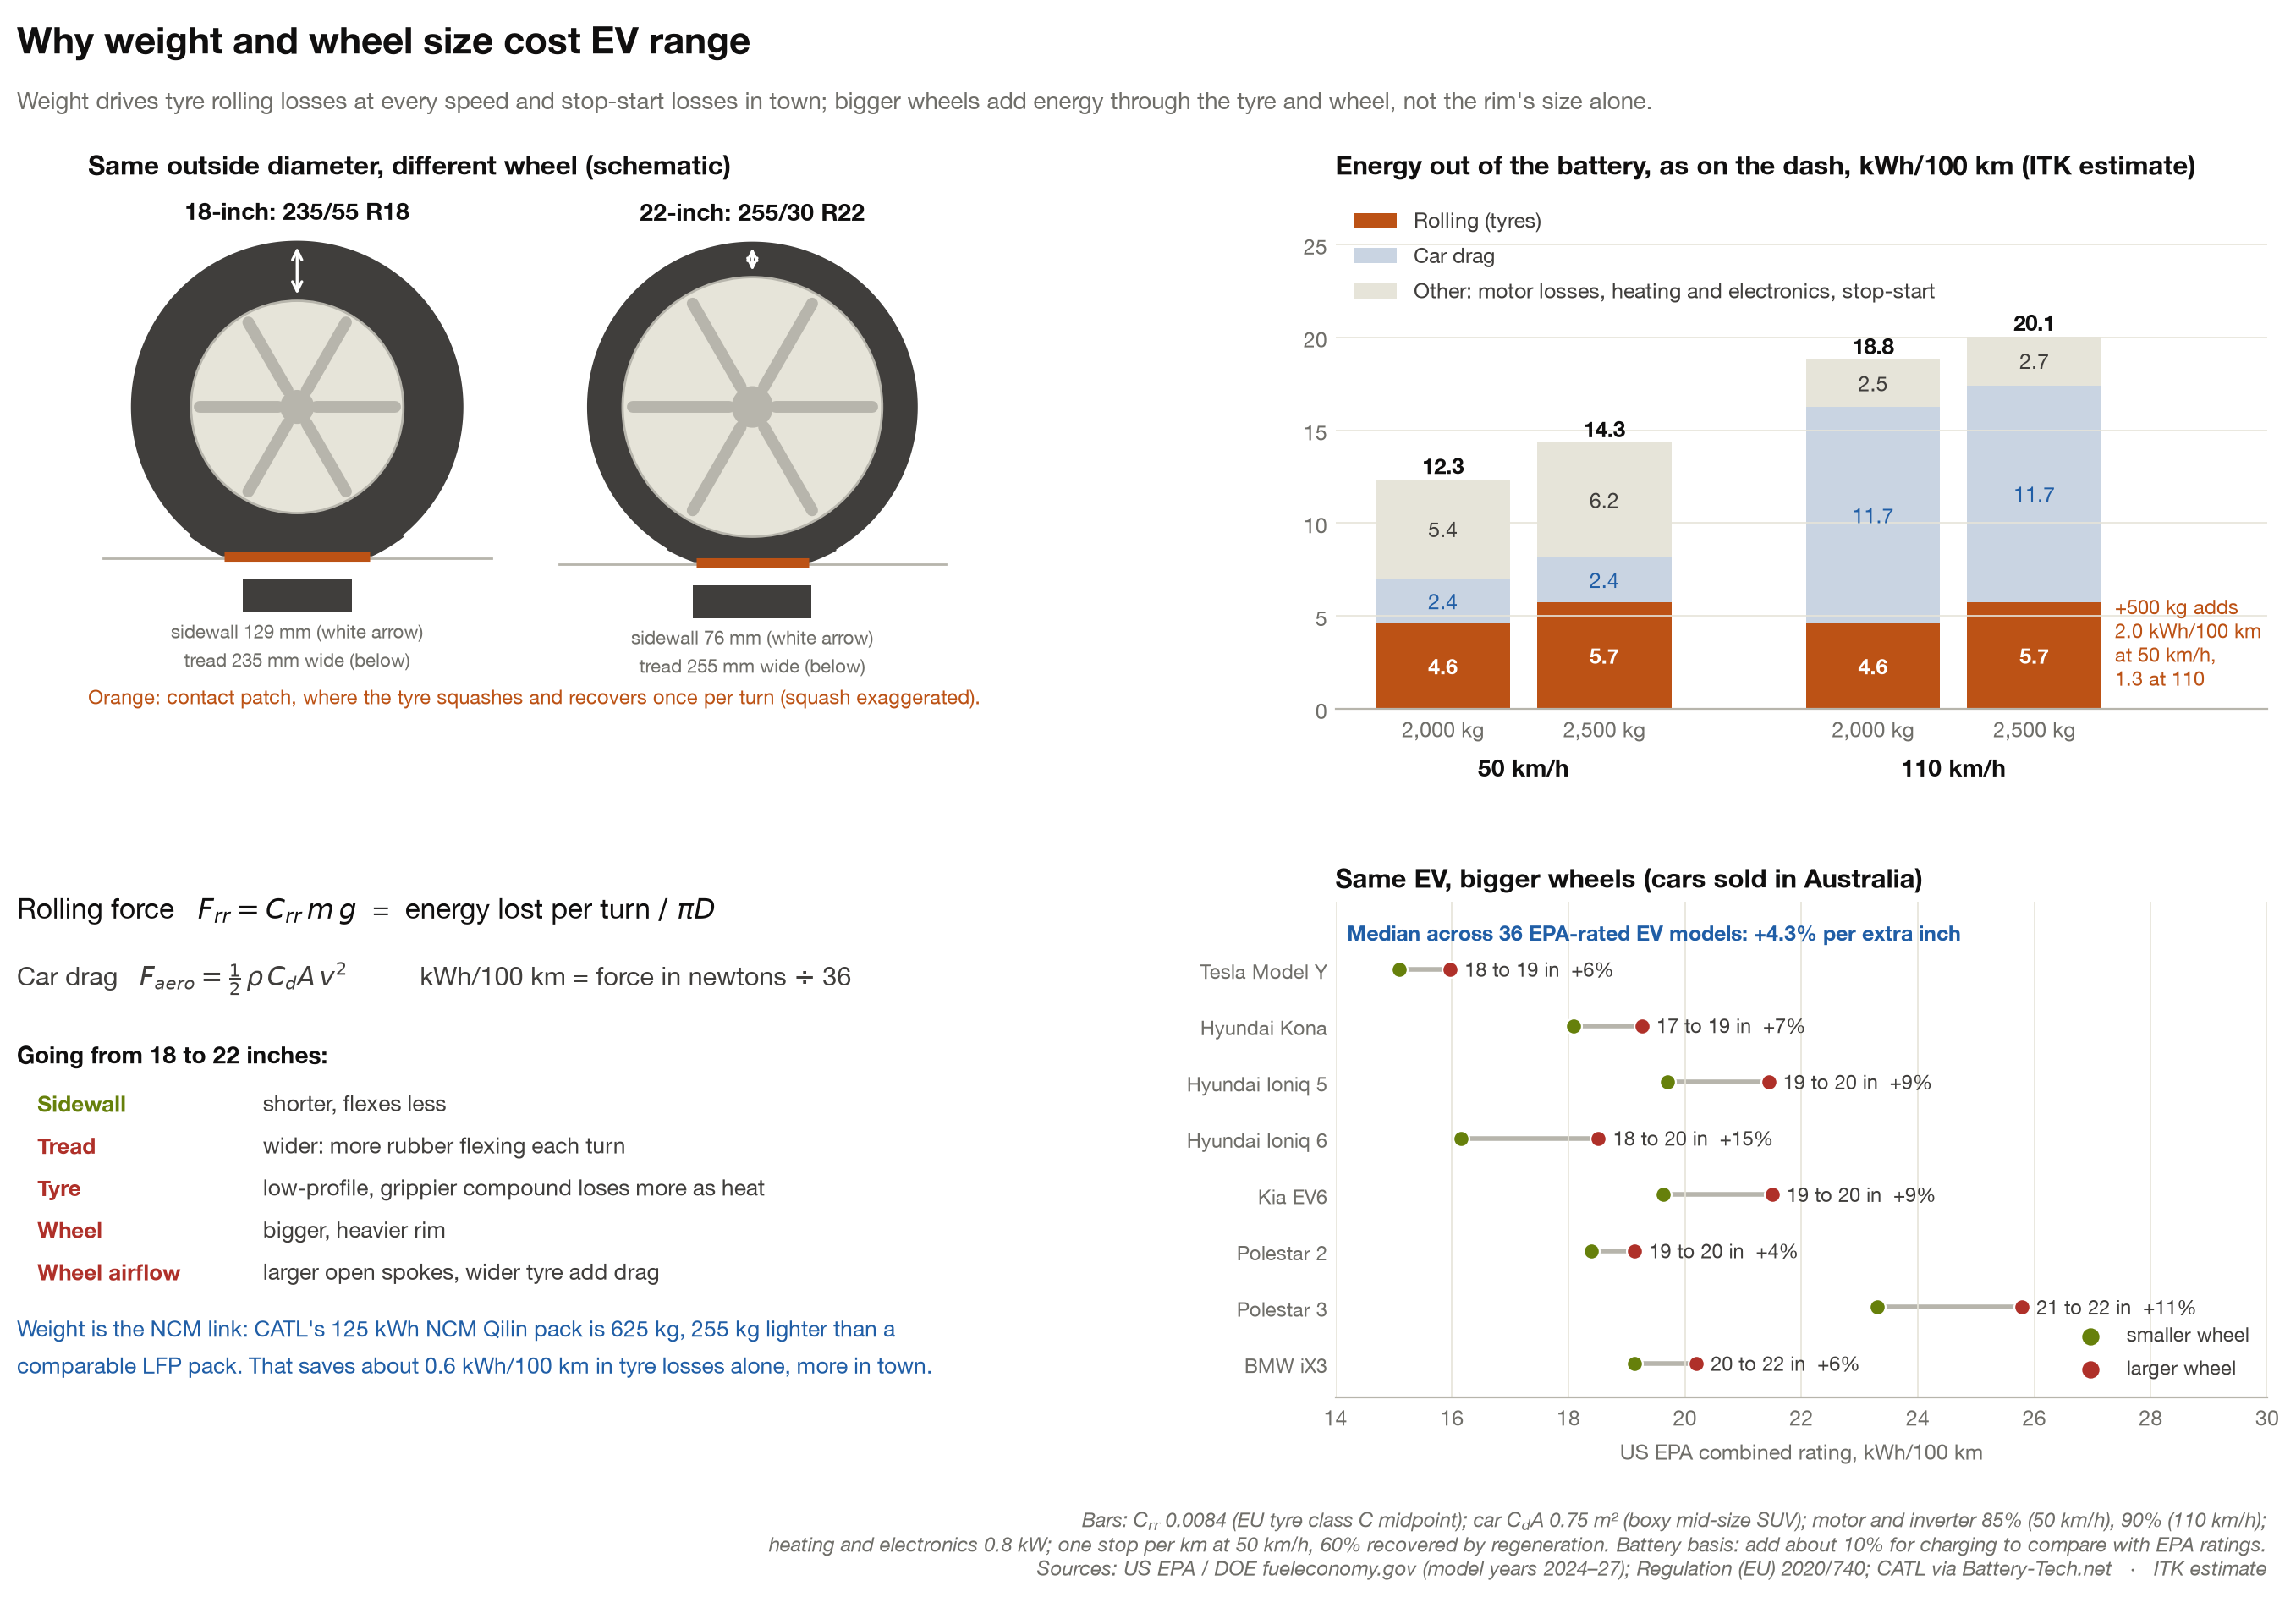
The lower weight also makes a difference, but not in the obvious way (acceleration drag). Weight costs energy mostly through rolling resistance: the energy lost as the tyre squashes and springs back, which rises in proportion to the car’s weight. The estimate is an extra 500 kg on a mid-size SUV adds about 2 kWh per 100 km in town and 1.3 at 110 km/h, where aerodynamic drag dominates.
In practice this wheel penalty is then exacerbated by bigger wheels. It is an absolute mystery to me why electric car owners pay more for bigger wheels. In the US EPA tests the same model typically uses about 4% more energy for each extra inch of wheel. People pay more to get a worse car. Is that a metaphor for modern life?
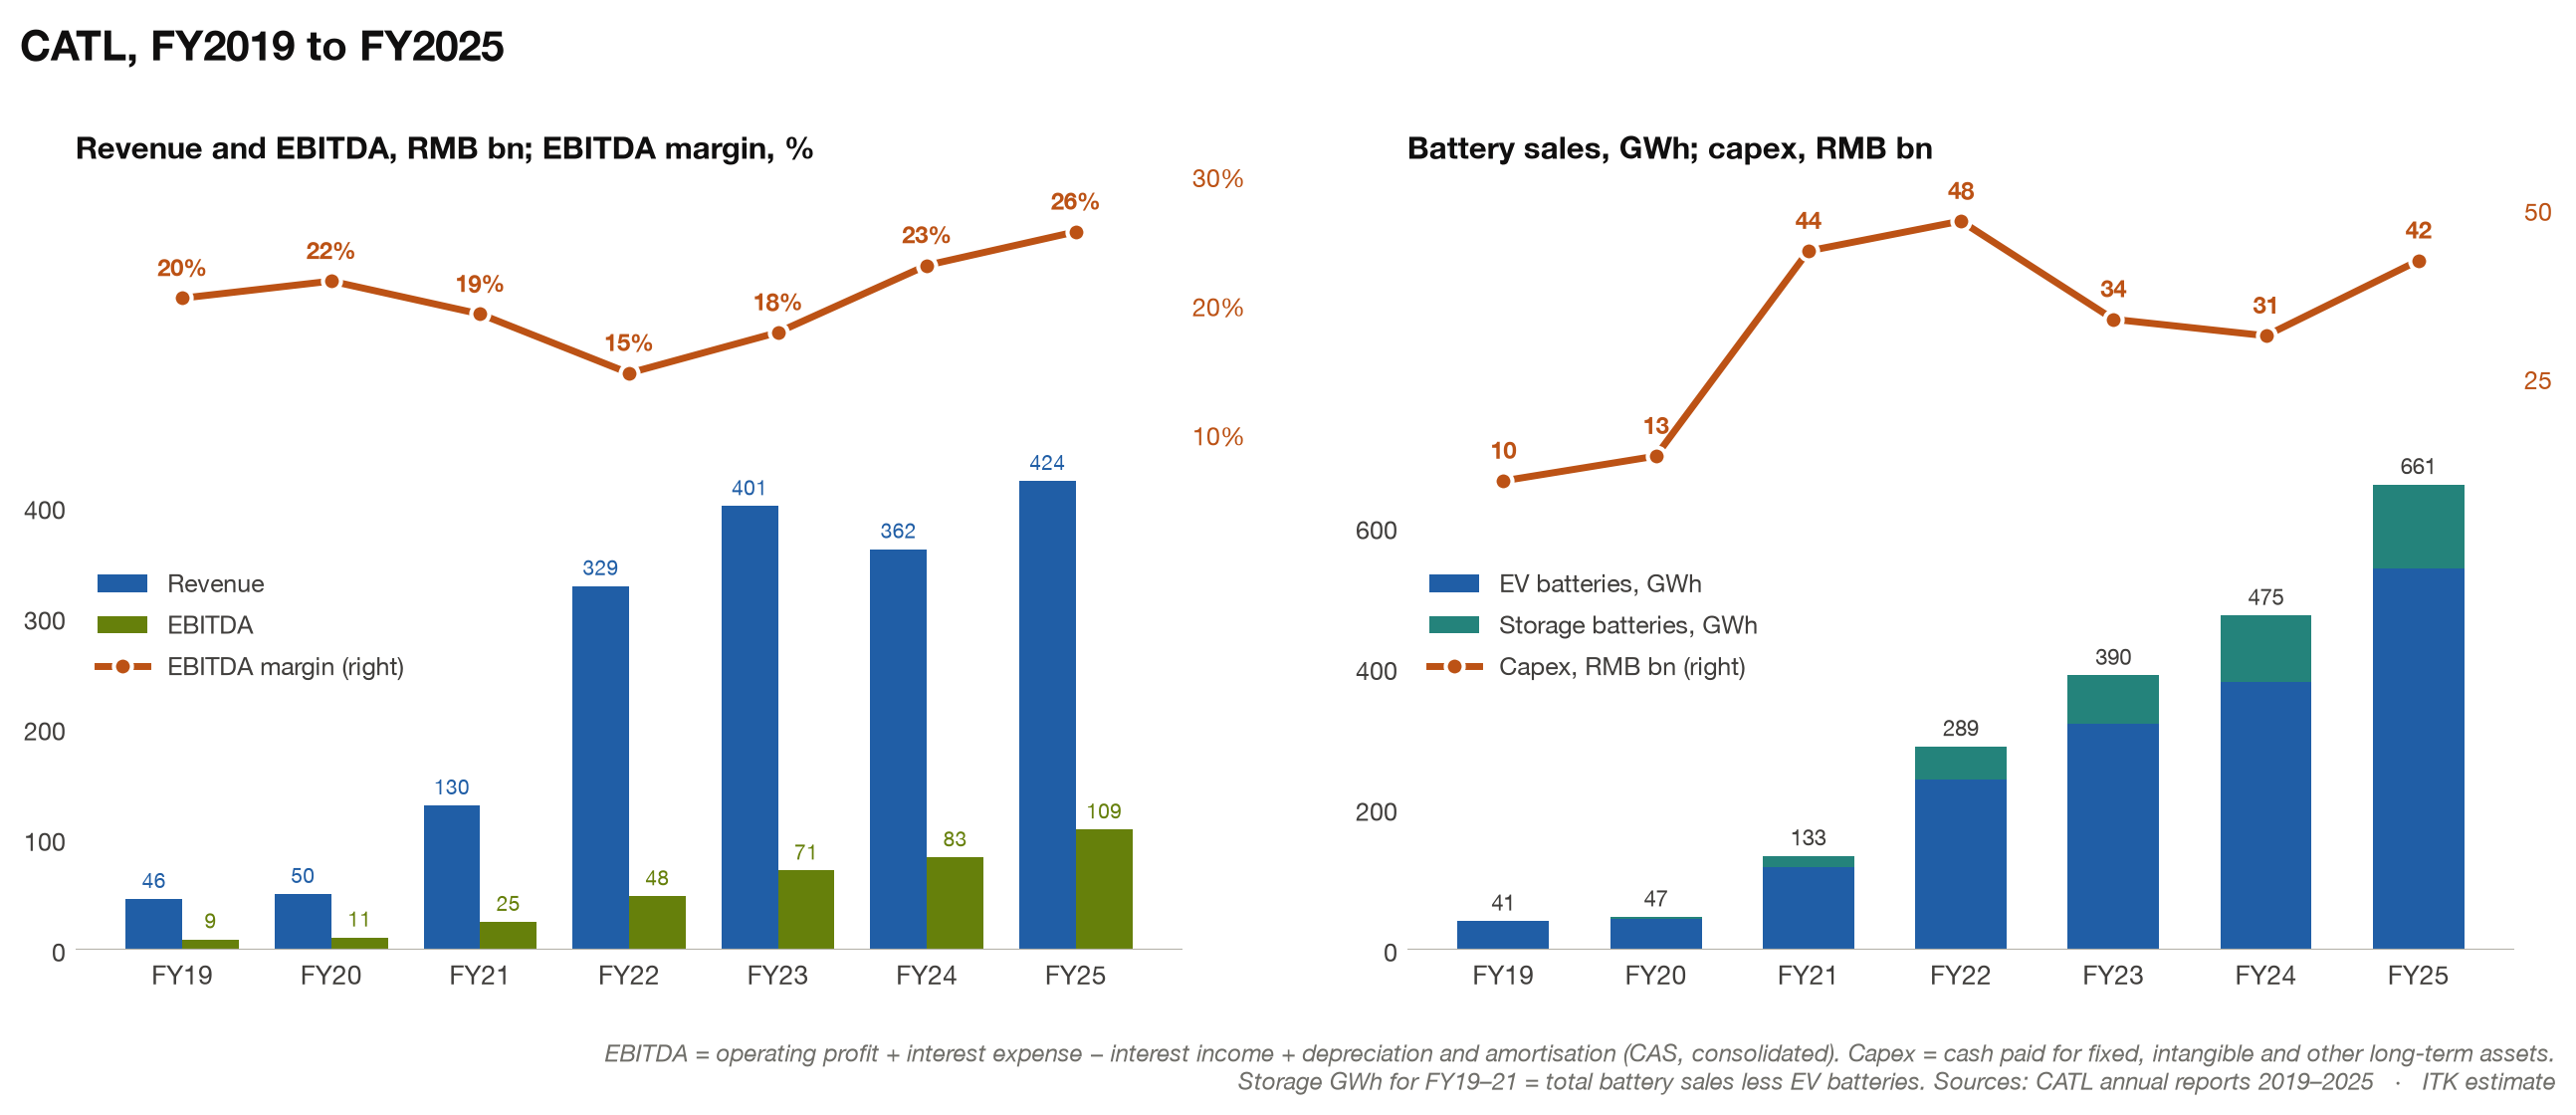
In contrast to solar panel manufacturers, battery maker margins seem OK
CATL is publicly listed and reports quarterly. At first glance, and I have only plotted the numbers, not analysed them, its results look OK-ish.
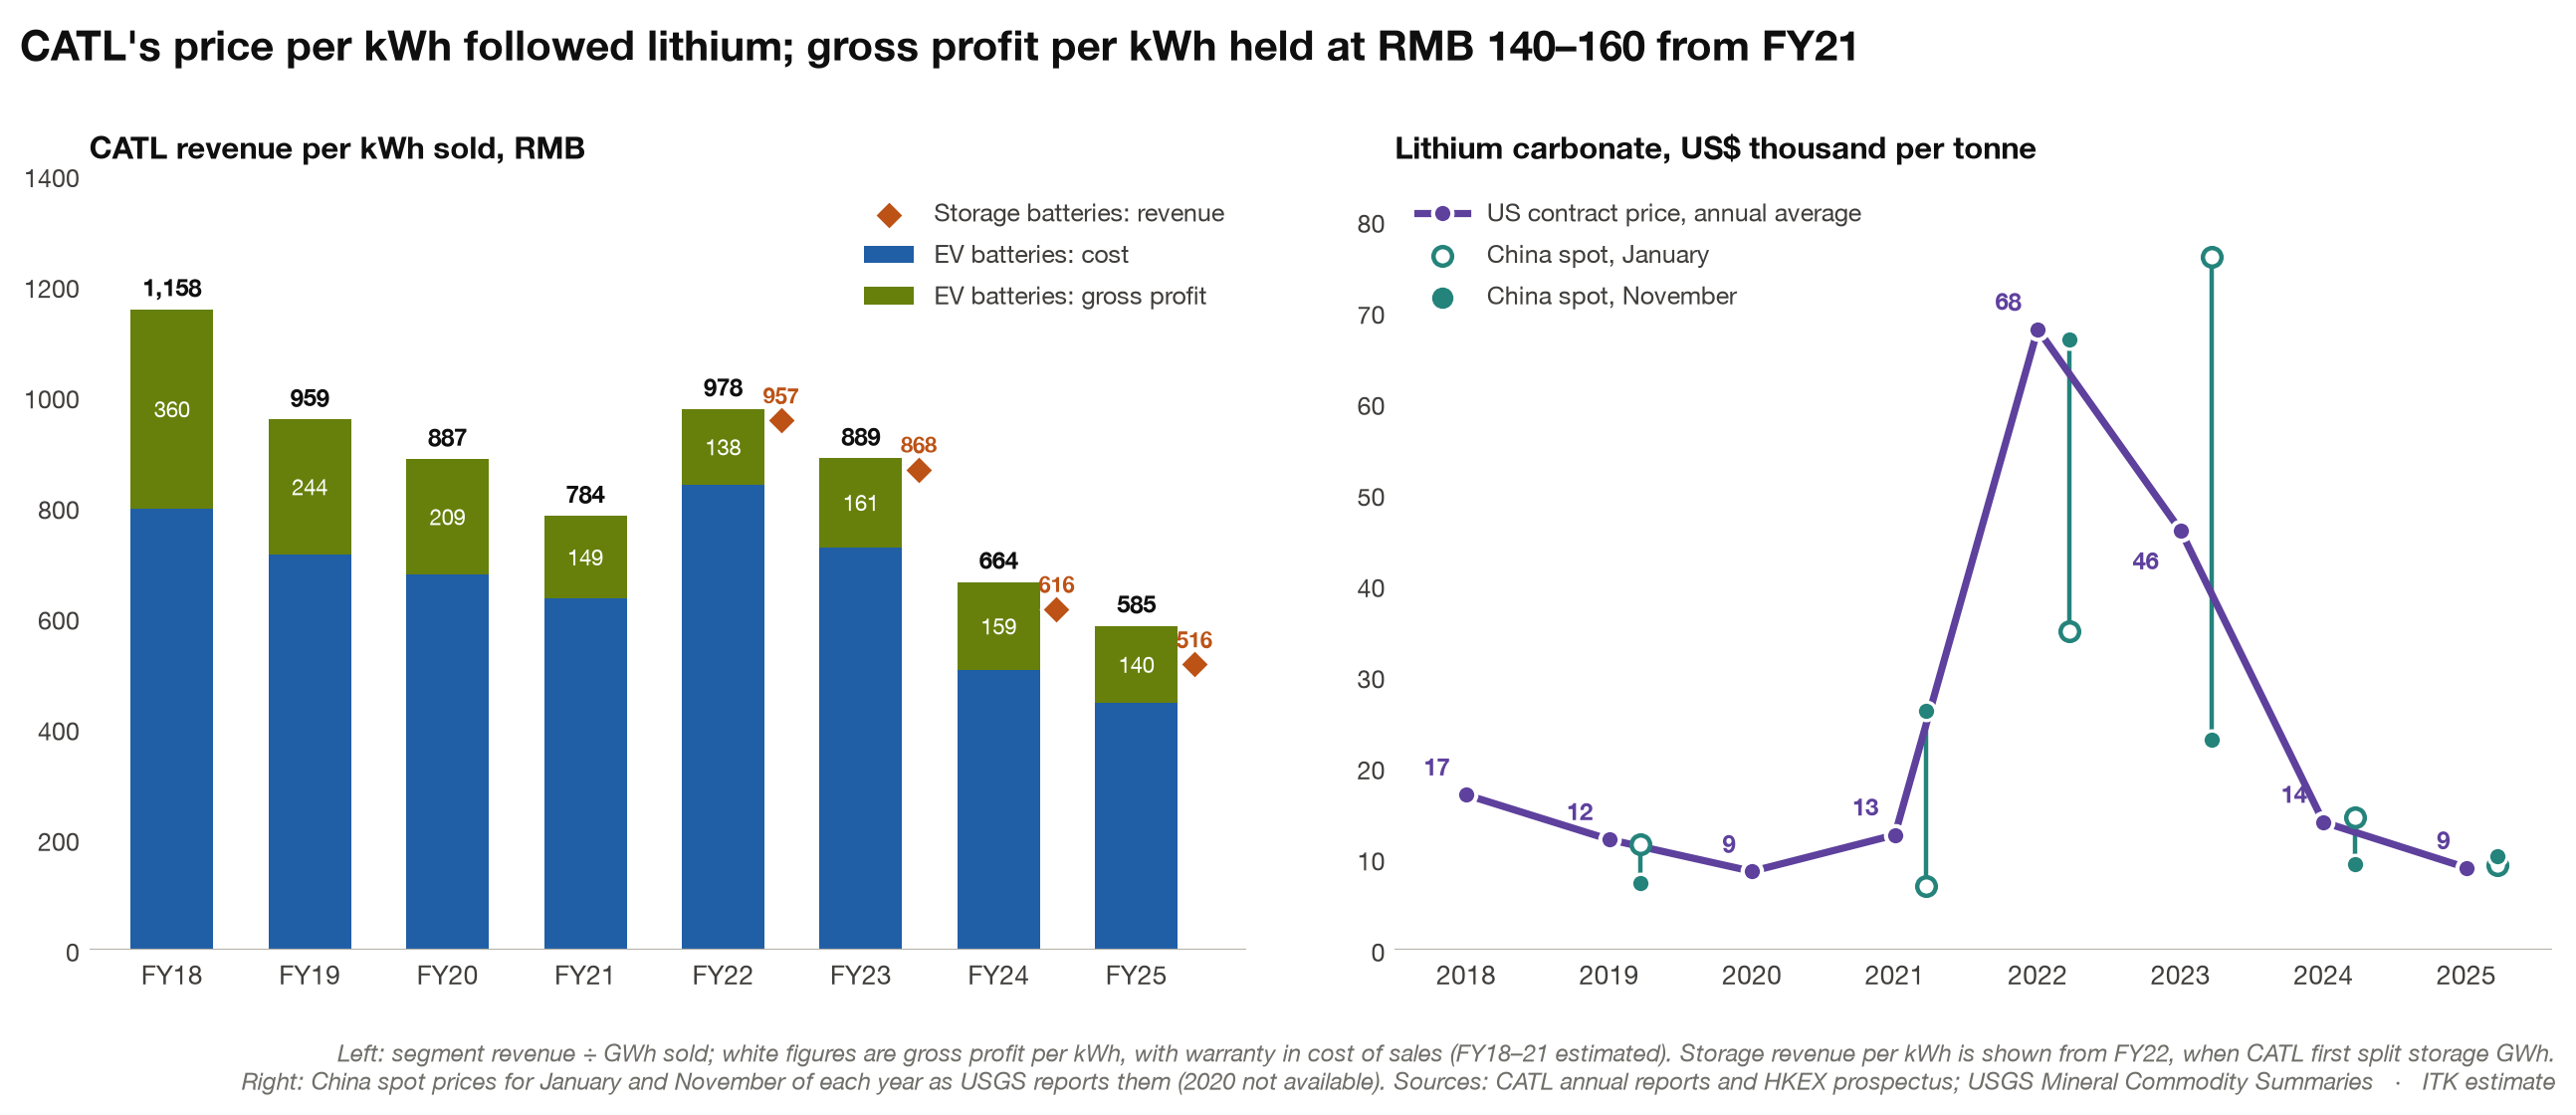
And higher volumes have compensated for lower unit gross margins and sales prices to keep the overall EBITDA margin steady.
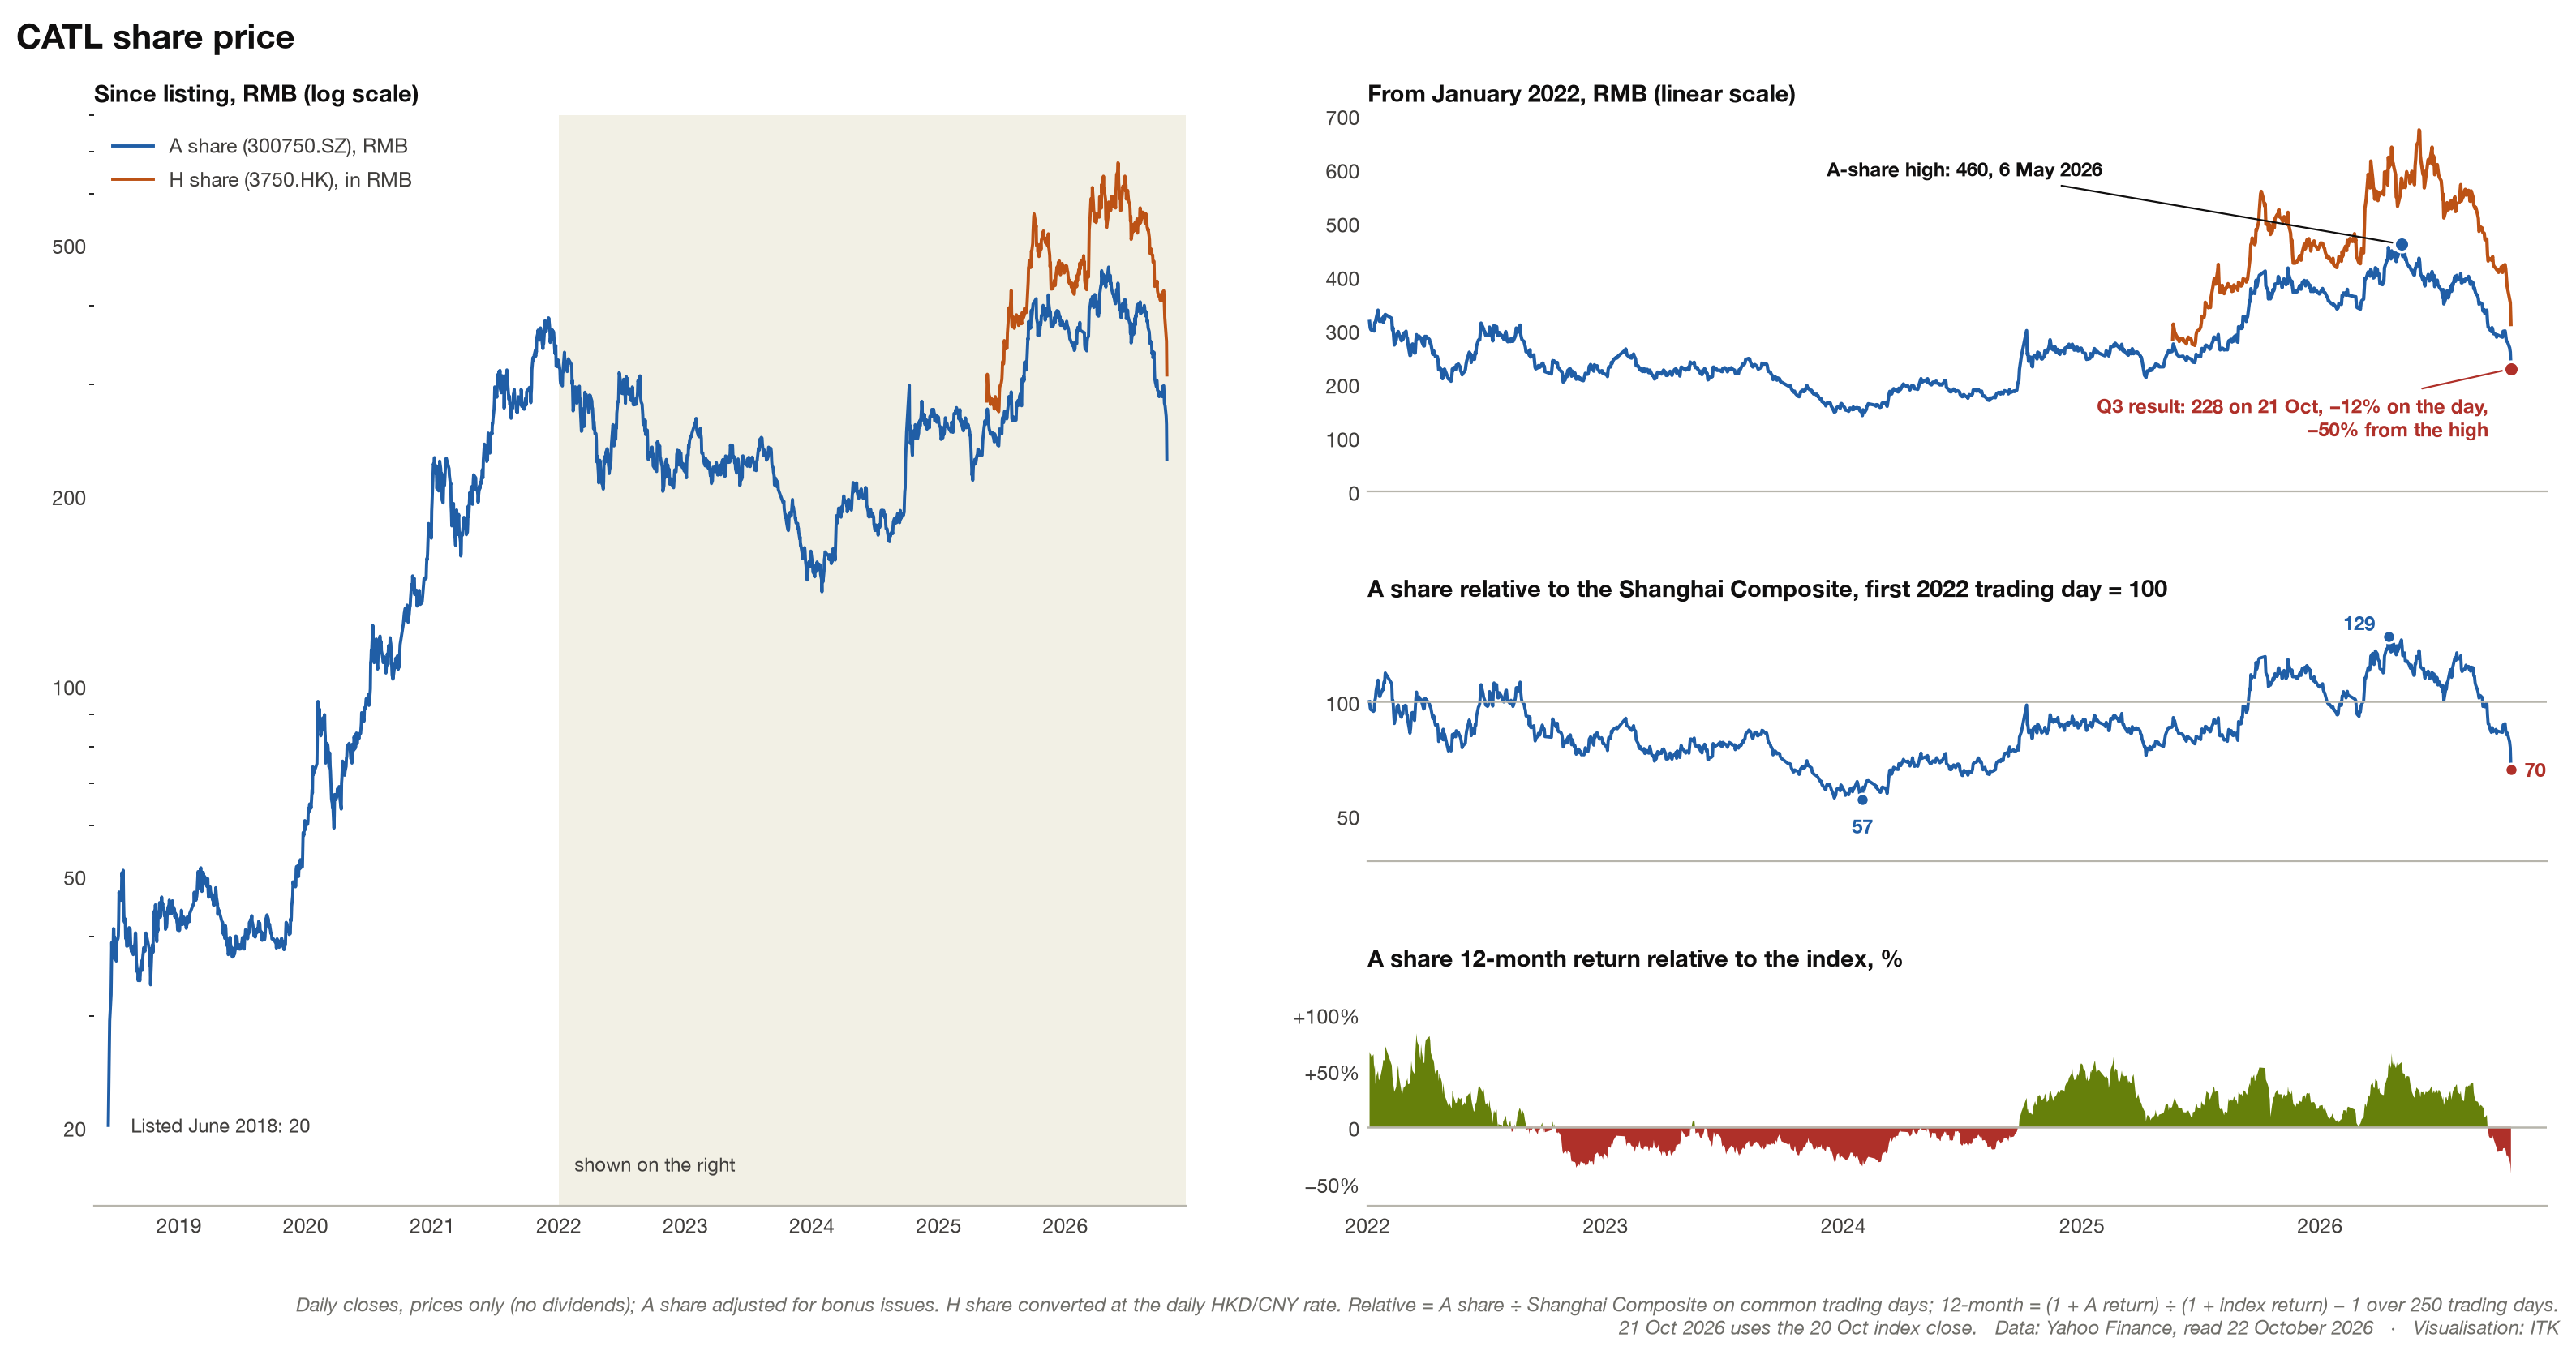
However, the Q3 2026 result just released has disappointed. Profit grew 14.5% against forecasts of about 41%, and gross margin fell to 20.7%. Commentators blamed a new 2% battery consumption tax, a cut in the export VAT rebate, and carmakers signing second suppliers, which raises the worry that CATL will lose market share. The A shares fell 12% the next day and are half their May high.
Vehicle manufacturer v cell manufacturer
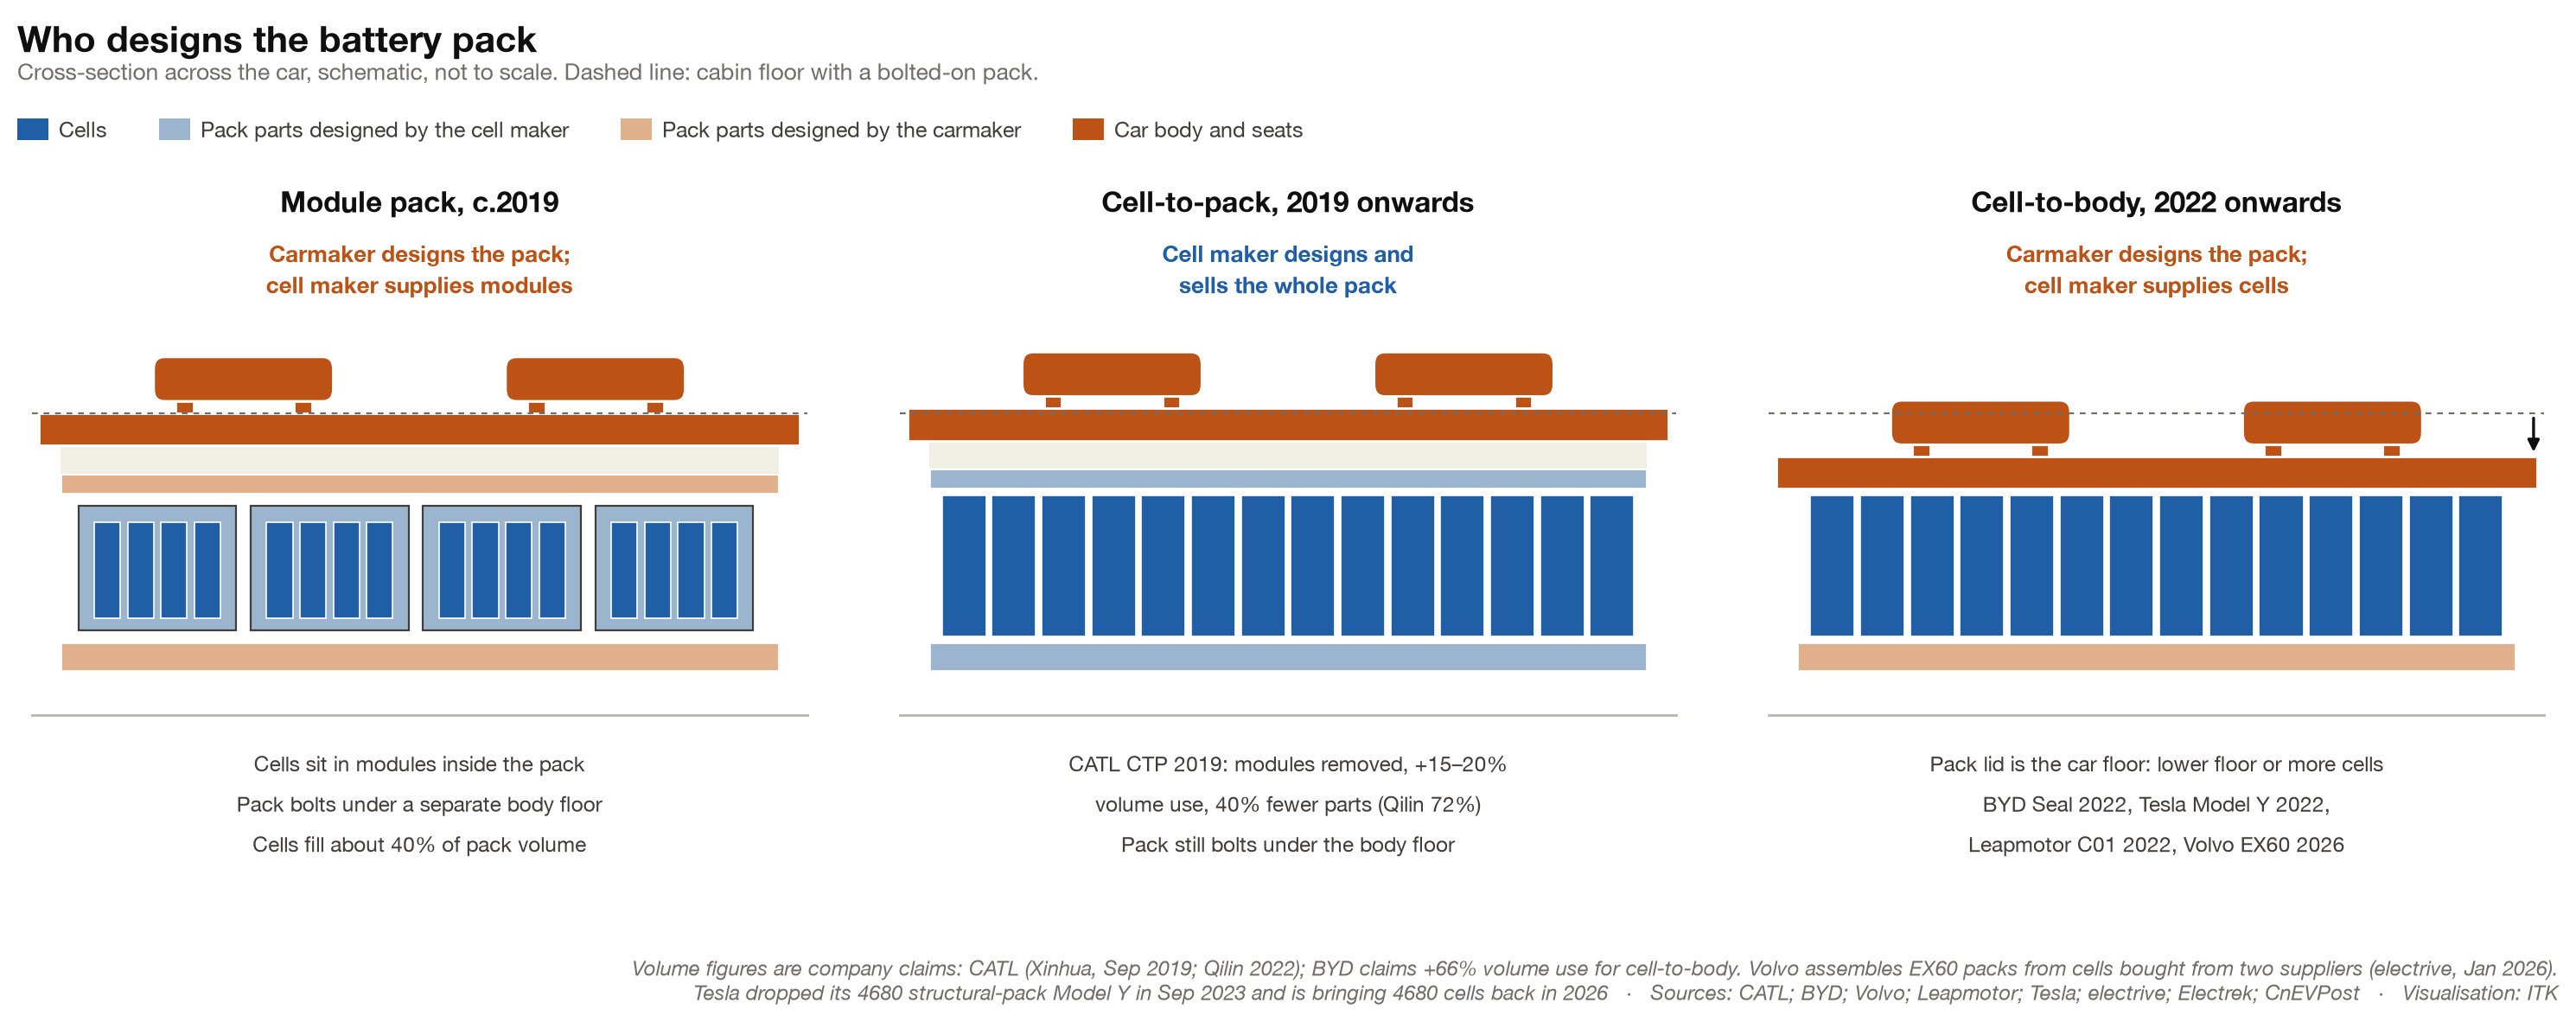
An ongoing issue is how much value does/should the cell manufacturer add? BYD is vertically integrated, but this makes its BYD blade batteries unattractive to most other car manufacturers.
In cars the industry has moved from module packs to cell-to-pack designs. The live question now is whether building the cells into the car’s structure (cell-to-body) saves enough to justify the engineering the carmaker then has to take on.
Carmakers have reasons to reduce weight and capture more value themselves. Volvo’s EX60 is an example: Volvo builds its own cell-to-body packs from cells bought from different suppliers. Rampup is reported to be slowish.
Against that, CATL has, as far as I know, a good reputation. Reputations is about the most useful asset for any business. “It just works”.
The cell/pack value add question is just as relevant in the truck industry.
Heavy trucks: about three-quarters of China’s car battery demand?
If China electrified all of its 1.1 million a year sales of 49 t trucks at 450 kWh each that’s about 500 GWh per year compared with the roughly 650 GWh a year China’s electric cars use now. At the moment based on CPCA analysis of insurance data quoted by CnEVPost September sales were 50% electric!!! Giddy up.
At the 49 t gross limit, an electric truck is about 2.5 t heavier and this translates directly into lower payload (30 t electric, 32 t diesel).
Despite this, more than 99% of electric heavy-truck batteries are LFP (EVTank).
- An NCM pack would save about 0.56 t. For a truck always loaded to its weight limit that is worth roughly RMB 27k a year, enough to pay back the roughly RMB 108k extra cell cost in about four years. But NCM cells last roughly half as many cycles, a truck battery cycles more or less every day, and many loads fill the truck’s space before its weight limit. So LFP wins.
- Rather than NCM, the response looks like the car industry’s: use the battery more efficiently and refill it faster. CATL’s new truck system pairs a swappable 432–513 kWh pack with a 77 kWh fixed reserve, so drivers can run the main pack nearly flat before swapping.
- Trucks have the same tension as cars, here in battery swapping: a swap network only works if truck makers adopt one pack standard, and whoever owns the standard captures the value. Swapping at the moment is mostly a behind the cab on the tray job. CATL wants to promote its under-the-chassis swap pack, but it has also agreed to buy 24.9% of Qiyuan, the largest truck-swap operator, which swaps from behind the cab. Even in China the swap network is still too small to cover most routes, although about 30% of electric heavy trucks sold in 2025 were swap models (第一商用车网, insurance data). My personal view is that swapping will stay strongest on short, fixed routes and remain a niche, not the main game.
- If you are a CATL supporter you can see trucks as providing a second wave of growth to the industry.
Stationary energy
This note has mostly focussed on cells and batteries for transport, but as Figure 1 shows, stationary storage is now nearly a third of the market and growing faster than EVs. On EVTank’s numbers, storage was 29% of 2025 lithium-ion shipments (652 of 2,281 GWh) and grew 76%, against 42% for EV batteries.
As usual, once a market reaches critical size but can still grow quickly, learning by doing brings costs down fast. Then we get to the “job mostly done” phase. I’m not sure where we are on that journey. BNEF’s global average price for a turnkey storage system fell from US$165/kWh in 2024 to US$117/kWh in 2025, and China was at US$73/kWh.
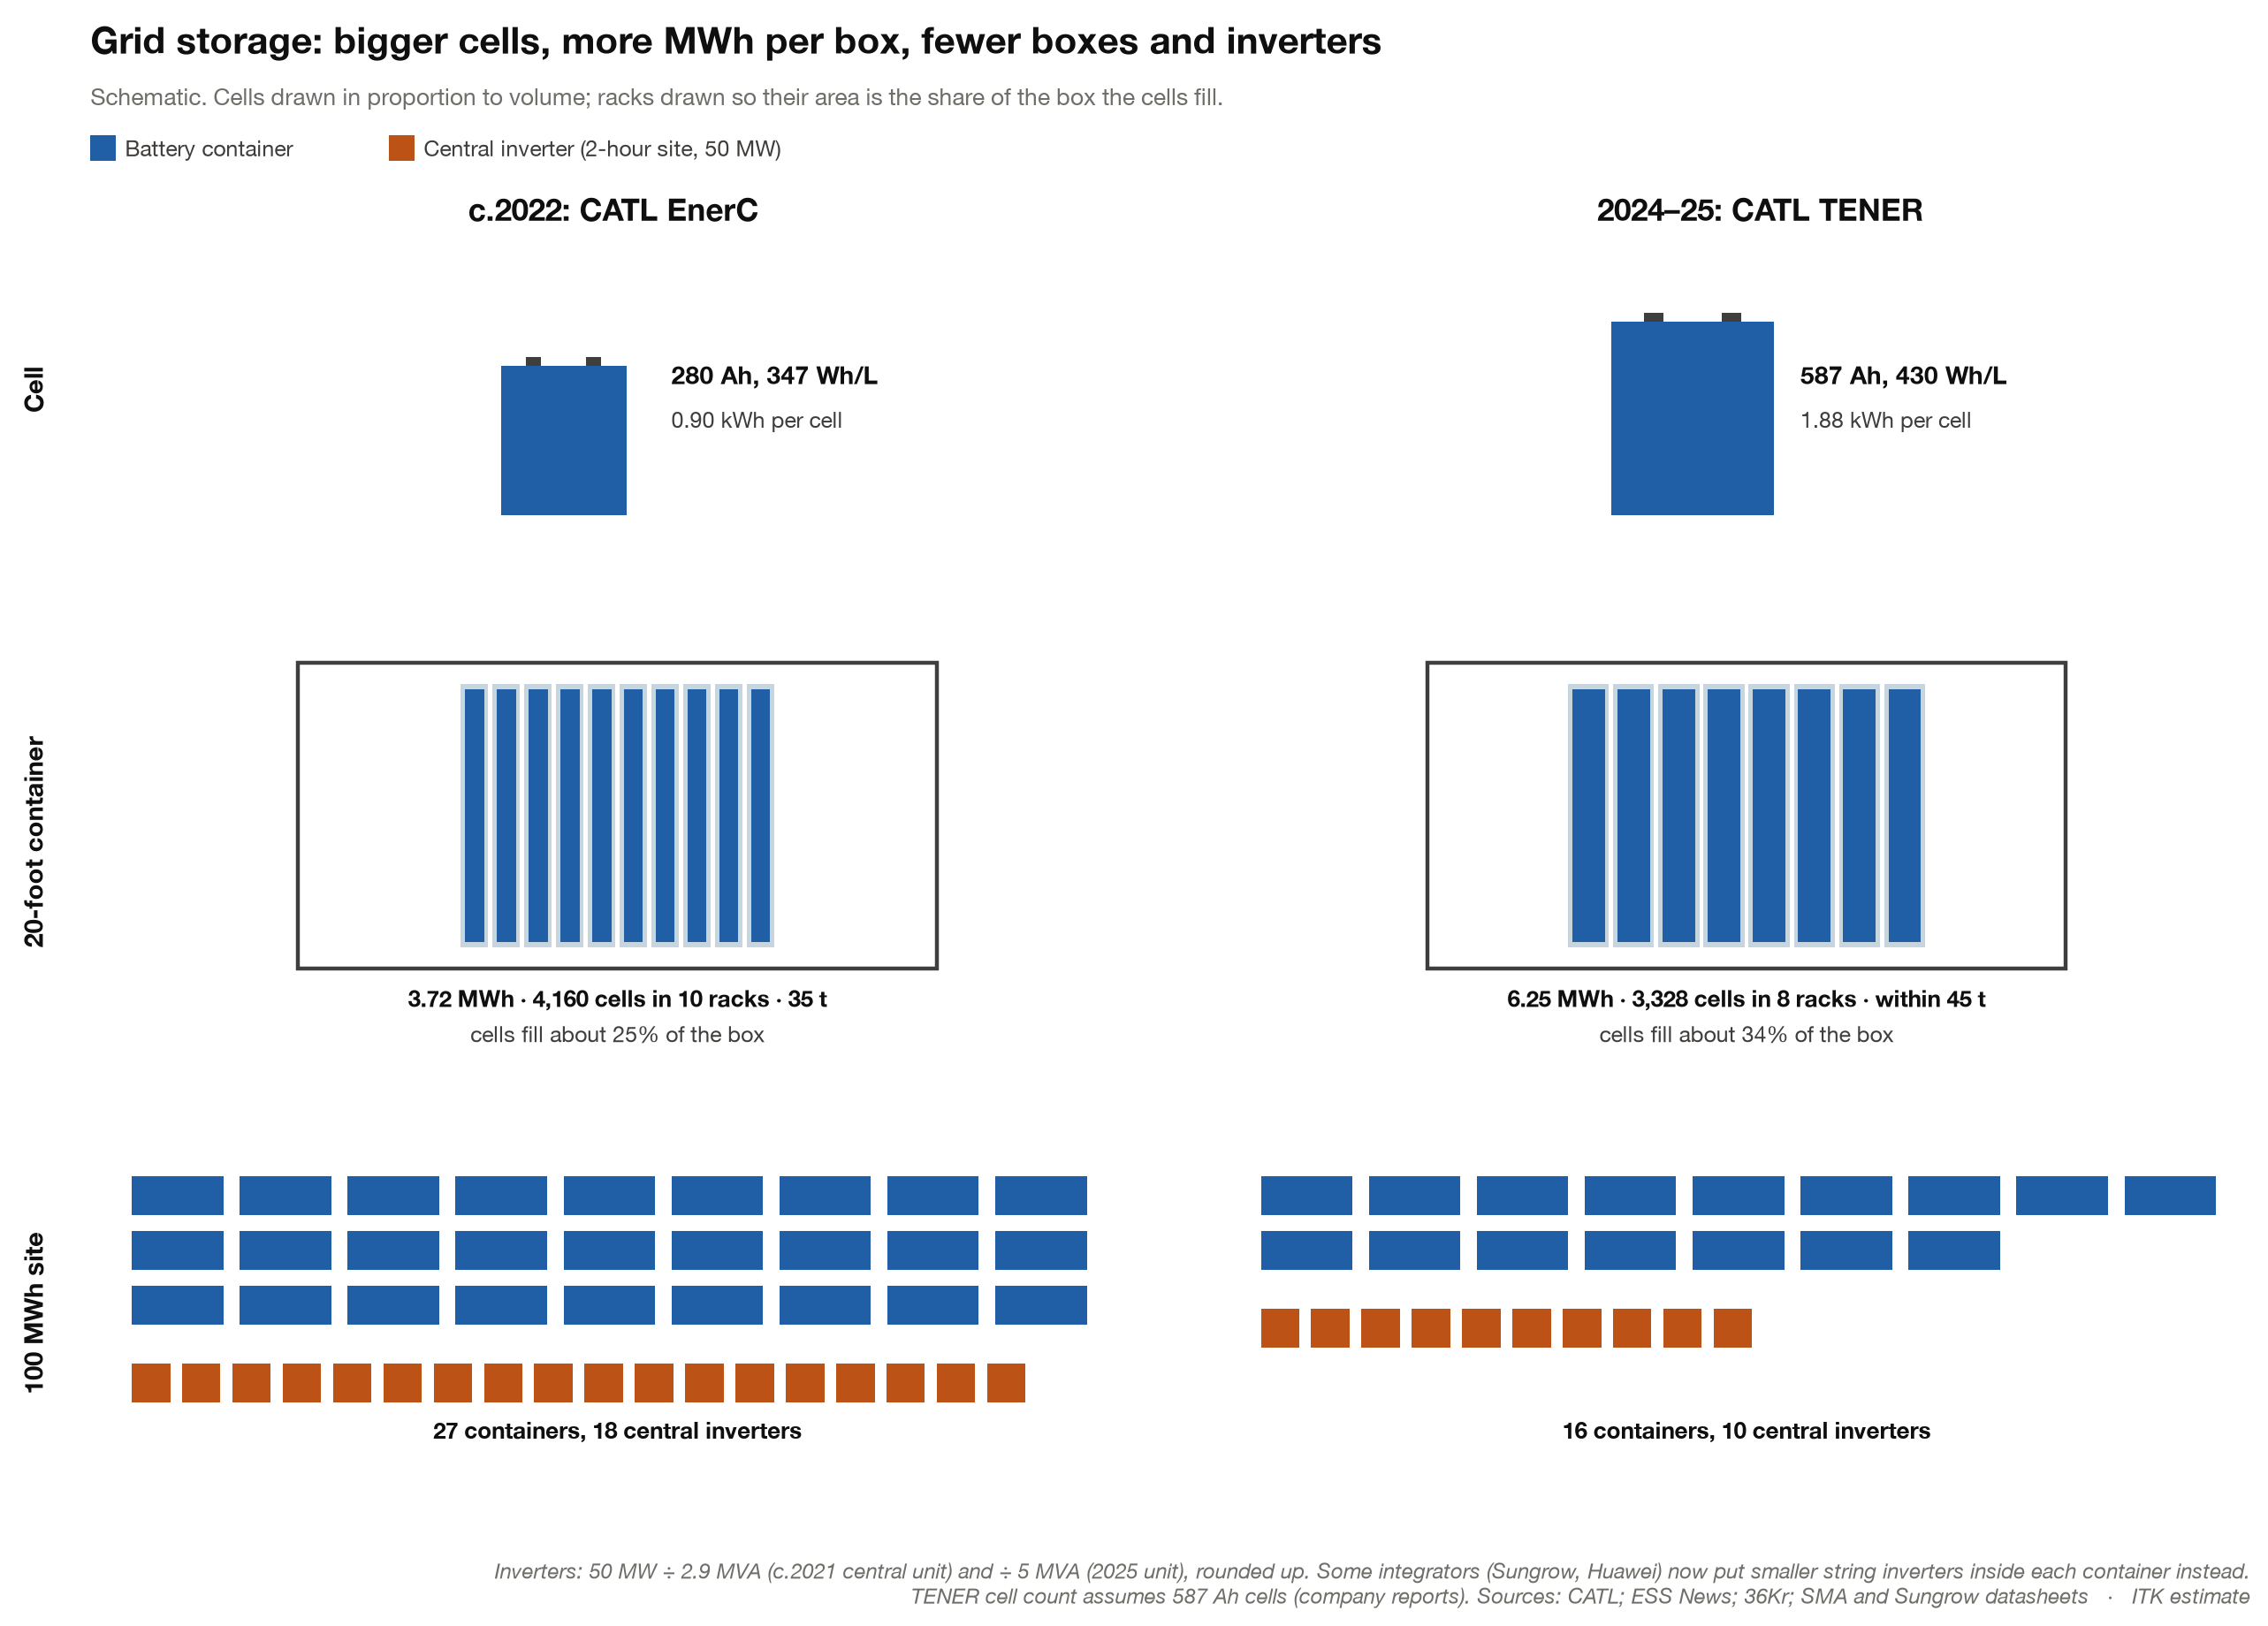
Much of the gain has come from packing, not chemistry. The storage cell has doubled in size, so a standard 20-foot container holds 6.25 MWh instead of 3.7, and a site needs fewer containers and fewer inverters (Figure 9). Weight is now the limit: a full container is around 45 t, above the 36 t many countries allow on the road.