Where to for distributors?
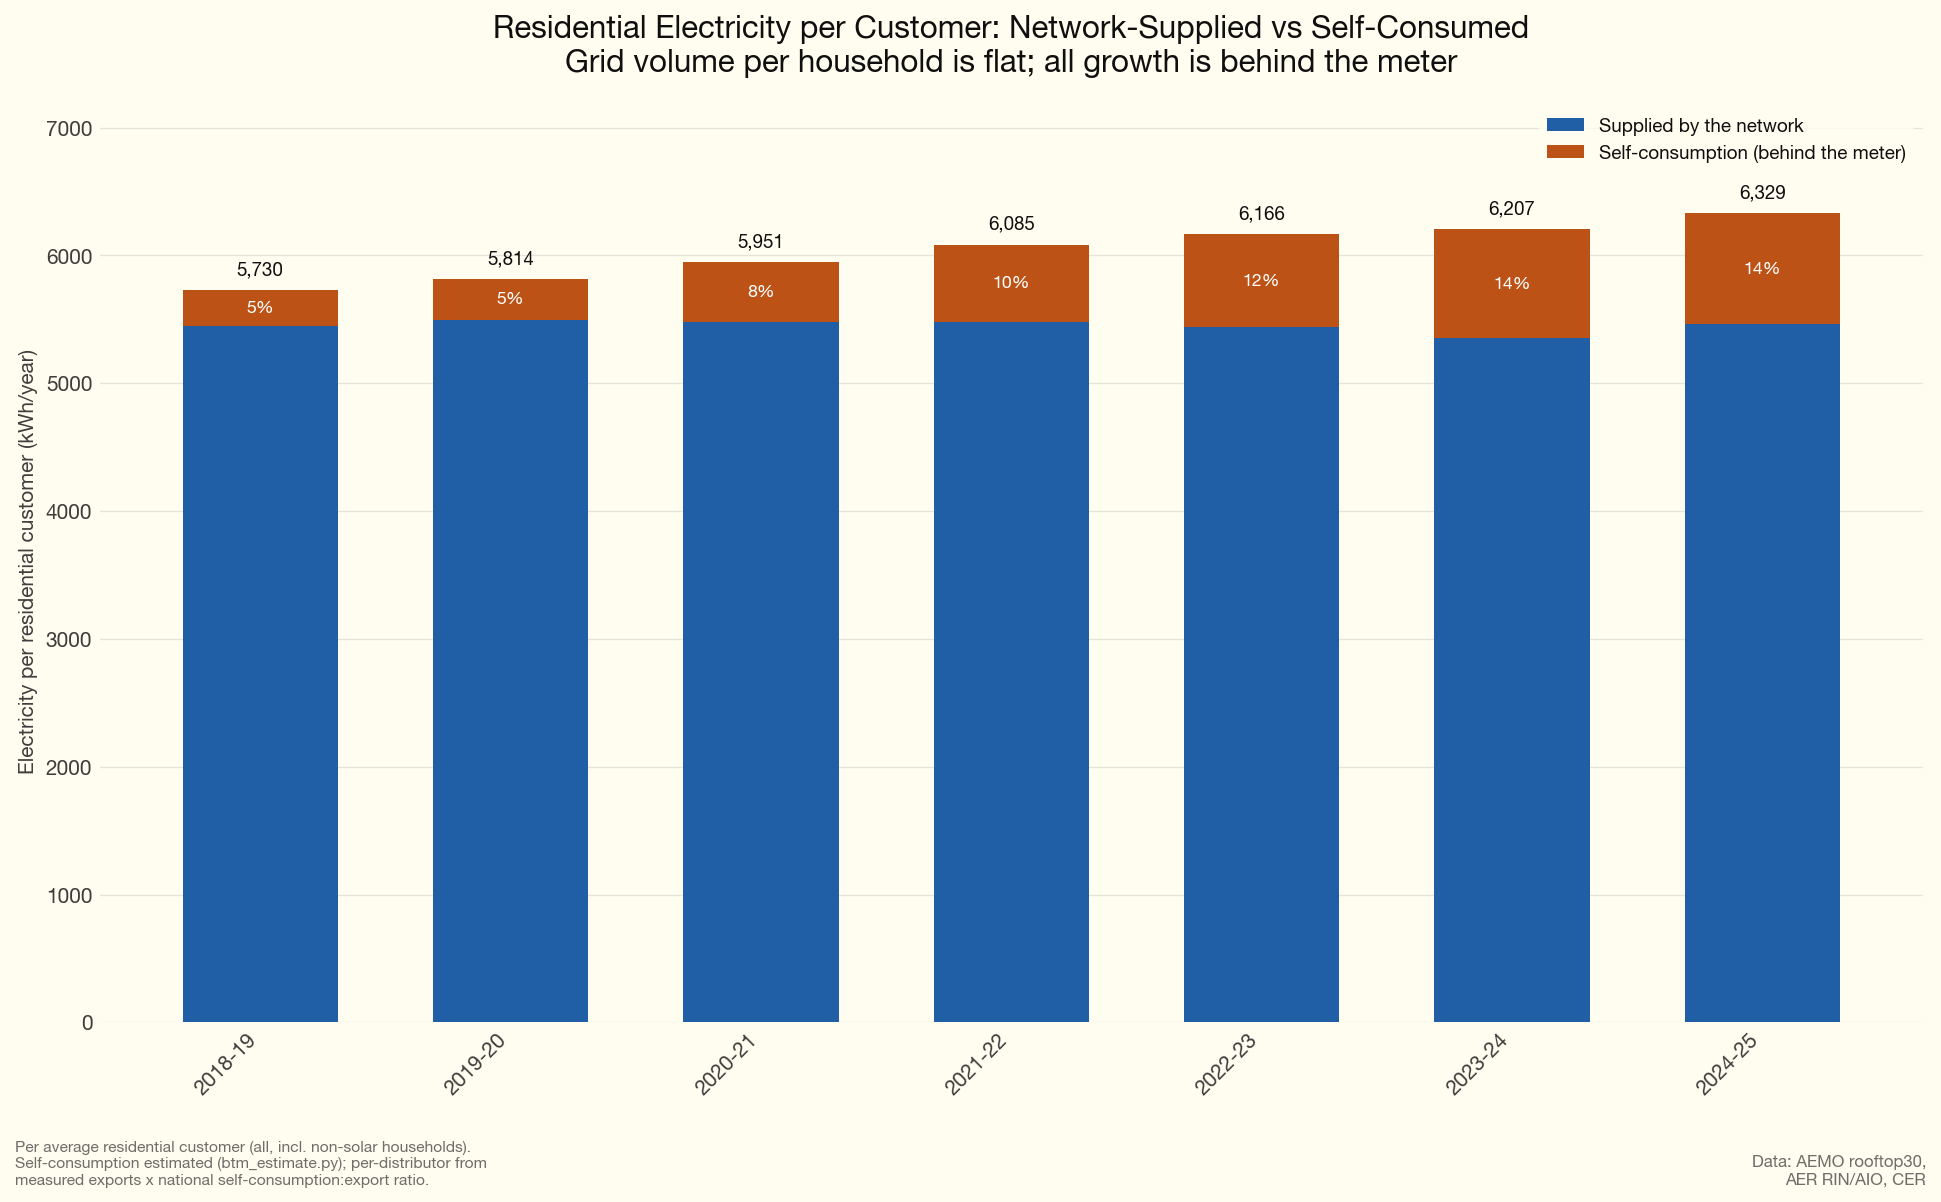
The overall message from this review is that electrification has helped to maintain network residential revenue even though all the consumer consumption growth has come from solar. See Figure 5. Non residential volumes are flat despite population growth Figure 6. Networks with datacentres do show volume growth. The shift to home batteries will keep the pressure on network volumes and therefore on the regulator to allow price rises. The AEMC seeks to change this with a shift to fixed pricing. I’m not sure how successful that shift will be. As with locational marginal pricing, community views about AEMC policy do count.
For my money the fundamental problem is that consumers, retailer and network incentives are not well aligned and indeed the system that separates monopoly from market facing retail may be more of a problem than a solution.
What is for sure is that fixed costs are already quite high in some networks, amusingly those networks also tend to have high solar penetration. Secondly current network tariffs are a dog’s breakfast. You almost feel sorry for retailers that have to work with such disparate systems, and it’s likely that the variety of network tariffs imposes measurable complexity and IT costs and probably is itself something of a barrier to retail competition. Consumer awareness of network tariffs likely requires active discovery.
It may be that the forthcoming “role of networks” review or whatever the AEMC calls it may provide some answers to what at the moment look like difficult problems. But I’m not confident. In my opinion networks should be incentivised or forced to encourage competition at every level. It should be easy for a private sector to attach a large battery, to put street level chargers in, to compete for substation maintenance. Do networks exhibit economies of scale or scope? Is the USA integrated geographic franchise superior to the monopoly/market facing model in Australia?
Ultimately what are the policies that will enable us to decarbonise at pace with intergenerational equity considered as carefully as intra generational?
Data and issues
Recently the AER released its annual performance review of electricity and gas distribution covering the period to June 2025. That seemed like an appropriate time to update my own data.
The AER requires each distributor to provide an Annual Information Order (the replacement for the Regulatory Information Notice, or RIN) covering detailed physical stocks and flows and also financial data. In addition I have now worked out the AER also publishes a spreadsheet with every distributor’s tariff plans.
In 2025 the AER required distribution businesses to report their statutory P&Ls. Previously Ausgrid, for instance, did not release its financial results despite being 49% owned by the NSW Government.
Unfortunately the data remains awkward to work with. Distributors mislabel data, units change from GWh to MWh, Ausnet did not include its statutory results, and everything arrives as an annual spreadsheet. The tariff plans have misspellings and different labels for the same data.
If I had recommendations for the AER, they would include:
- If all the industry is talking about the move to fixed costs for residential users then the AER should be collecting such data. At the moment it only requires distributors to show their fixed cost revenue from all sources. I was able to closely approximate this metric using the tariff plans but it was hard work.
- The AER no doubt is full of lawyers and economists but I have to wonder if there is anyone that knows how to use a computer? :-) The RIN/Information data should be collected into a proper database that users can interrogate. That would force a data cleansing along the way. The easier the data is to access and analyse, the better the quality of the resulting consensus and decisions. These days the entire job could be done in less than a week, user interface and all.
- On a wish list I’d like to see some data on the number of ev chargers in a distributor network including the number of low voltage street level chargers. For me transport electrification is a national priority and the role of distributors needs to be quantified and measured regularly.
In what follows I combine some of the AER’s own reporting/analysis with some of my own additional plots. Although there are various insights the history does not provide an obvious way forward for distributors.
Are fixed charges really a good answer?
- There is less need for networks to perform their traditional role than there used to be, although per household consumption has been growing, consumers produce the increase themselves and going forward will also export a smaller share of their production. As a result the AEMC wants network costs recovered through a charge per connection rather than per kilowatt hour — what its final report calls a shared network access charge. It has not set a target. The final report specifies no level, cap or floor at all, and the 80% figure that has attached itself to this debate comes from the AEMC’s own distributional modelling, not from its recommendation. In any case the AEMC cannot implement this itself but only await a rule change request.
- Monopoly regulation tends to incentivise gaming.
- There is no such thing as a “cost reflective tariff” and the AEMC move towards fixed pricing over ten years with vague undefined categories of fixed price effectively acknowledges this. The AEMC also says that savings will come from “dynamic pricing” such a quaint term to use for networks. That’s a red herring. Dynamic pricing is a fairly absurd concept only relevant when constraints emerge and the evidence shows that individual peaks have little to do with system peaks. The fixed price shift by contrast is entirely distributional in its intent. And 80% fixed recovery, a modelling assumption rather than a target, as usual sounds “better” at a high level than when you get into the detail. Do you really want a large consumer with no solar paying the same price to be connected as a pensioner? Such issues are waved off to the AER. The AER itself put forward some hesitant objections.
- At the broadest view network tariffs, in my view, should reflect the desired societal outcome. Fairness to current consumers is only one dimension. Decarbonisation is another, it provides fairness to future generations. Fairness to consumers also extends to fairness in consumer relations with networks, and specifically that tariff policy consider network behavioural incentives. The AER waves this away to a subsequent review.
- The data supports a view that electrification policy is working for households but not for business. Per household consumption appears to be increasing on the numbers. This requires an estimate of behind the meter self consumption. But non residential consumption is growing mostly at networks with data centres. The overall outcome for non residential volumes is poor.
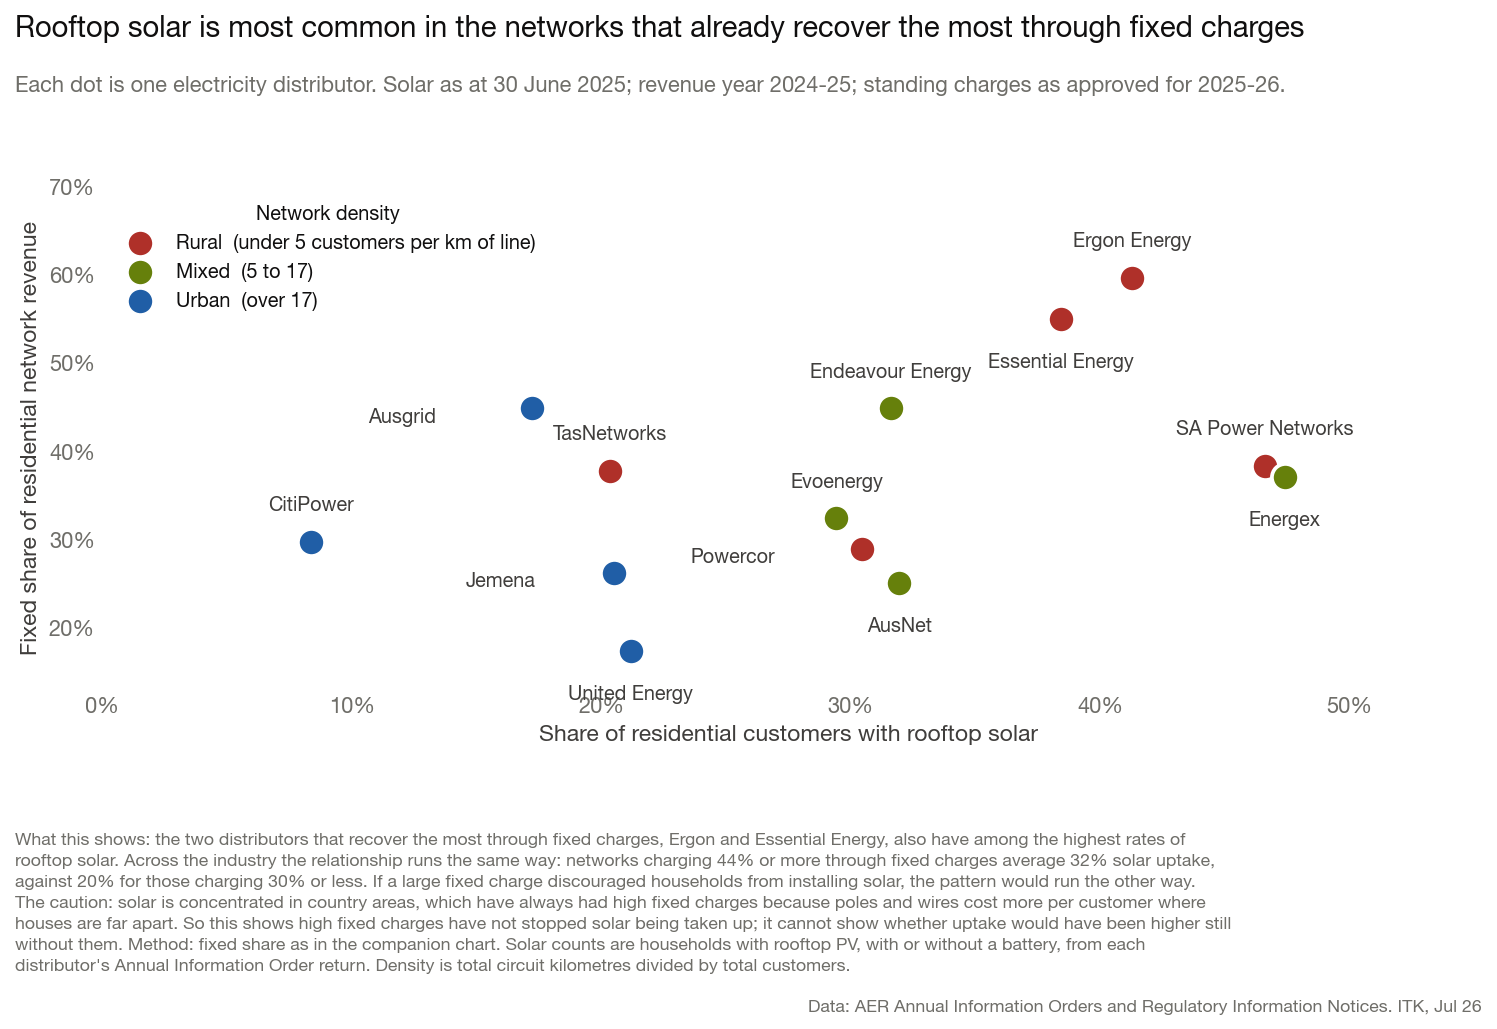
- On the other side of the ledger it’s not clear that fixed costs to date have had much impact on solar connections. Or if they have the impact has been outweighed by other considerations. Broadly speaking networks like Ergon that already have a high proportion of charges fixed also have the highest proportion of solar customers. It took a lot of thinking and work to get Figure 1.
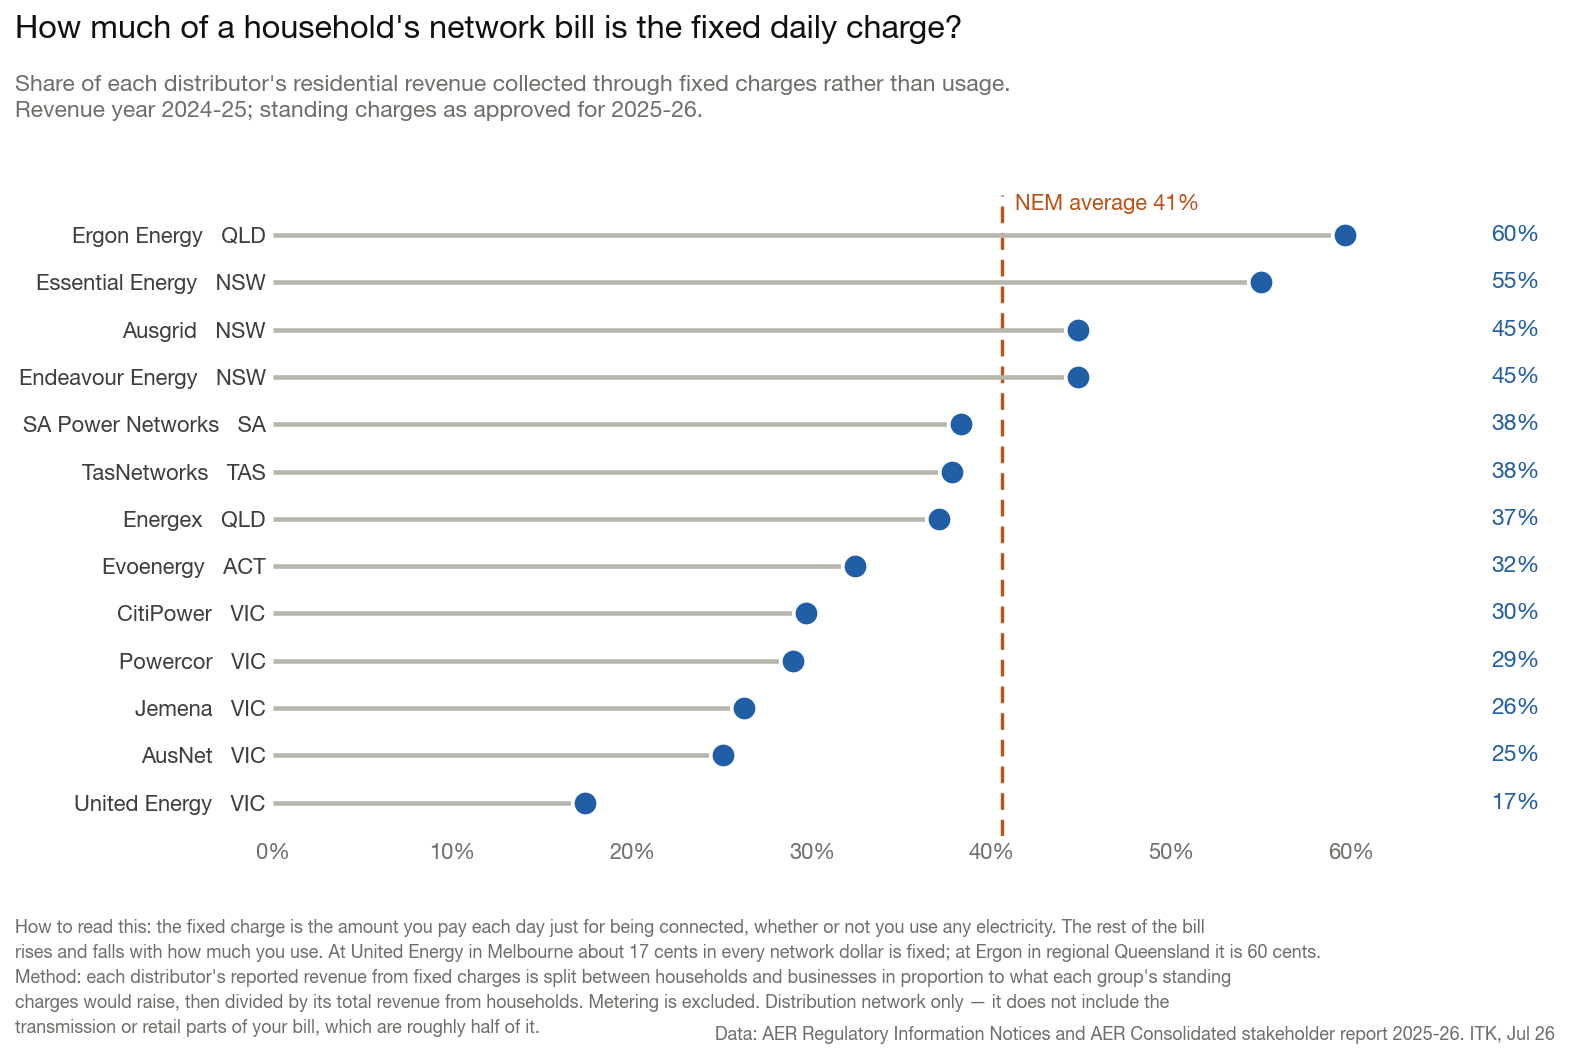
What is interesting is that fixed costs, once you back out metering, are already a big part of residential revenue at some networks and not at others — 17% at United Energy against 60% at Ergon, and 41% across the NEM (Figure 2). Therefore the pricing shift will affect some consumers far more than others.
And then there is the question of the retailer role, after all consumers don’t contract with distributors and distributors don’t set consumer prices. Retailers do that job.
In any event right now network pricing to customers is all over the shop, showing I don’t know what. A big mess would be one way to put it. Consider Figure 3.
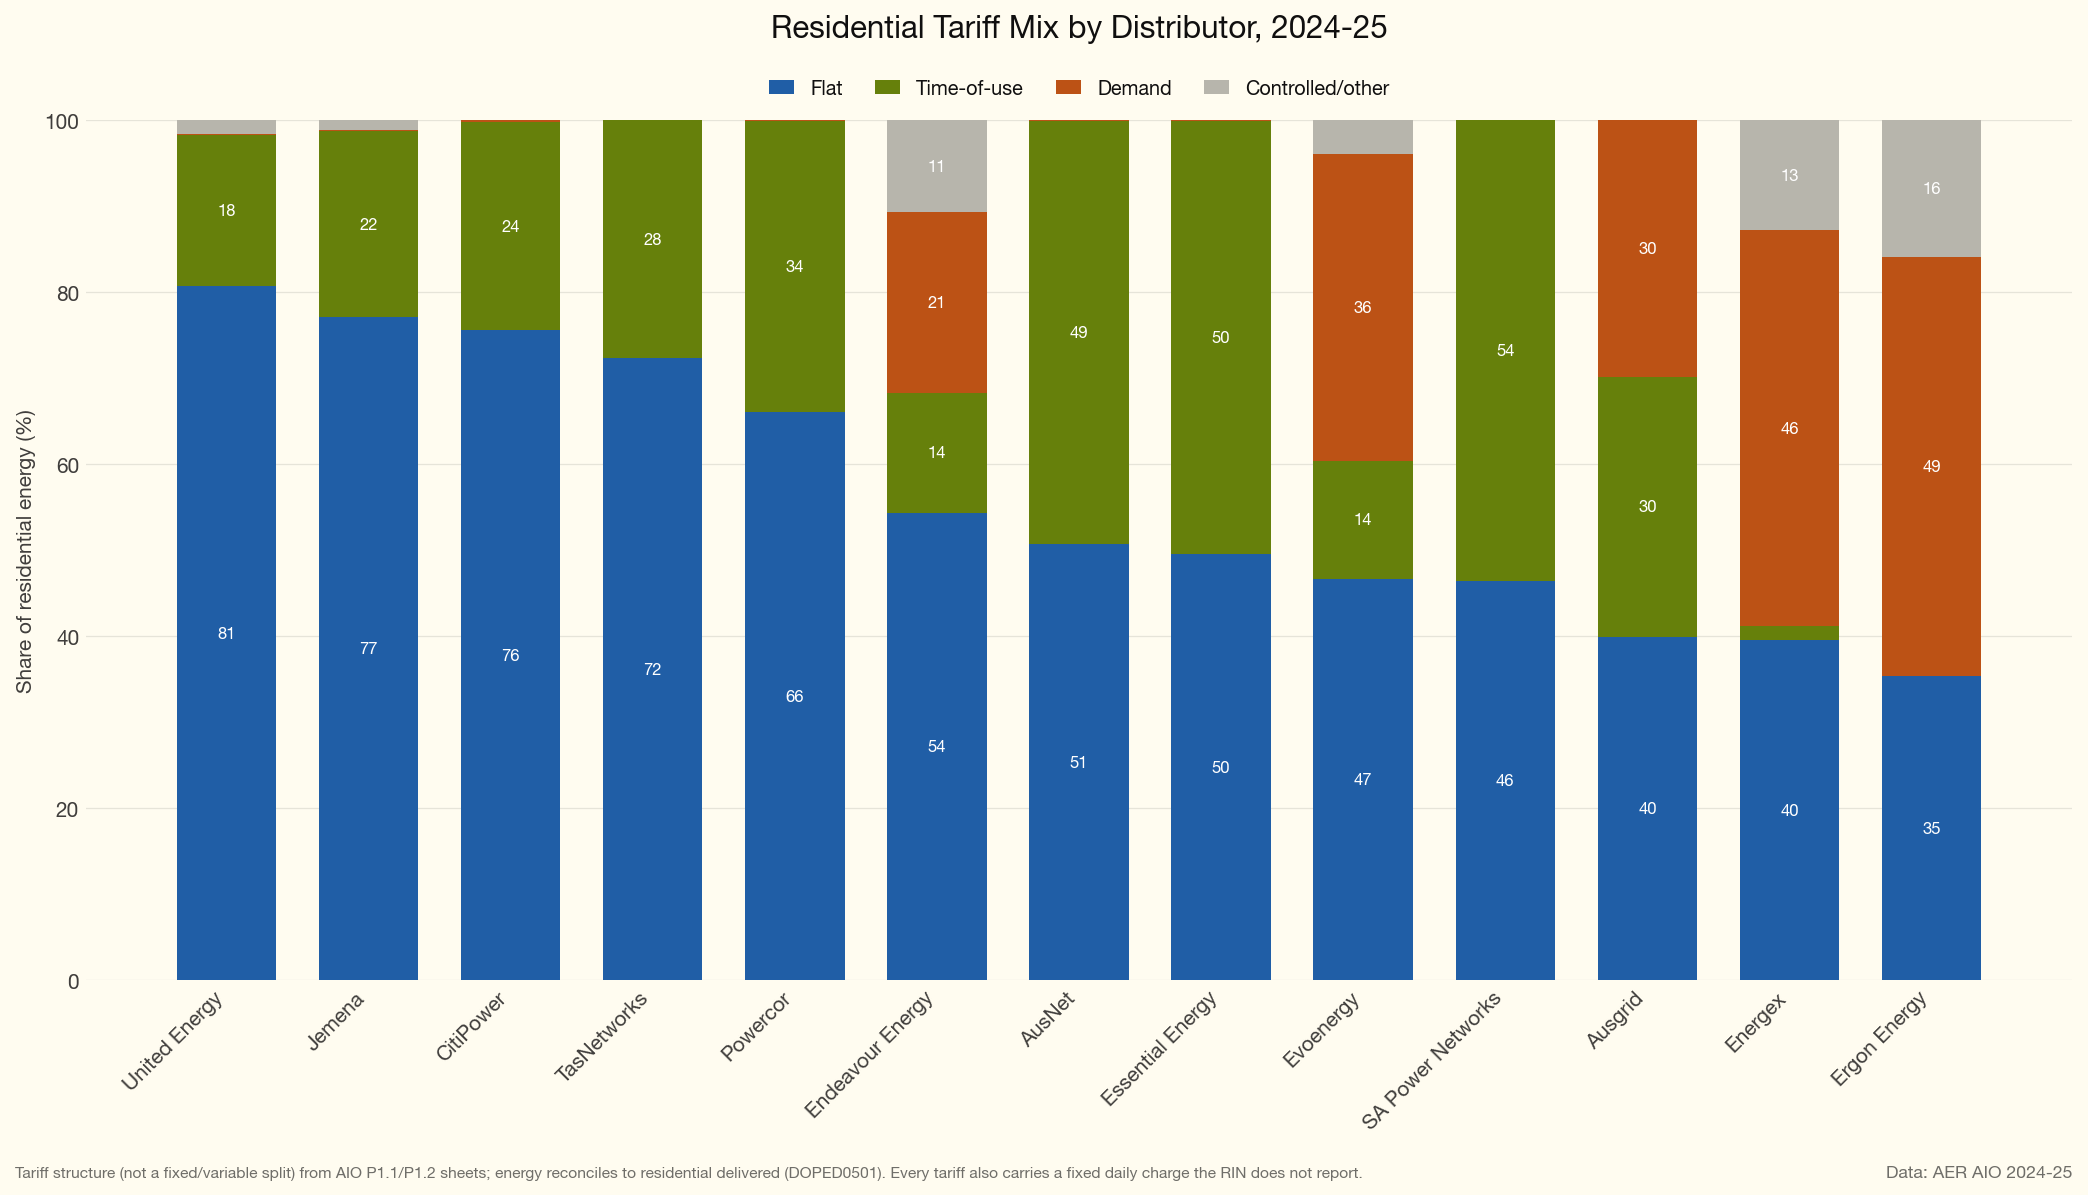
But of all tariff structures, demand based tariffs set on the household’s own peak are, in my opinion, the least fair and provide the worst signal. So it comes as no surprise that is the structure adopted in Queensland.
Consider Figure 4. It shows that per customer maximum demand has been essentially flat compared with 2019, having recovered from the Covid years, and despite per customer energy growth. Household batteries will almost certainly reinforce this.
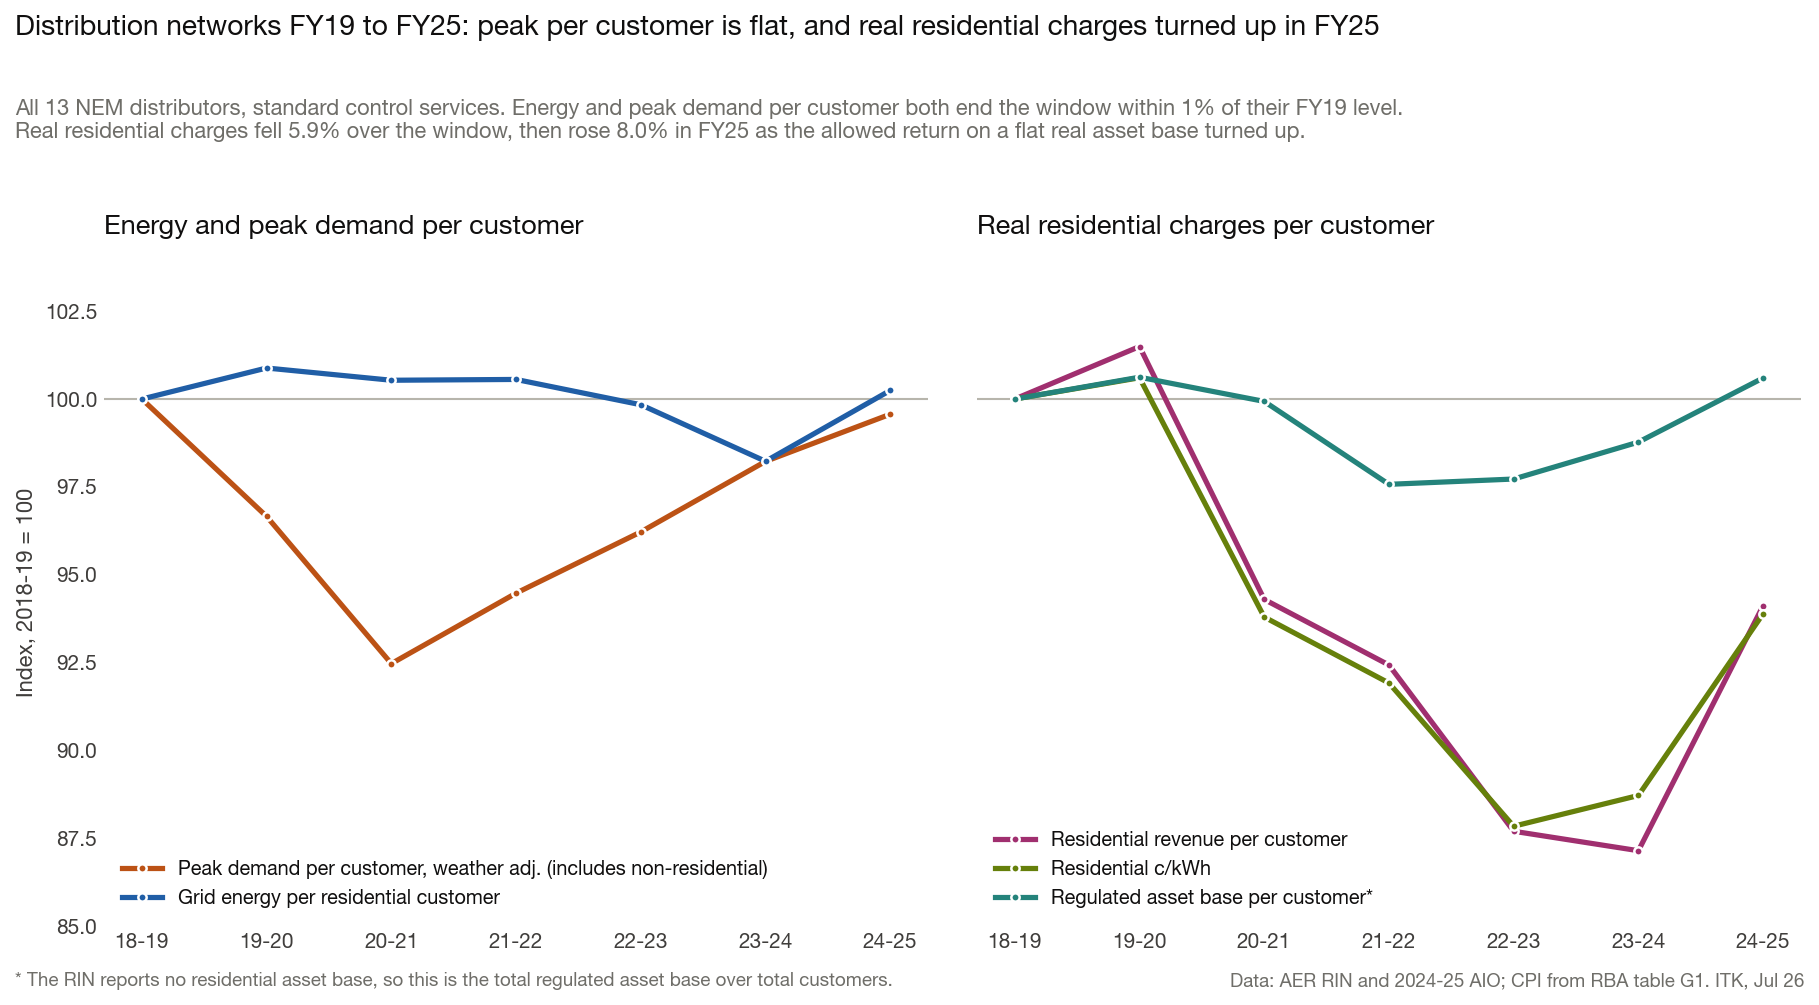
The plot also shows per customer prices are down in real terms, although now recovering, but that in real terms, per customer RAB is essentially flat.
Flat tariffs dominate across the industry, and of course a fixed cost of connection is equivalent to a flat tariff. That they dominate in Victoria, the only State to have mandated time of use meters, is an example of the irony with which one becomes familiar in electricity, and which would have Joseph Heller writing a sequel to Catch 22.
Outside Victoria about 60% of customers had a smart meter by 30 June 2025, so the metering constraint on time-of-use tariffs is fading.
Households are using more electricity. Residential is electrifying
Using my modified, estimated, solar self consumption series (see Appendix A) one can conclude that consumers are on average using more electricity. Heat pumps, air con, electric cars etc. Figure 5 is a contrast to the non-residential data.
On these numbers consumption per household is up more than 10% since 2018-19. Household batteries should accentuate that but I doubt if the impact will be fully visible before FY27 and so we won’t see the answer in this data set until 2028.
Non-residential volumes are not growing
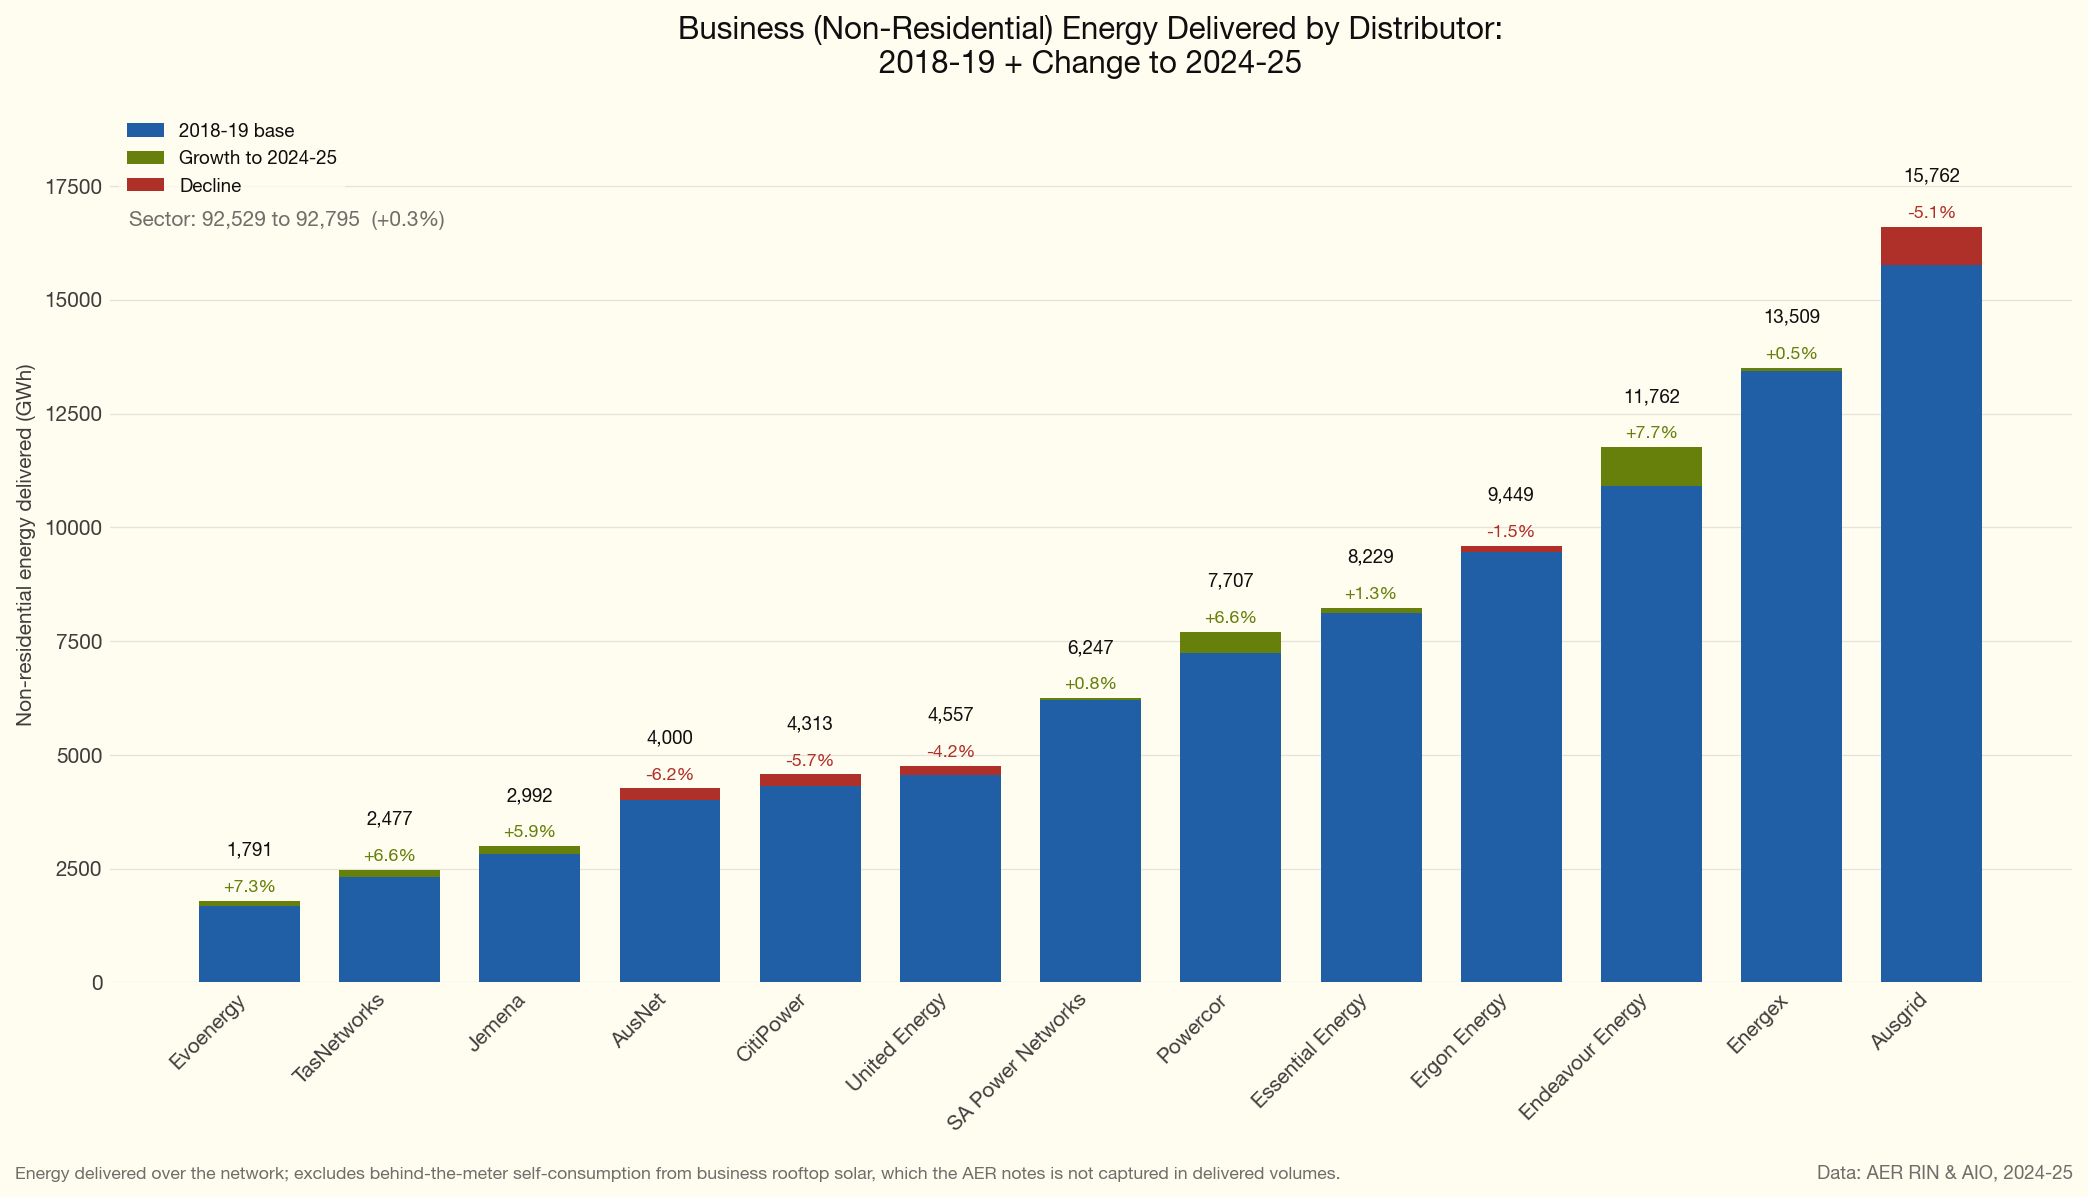
Other than Endeavour Energy and Powercor, non-residential volumes have been flat to down at every large distributor over the past six years. Evoenergy, TasNetworks and Jemena also grew, but off small bases. Although data centres now tend to be connected to transmission as much as distribution, the major Sydney connection area around Eastern Creek in Western Sydney is in the Endeavour distribution area. In Melbourne the data centres are in the Deer Park area and that is mostly in the Powercor distribution area. So in short I tend to think that the only distributors with non-residential volume growth are those with large data centres (Figure 6).
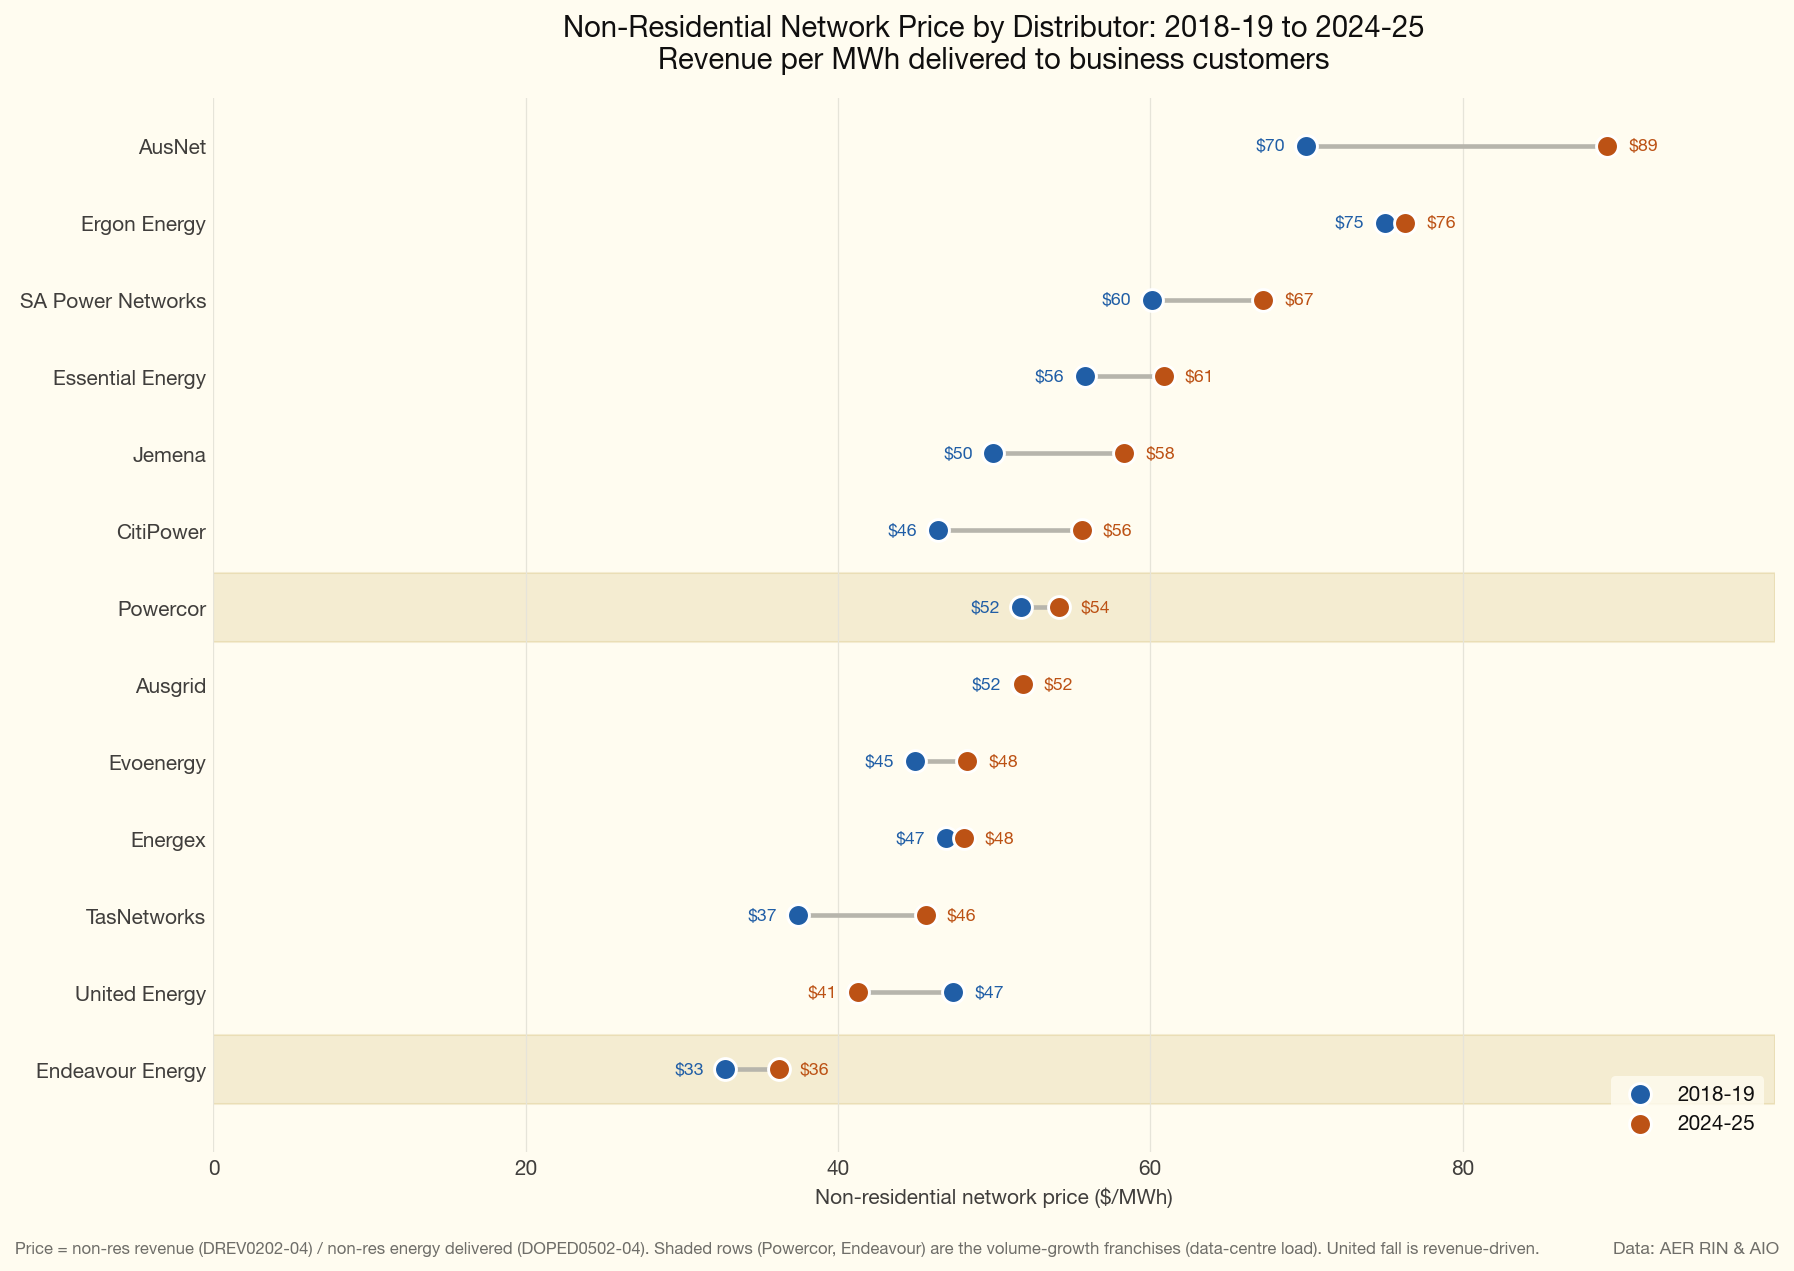
At the moment there is not enough evidence to say that the higher volume growth of Powercor and Endeavour has led to a lower rate of increase in grid costs to non-residential users — the small sample gives mixed support. What you can say is that both Powercor and Endeavour have been able to keep their price increases down, rising by less than inflation (Figure 7).
Substation capacity, “cost reflective”,“dynamic pricing”
I still don’t think the AER’s public position reflects some of the underlying reality. For instance the AER talks about cost reflective tariffs. But in fact there is basically no such thing, as I’ve written several times. The vast majority of distributor cost is the cost of the installed wires, poles and substations. Once installed that capex is entirely invariant to volume. As the AER itself shows (Figure 8), substation utilisation is way below the level where demand based tariffs have any system wide signal. In addition the APVI showed 10 years ago that a household’s own maximum demand and its demand at the time of system peak are different things.1 In 2016 at least at Blacktown 49% of households had their annual peak in winter and 28% in summer, while the network peak is in summer. So what is the point of a demand tariff levied on the household’s own peak? Time of use is, in my opinion, a better approach because it covers a window and is more under consumer long term control.
All of that concerns maximum demand and the capacity to import. It says nothing about the export side but I expect household batteries to mitigate that.
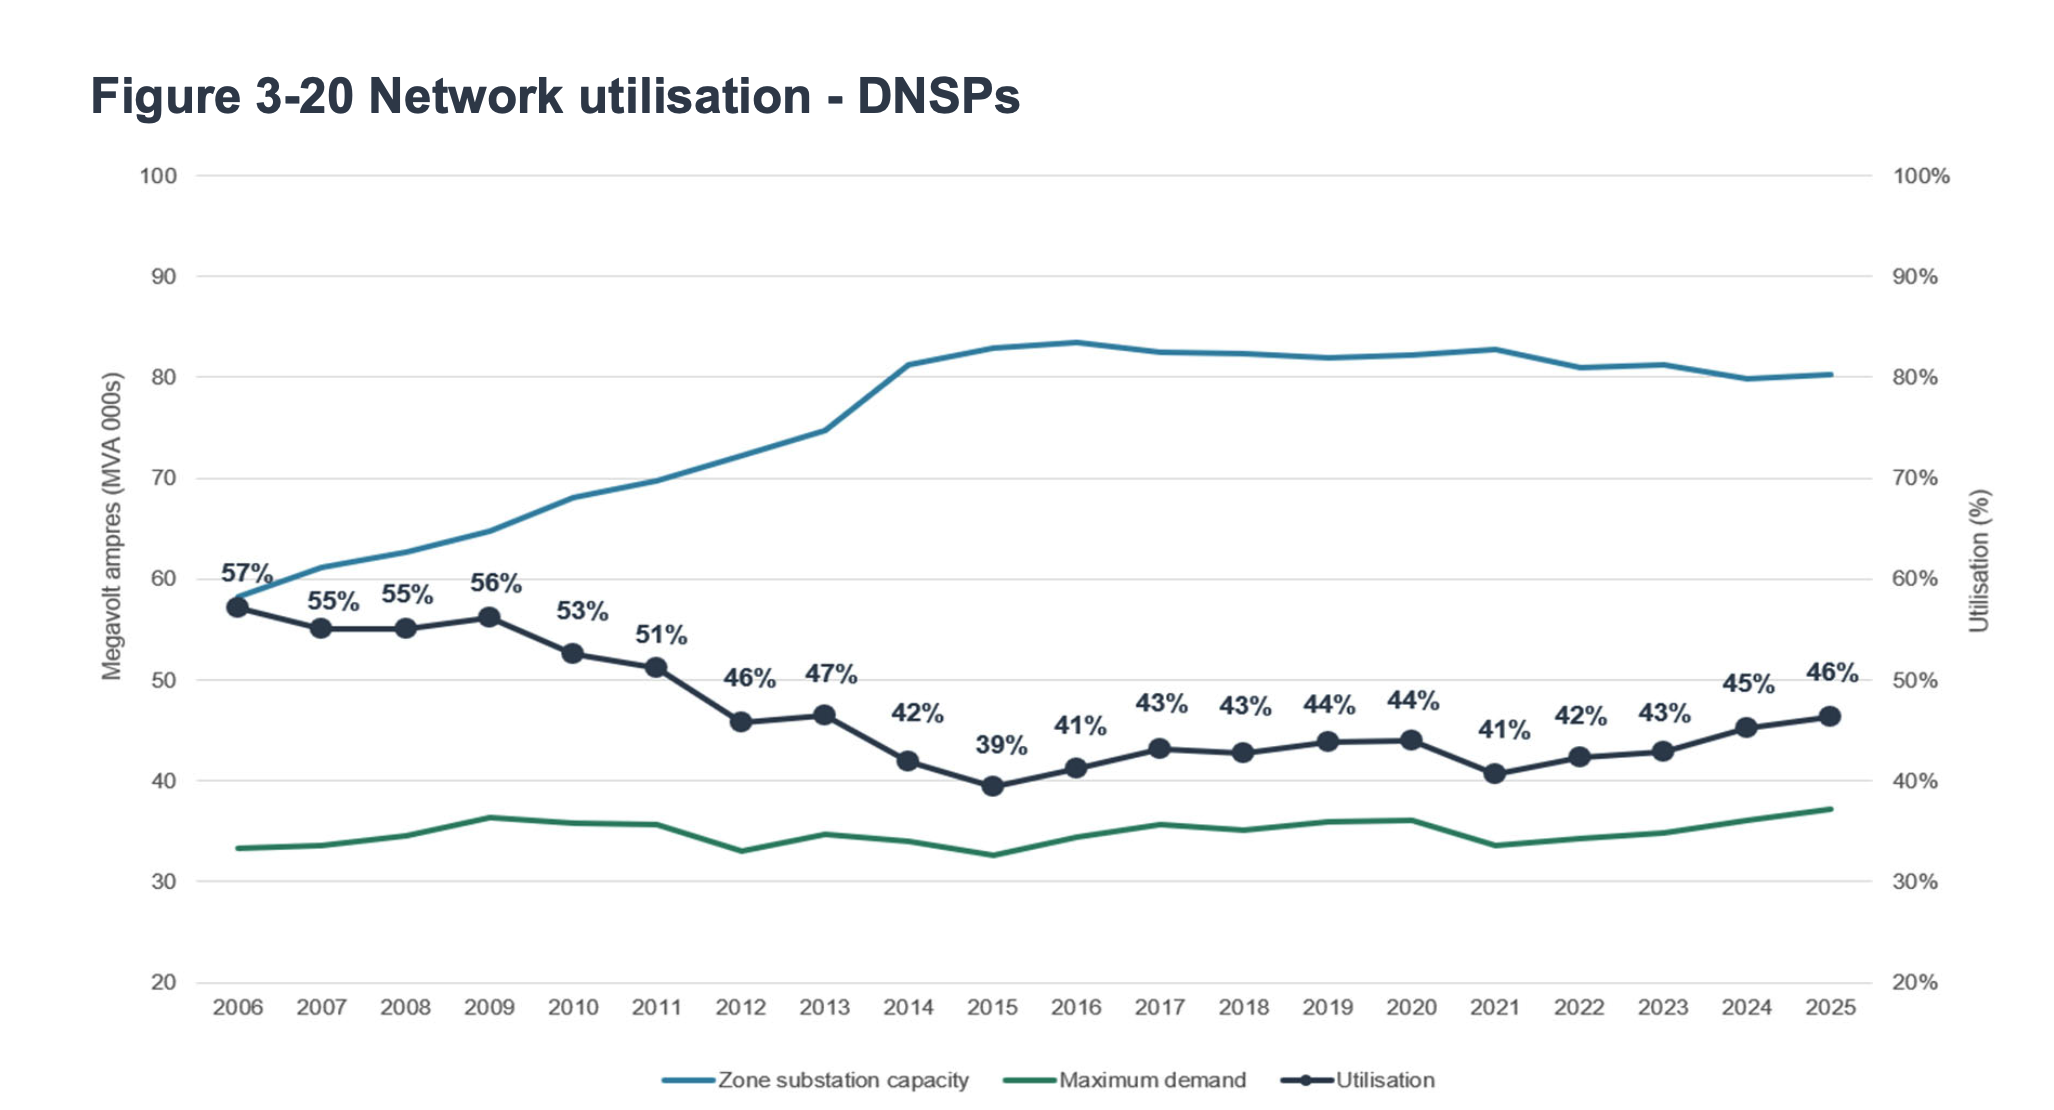
Figure 8 hints at the fundamental problem. Capacity was built out hard to 2014 and has barely moved since, and utilisation has still not recovered to where it was twenty years ago. Australia has adopted the UK model for electricity which separates supply into competitive market facing elements and regulated businesses with more or less monopoly characteristics.
Over time the problems with monopoly regulation have changed. Firstly the networks found easy ways, with a compliant competition tribunal, to game regulator decisions. In one of his few successes Josh Frydenberg put a stop to that. Then networks and the regulator found that price based regulation was not delivering the revenue networks needed to recover costs, and so a revenue cap was introduced. That is the AER determines the amount of revenue over a five year period that a regulated business can recover. Prices are the outcome of revenue/volume.
A last plot — there are many more but this note is already long
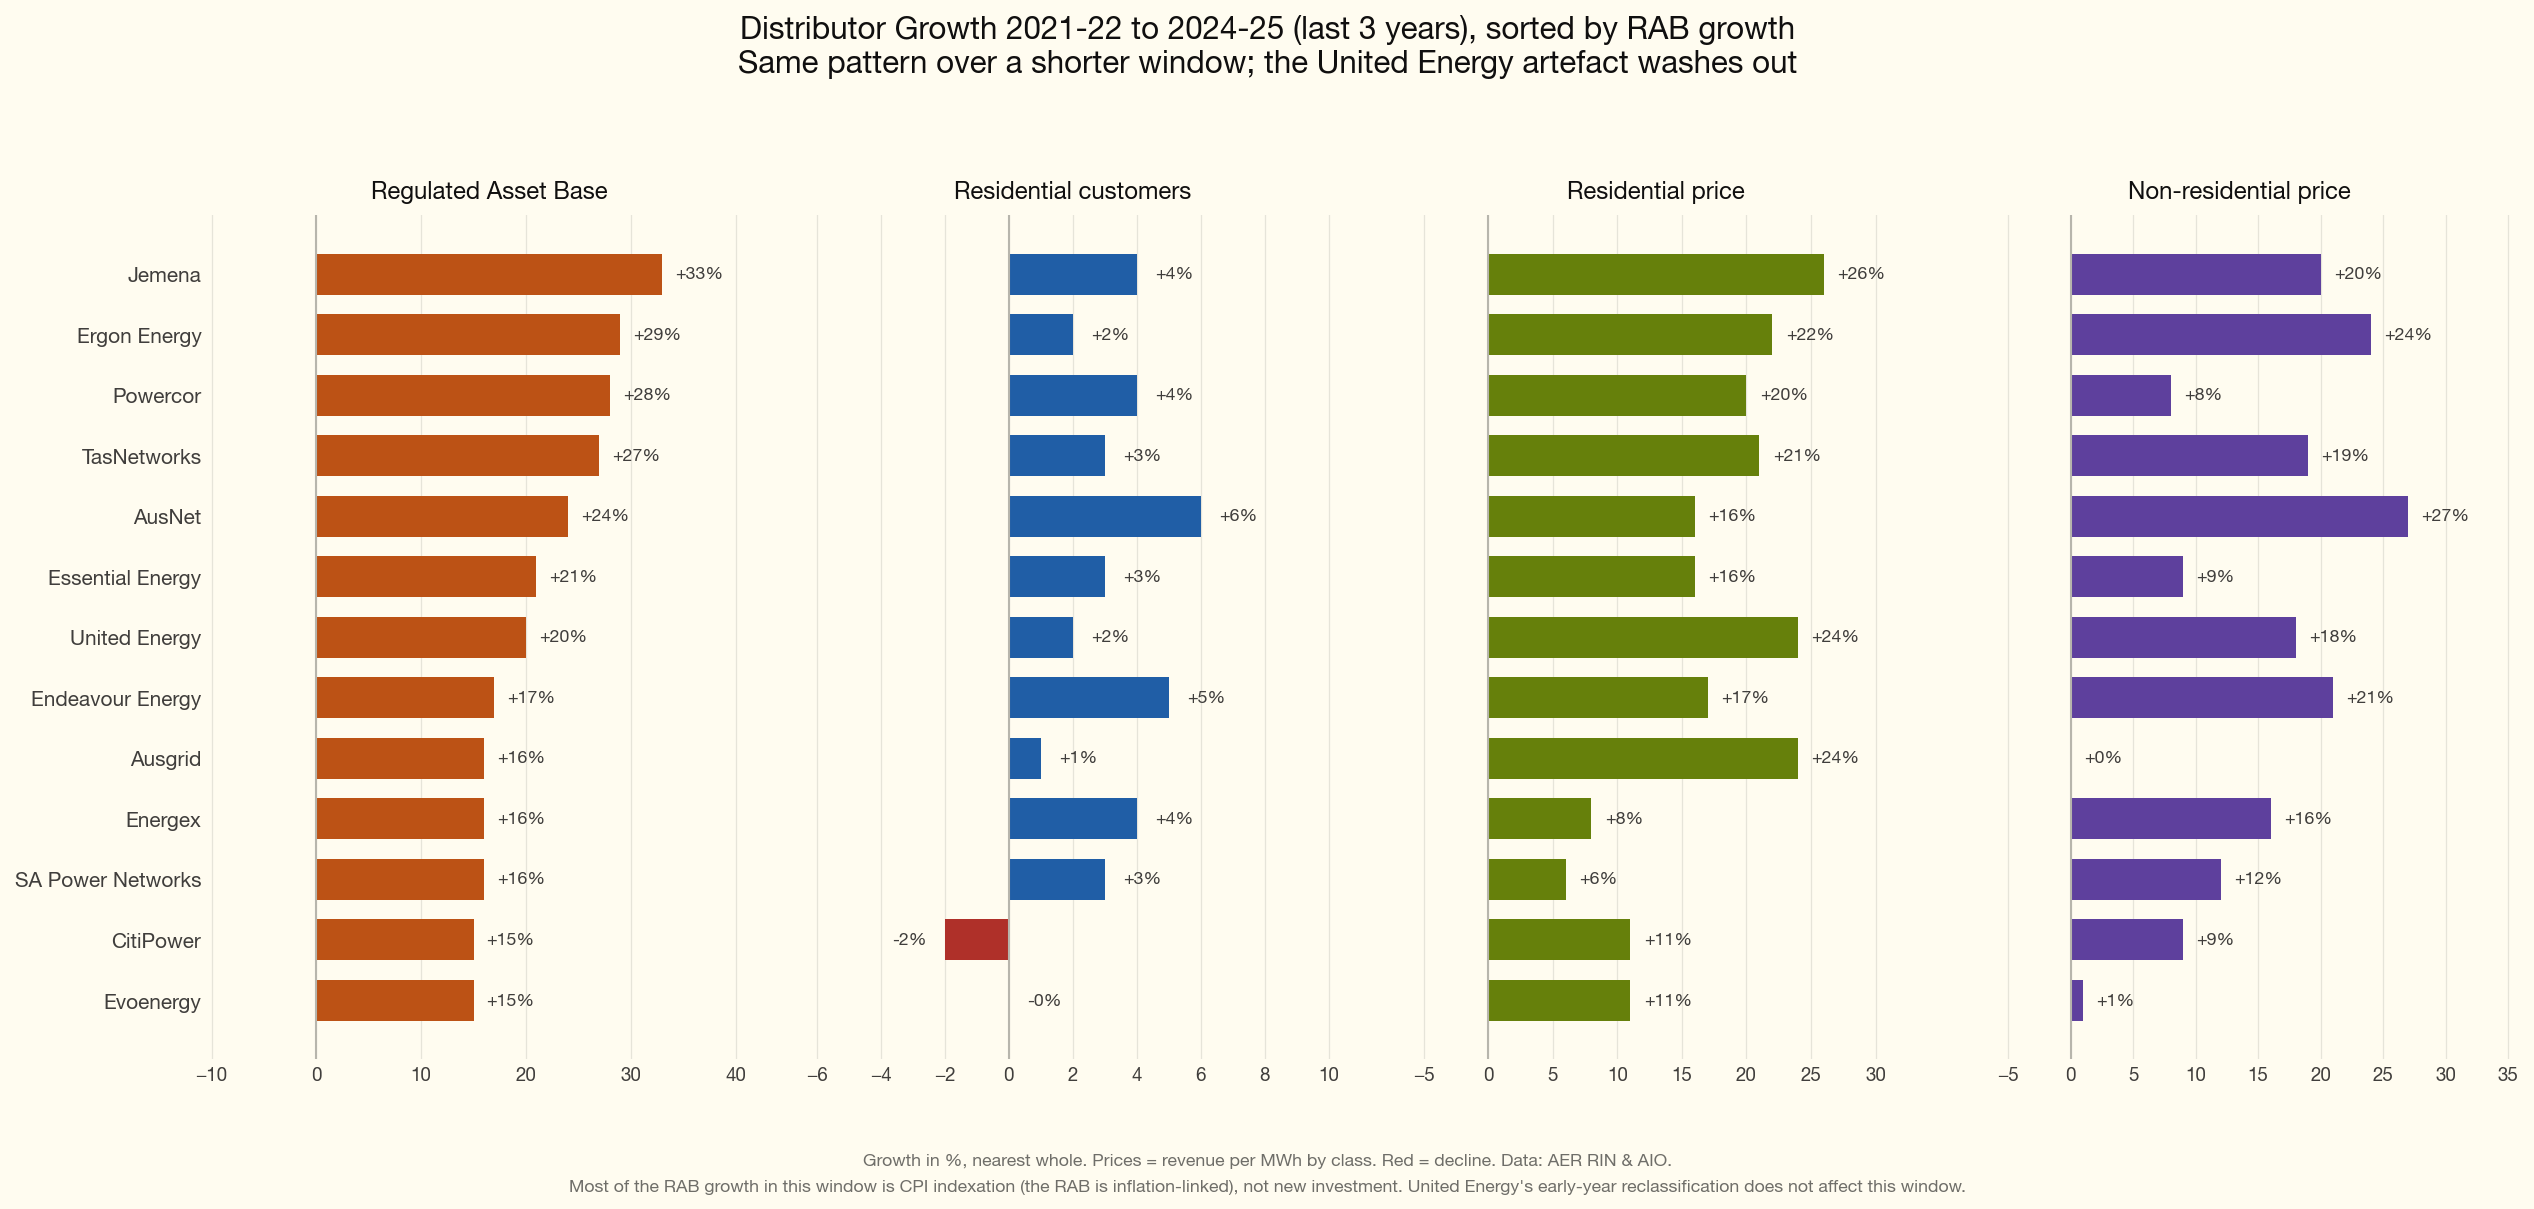
Figure 9 shows some summary time series progress.
Appendix A: Estimating behind the meter self consumption
Every kilowatt-hour a rooftop solar system generates is either exported to the grid or self-consumed on site behind the meter. So self-consumption is just what is left after exports:
behind-the-meter self-consumption = rooftop generation − rooftop exportsA household’s rooftop panels generate 6,000 kWh over a year. Its meter records 3,800 kWh exported to the grid. Then:
self-consumption = 6,000 − 3,800 = 2,200 kWhThat 2,200 kWh is used inside the home and never crosses the network meter — the distributor does not deliver it, see it, or bill network charges on it. Its self-consumption ratio is 2,200 / 6,000 = 37%.
Across all NEM residential rooftop, using three data sources:
- Generation — AEMO’s
rooftop30series (actual total rooftop output for systems under 100 kW), split to residential using the fleet’s residential capacity share from CER installs-by-size data (≈84%: all systems under 14 kW, plus a rising slice of 14–25 kW, none of 25–100 kW). - Exports — the networks’ own reported residential embedded generation (AER RIN/AIO, codes DOPED0405–0408), i.e. energy fed back into the grid.
For 2024-25:
| Step | TWh |
|---|---|
| AEMO total rooftop generation (NEM) | 27.6 |
| × residential share (~84%) = residential generation | 23.2 |
| − residential exports (measured, RIN) | 14.8 |
| = behind-the-meter self-consumption | 8.4 |
Implied self-consumption ratio = 8.4 / 23.2 = 36% — an output of the calculation, and consistent with modern large systems that export most of what they make.
AEMO’s rooftop series starts January 2020. For 2018-19 and 2019-20 we back-cast generation from CER installed capacity multiplied by a yield factor calibrated on the 2020-21 to 2024-25 overlap (about 1.0 TWh per GW of national capacity, i.e. a ~13% capacity factor once the NEM share is netted out). These two years are the least certain and are flagged as back-cast wherever they are used.
- Self-consumption is an estimate: generation is AEMO-modelled and the residential split rests on capacity data, so the level carries model uncertainty. The direction (rising from ~2.5 TWh in 2018-19 to ~8.4 TWh in 2024-25) holds because rooftop generation grew and exports are measured.
- CER installs data is national; AEMO rooftop and the RIN are NEM-only. The national data is used only for the residential share and the size trend, not for absolute NEM capacity.
- From FY2025-26 the home-battery scheme will start lifting self-consumption (batteries store daytime surplus for evening use), which the method will pick up automatically once the later RIN exports are published.
Appendix C: What the AEMC proposes
What follows is a response to the AEMC’s pricing review, whose final report was published on 18 June 2026.
The review makes four recommendations and only one of them is about networks. The other three are retail: exposing the loyalty penalty paid by long standing customers, better comparison tools, and a periodic review of retail regulation. The network recommendation, the third, has four components.
The first rewrites the objective that governs how network tariffs are designed. It drops the requirement to build tariffs on long run marginal cost and adds an equity limb, so tariffs should promote efficient use of and investment in the network and recover shared costs more equitably between consumers. The second is dynamic pricing: a usage charge that would be zero when and where the network is not congested and rise only where it is, applied symmetrically so exports are priced on the same logic as imports. It would make the present export charges and the minimum basic export level redundant. It is not mandated — each network chooses the pace. The third is the recovery of everything that is not congestion, through the shared network access charge. The AEMC is at pains to say this need not be uniform: it could vary with a household’s past consumption, with its peak demand, or with something structural such as whether the connection is single or three phase. The fourth shifts the complexity onto retailers. Networks would design tariffs that retailers can manage rather than tariffs households can understand, and the existing requirements that network tariffs be understandable to consumers and that networks manage the impact on customers are both removed, replaced by a principle about the impact on retailers.
Implementation would run about ten years. It needs a rule change request, which the AEMC cannot lodge itself, and then attaches to the five yearly revenue resets — 2029 for New South Wales, Tasmania, the ACT and the Northern Territory, otherwise 2034. The AEMC puts the benefit at $2 to $6 billion over fifteen years, or $40 to $80 a customer a year by 2040, and attributes it to dynamic pricing reducing congestion and deferring augmentation. None of the claimed saving comes from the shift to fixed charges, which under a revenue cap moves money between customers without changing what the networks collect.
For each distributor the regulated asset base (RAB) is essentially an installed cost base where the concept of marginal or cost reflective tariffs is not applicable.
Recovering a large sunk residual requires a charge that is deliberately not marginal-cost-based. This is, apparently, the classic Ramsey problem: you collect the residual in whatever way distorts behaviour least. Or alternatively if you are a policy maker set tariffs to incentivise some form of behaviour, but this needs clarity, not some idea of non existent “cost reflective tariffs”
The APVI work points at a different answer for the residual. Measures of household demand shift from year to year — demand at the time of network peak correlates at 0.55 between 2010-11 and 2012-13 — which is a problem if you are allocating a sunk cost by historical responsibility.
Fixed-charge recovery plus an allowed return on the asset base mutes the demand-side signals that should be saying “stop building”, even if in real terms the asset base per customer has not in fact grown. It is also worth knowing what the money is spent on: augmentation, which is building capacity for growth, is only about 9.5% of distributor capex, while replacing ageing assets is 33%. No price signal, however sharp, stops a sixty year old cable from failing. RAB up 31% in nominal terms since 2018-19 — though on the AER’s own roll-forward three quarters of that increase is inflation indexation rather than new investment — fixed charge revenue up 21% against total revenue up 14%, volumes flat. The networks are simultaneously de-risking their revenue (more fixed) and growing their asset base, and fixed charges take away the signal to all parties. The volume and asset base evidence is in the charts above.
The remedies maybe should sit on the network side rather than the tariff side: RAB write-downs or accelerated depreciation to face stranding, and mandating consumer energy resources (CER) and flexibility as an alternative to augmentation. There might also be more competition in the supply of network services, making community batteries and other larger batteries as easy for third parties to install as home batteries are. Incentivisation and competition in the provision of street and building level EV chargers.
I personally think we might have looked at shorter franchise lives, 25 years rather than 100, but that has its own can of worms.
Holding total allowed revenue constant the shift to fixed charges moves money and risk along predictable lines:
Winners
- The distributor — revenue certainty, insulation from volume decline and stranding risk. This is the biggest and least-discussed winner.
- High-consumption, non-solar households — a flat charge dilutes across their large volume, so their effective c/kWh falls; heavy users are cross-subsidised by light users.
- Non-CER households generally (the AEMC’s headline equity case) — they stop subsidising solar/battery households who currently avoid their share of the sunk cost by pulling less from the grid.
Losers
- Low-consumption households — small dwellings, apartments, low-income, elderly, holiday homes. A fixed charge is regressive: a bigger share of a small bill, and unavoidable. This is the equity flashpoint.
- Frugal / efficient users — lose the ability to cut their bill by using less. Fixed charges kill the conservation incentive at the network level, which over time means more augmentation, not less.
- CER owners — fixed charges claw back exactly the network-cost avoidance they invested to achieve, degrading solar/battery economics (the “solar tax” perception) and, at the margin, stranding investments people made under the old rules. The AEMC’s own modelling (payback +~3 months solar, +~4 months solar+battery) is the attempt to say “not much” — but the direction is one way, and it lands on three million households who already committed.
- The flexibility ecosystem — if you can’t save on the network component by shifting or shedding load, the reward for demand response shrinks (the AEMC preserves a demand/time signal for the augmentation slice, but that’s small).
The unifying point: a fixed charge converts a partly-avoidable cost into an unavoidable one. It’s efficient in the Ramsey2 sense (least consumption distortion) but it transfers risk from the network to the customer and strips the customer of agency over their bill — which is why it’s efficient and politically radioactive at the same time.
Also considered broadly it disincentives household solar, as does the three free hours solar tariff.
Footnotes
Rob Passey and Navid Haghdadi, “(Re)designing Cost-Reflective Tariffs”, APVI Workshop, Sydney, 1 June 2016. The correlation coefficients and the seasonal split of household peaks are from that presentation.↩︎
Ramsey pricing is a rule for setting prices when a supplier has to raise a chosen amount of revenue but cannot charge everyone the cost of supplying one more unit, because that price would leave the costs already committed to the business unrecovered. The rule lifts each price above the cost of one more unit by an amount that moves in inverse proportion to how far buyers cut their purchases when the price goes up. Buyers and products whose demand shifts little as the price moves take on more of the markup; those whose demand falls away take on less. The purpose is to bring in the revenue while reducing purchases as little as the arithmetic allows, so the loss to buyers as a whole is held down. For a network business whose revenue is set by a regulator, the same reasoning points to recovering the part of the bill that no per-unit price can track — the value of assets already built — through the charge that changes behaviour least, which is why it gets invoked in support of a charge levied per connection.
Frank Plumpton Ramsey (1903–1930) worked at Cambridge across mathematics, philosophy and logic, within the circle around John Maynard Keynes, Arthur Pigou and Ludwig Wittgenstein, whose Tractatus he helped put into English while still in his teens. He set out the rule in a paper of 1927, “A Contribution to the Theory of Taxation,” in the Economic Journal, which Keynes edited. Pigou had raised with him the question the paper takes up: how a government should spread taxes across goods to raise a set sum while giving up as little welfare as it can. Ramsey’s aim was to answer that question with mathematics rather than to change tax policy — economics was one of the fields he took up alongside probability, logic and philosophy, and he wrote in it only twice. He died at 26, the two economics papers (the one on taxation and one on saving) being work that Keynes and the economists who followed kept returning to.↩︎