Electrifying the Pilbara
Battery-electric haul trucks and Fortescue’s green grid
ITK’s estimate of what electrifying Fortescue’s Pilbara mines costs and saves: the green grid, the cost of the electricity it delivers to battery-electric haul trucks, and the return on the whole project. It is published in the public interest. Each slide has its own page with the main assumptions, the sources and a comment thread. If you think a number, an assumption or a source is wrong, say so there.
All costs are real 2025 Australian dollars unless stated, and numbers are ITK estimates except where a source is given.
View the slide deck · Change log
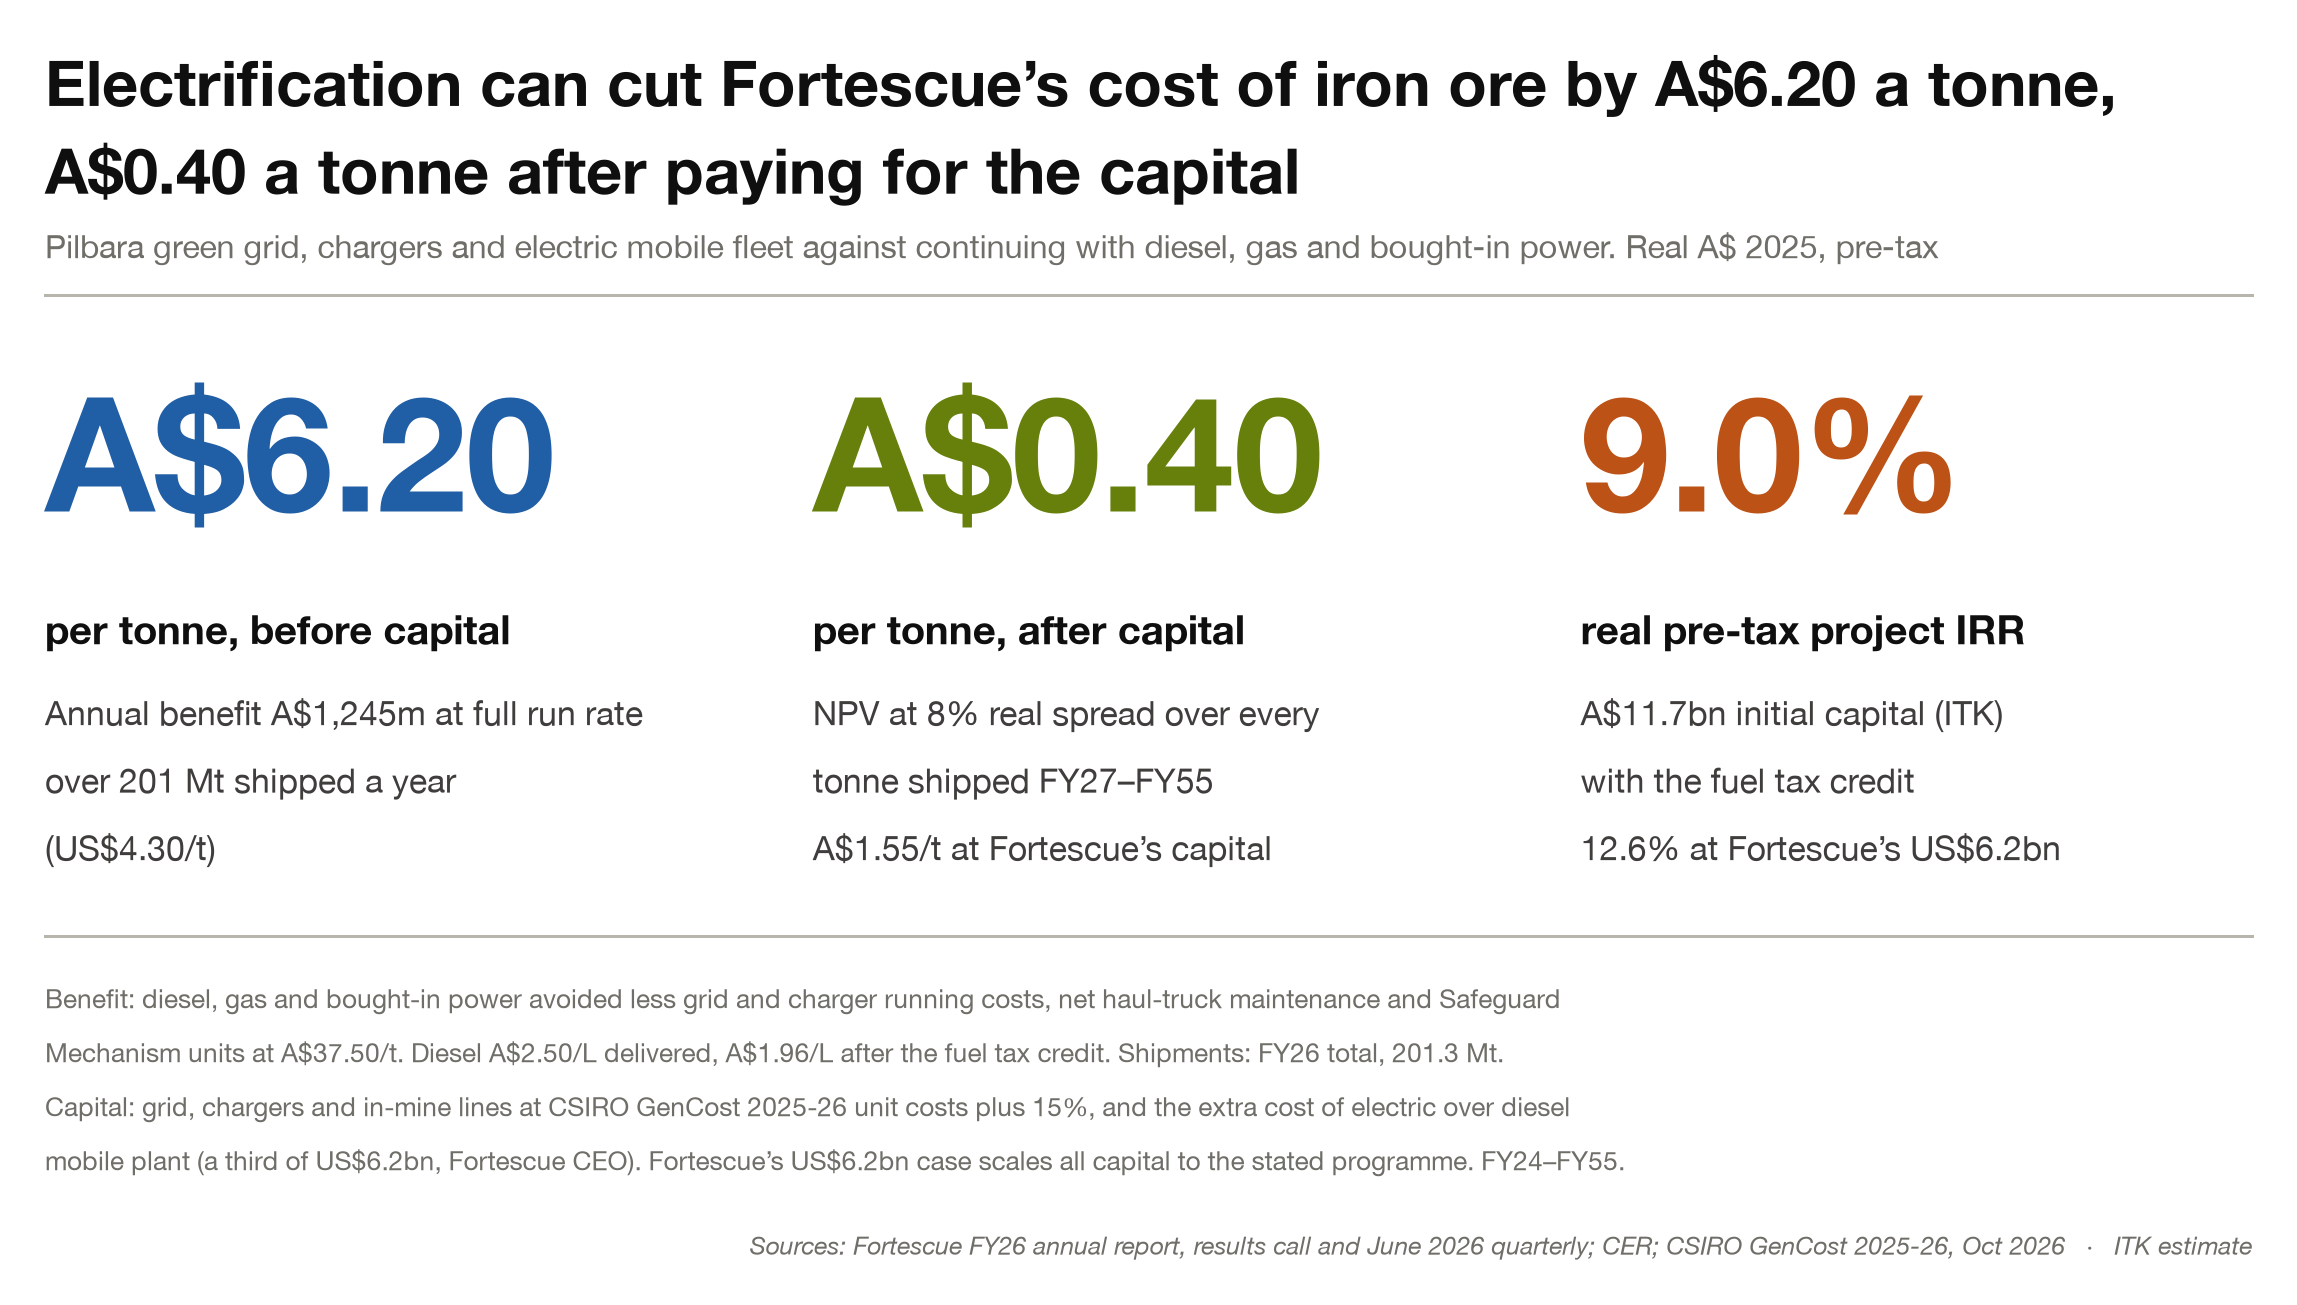
Cost per tonne and project return
Electrification cuts Fortescue’s cost of iron ore by A$6.20 a tonne before capital, A$0.40 after it.
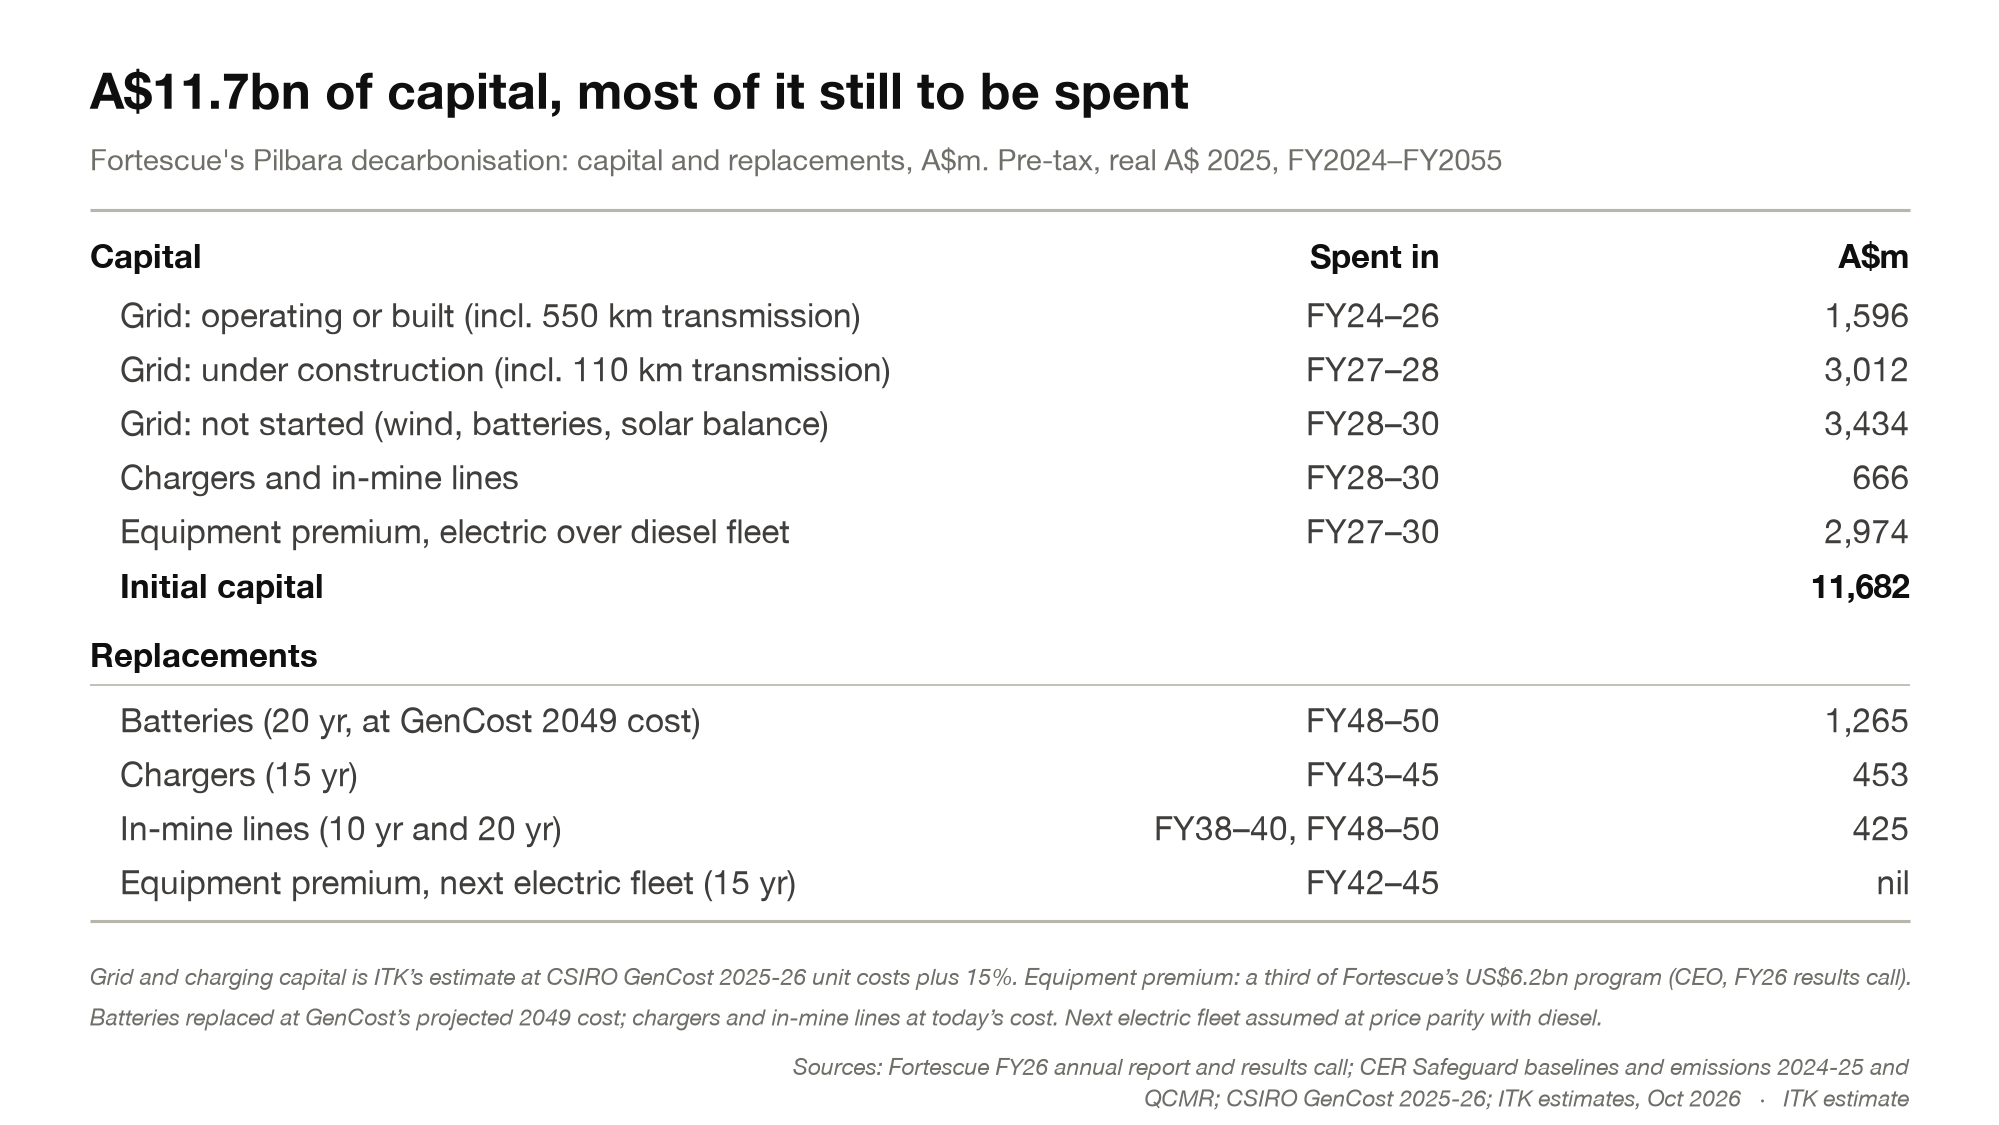
Capital and replacements
A$11.7bn of initial capital, timed by build status, plus replacements.
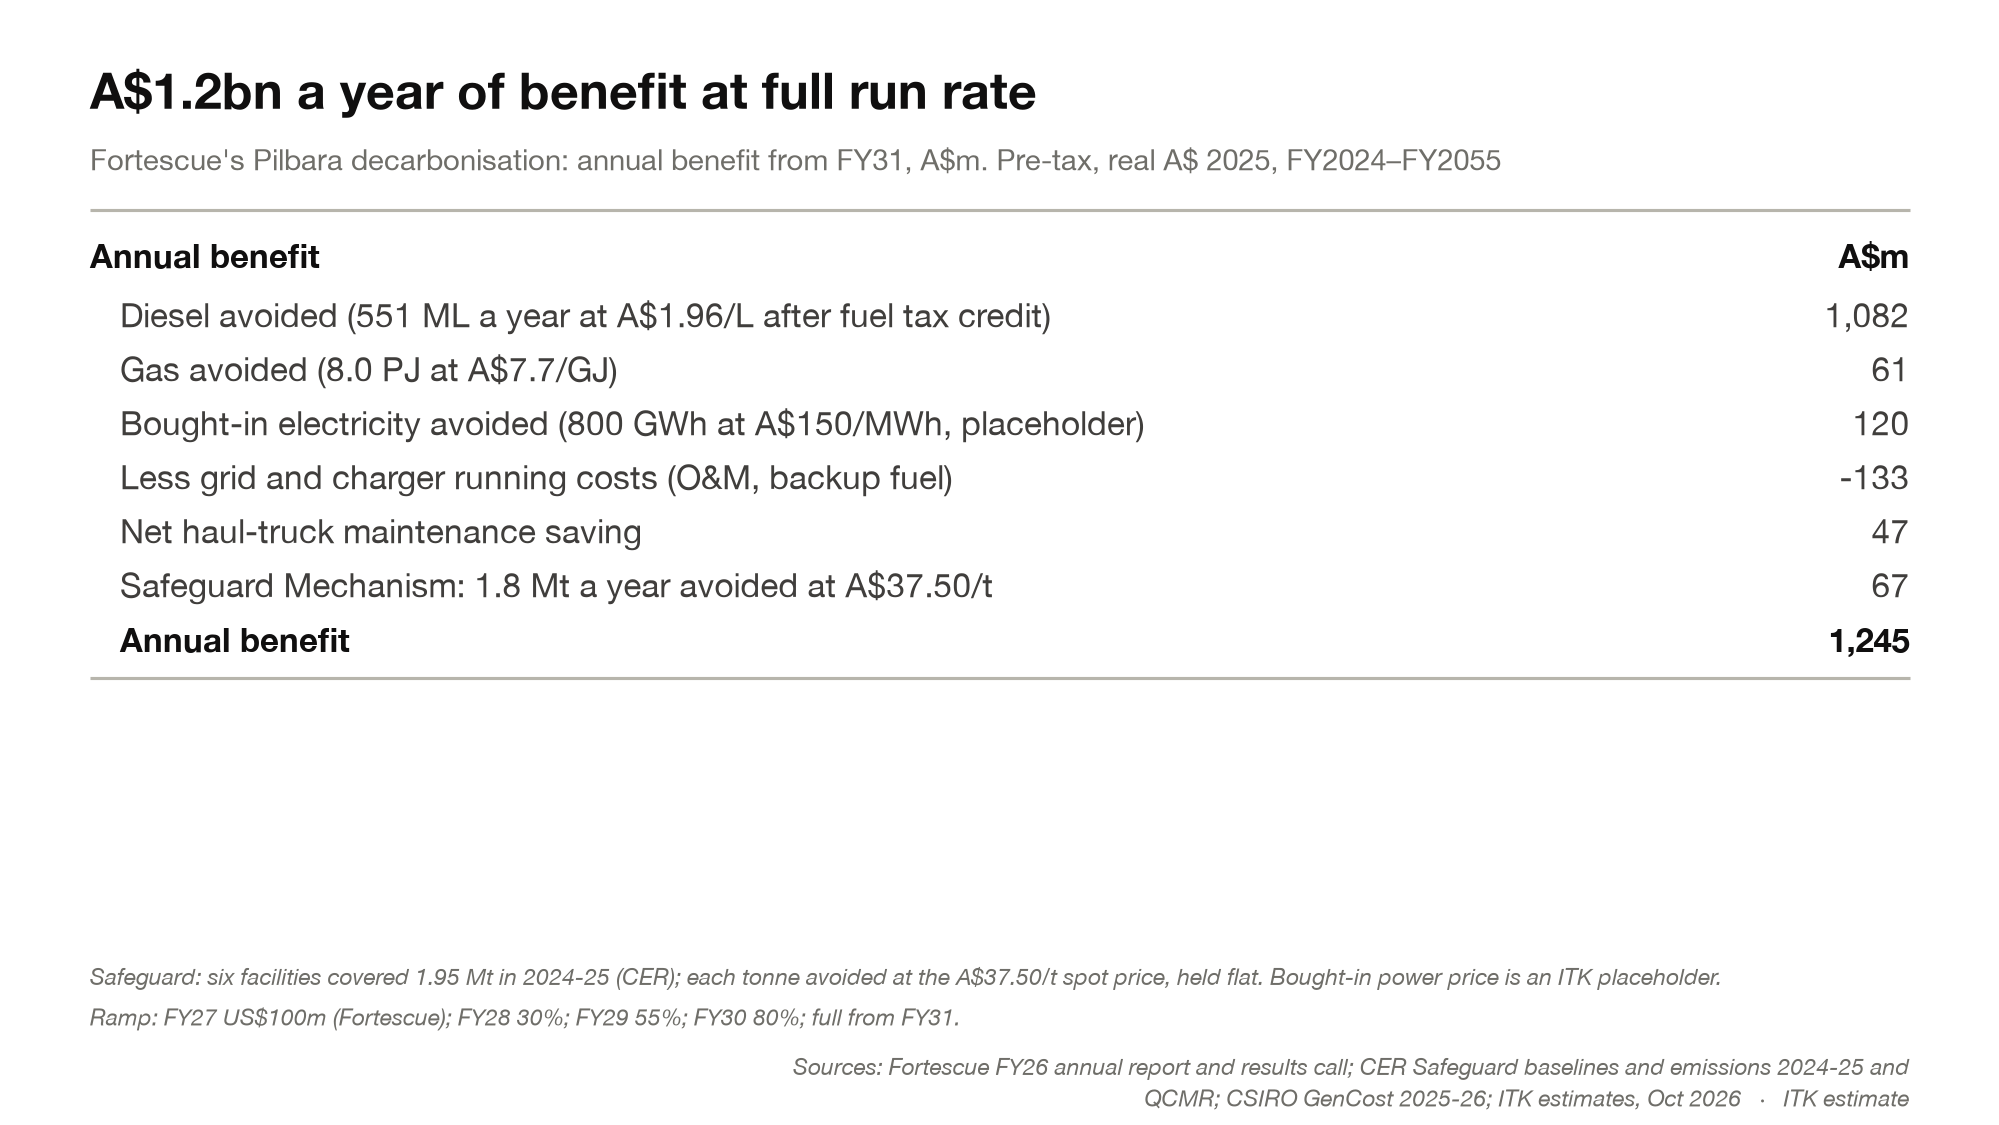
Annual benefit at full run rate
A$1,245m a year from FY31: diesel, gas and bought-in power avoided, less running costs.
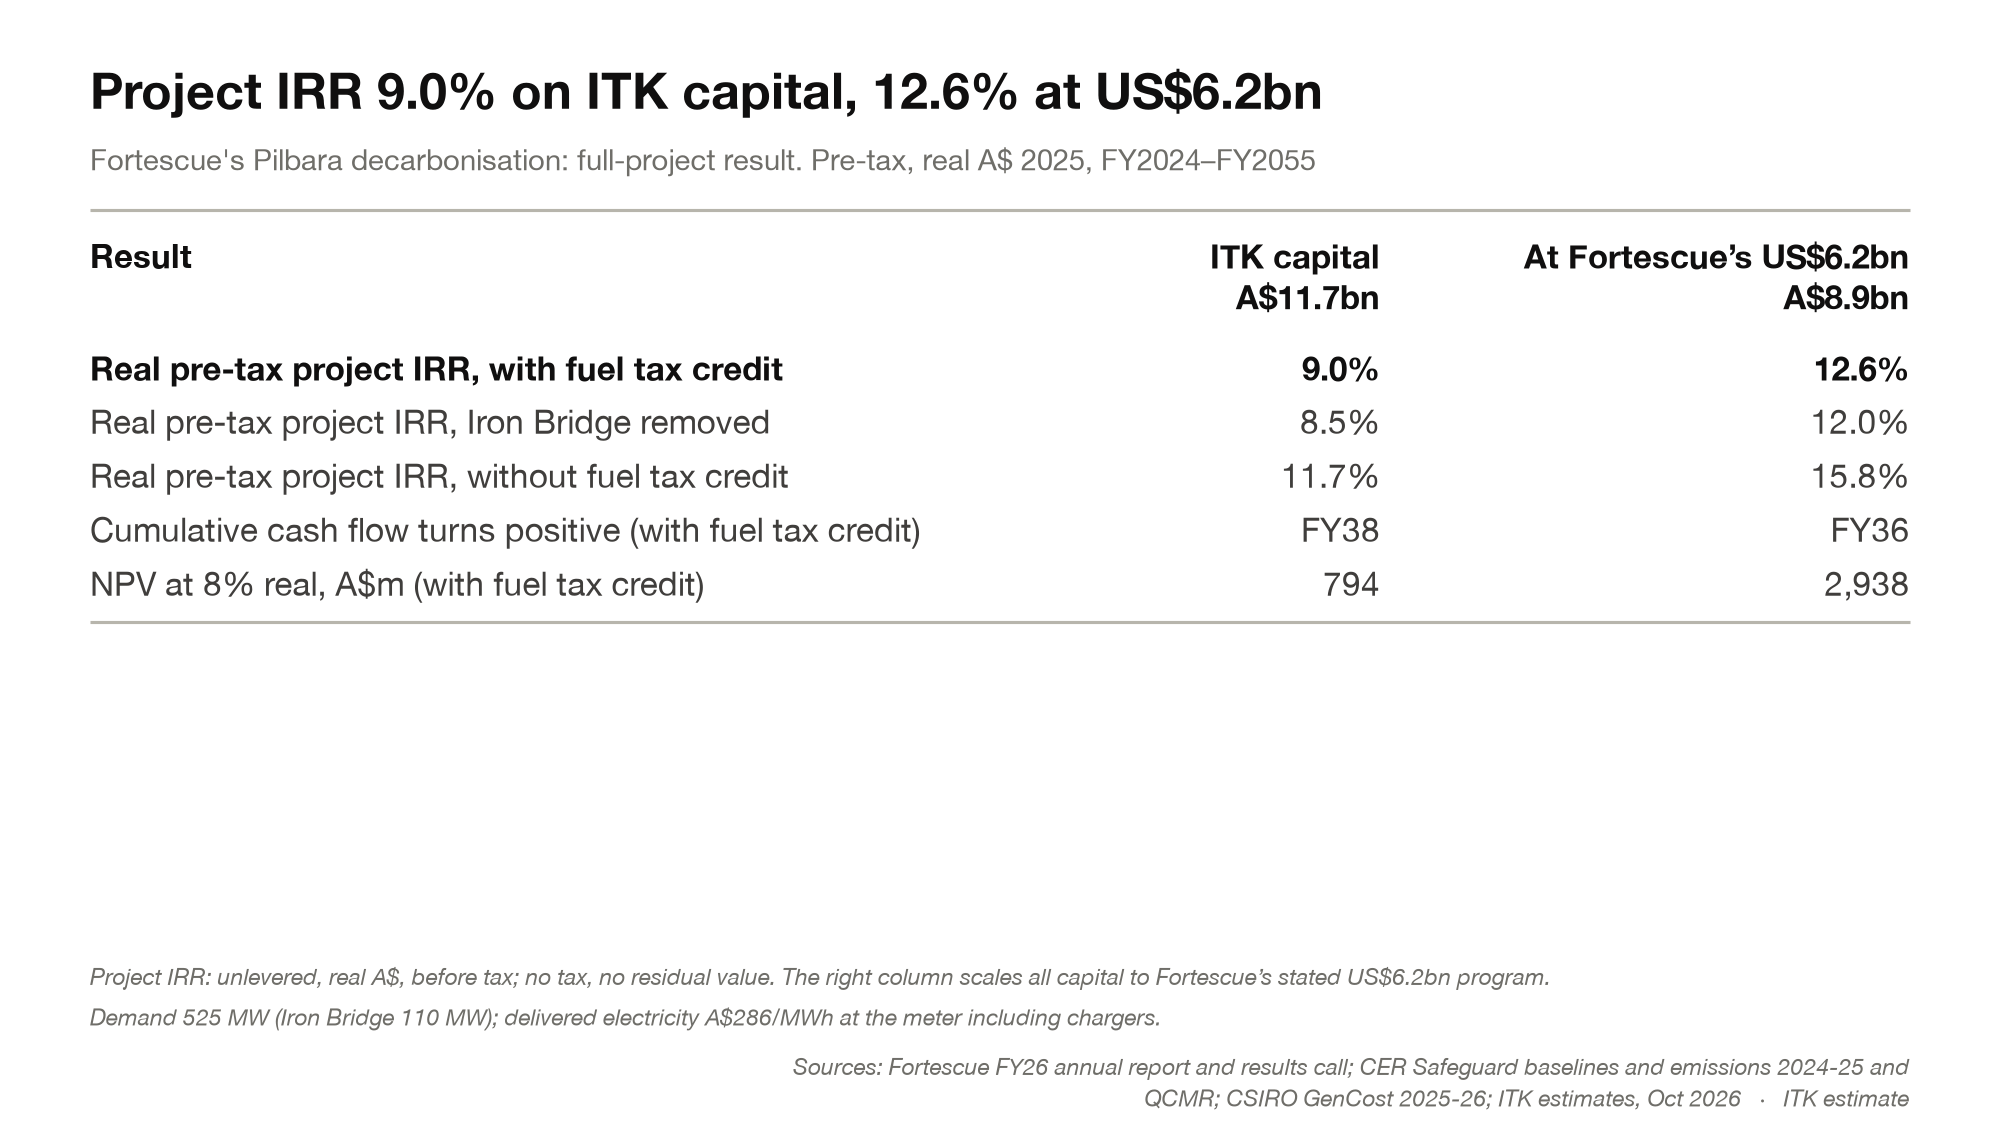
Project IRR and NPV
9.0% real pre-tax IRR on ITK capital, 12.6% at Fortescue’s US$6.2bn.
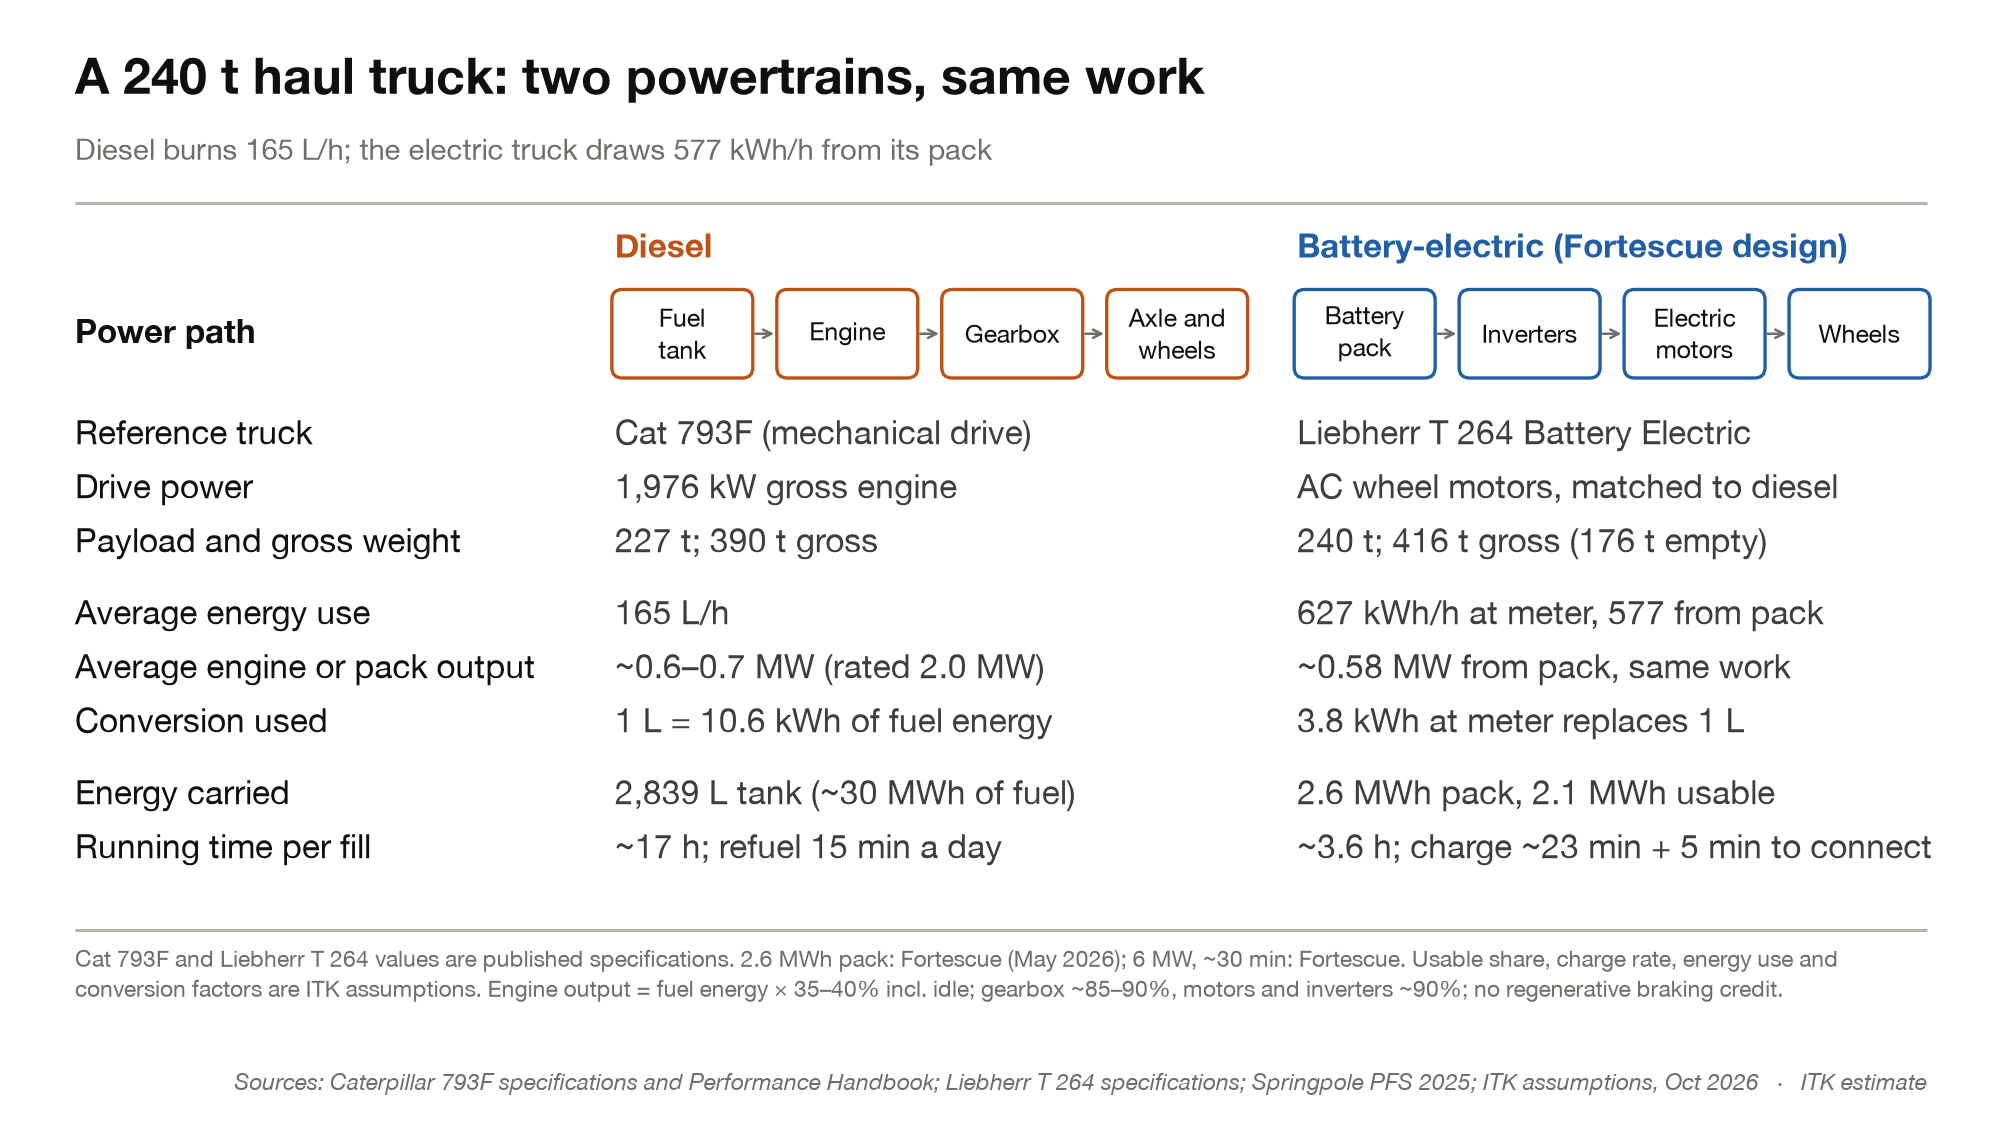
A 240 t haul truck: diesel and battery-electric
165 litres of diesel an hour against 627 kWh of electricity at the meter.
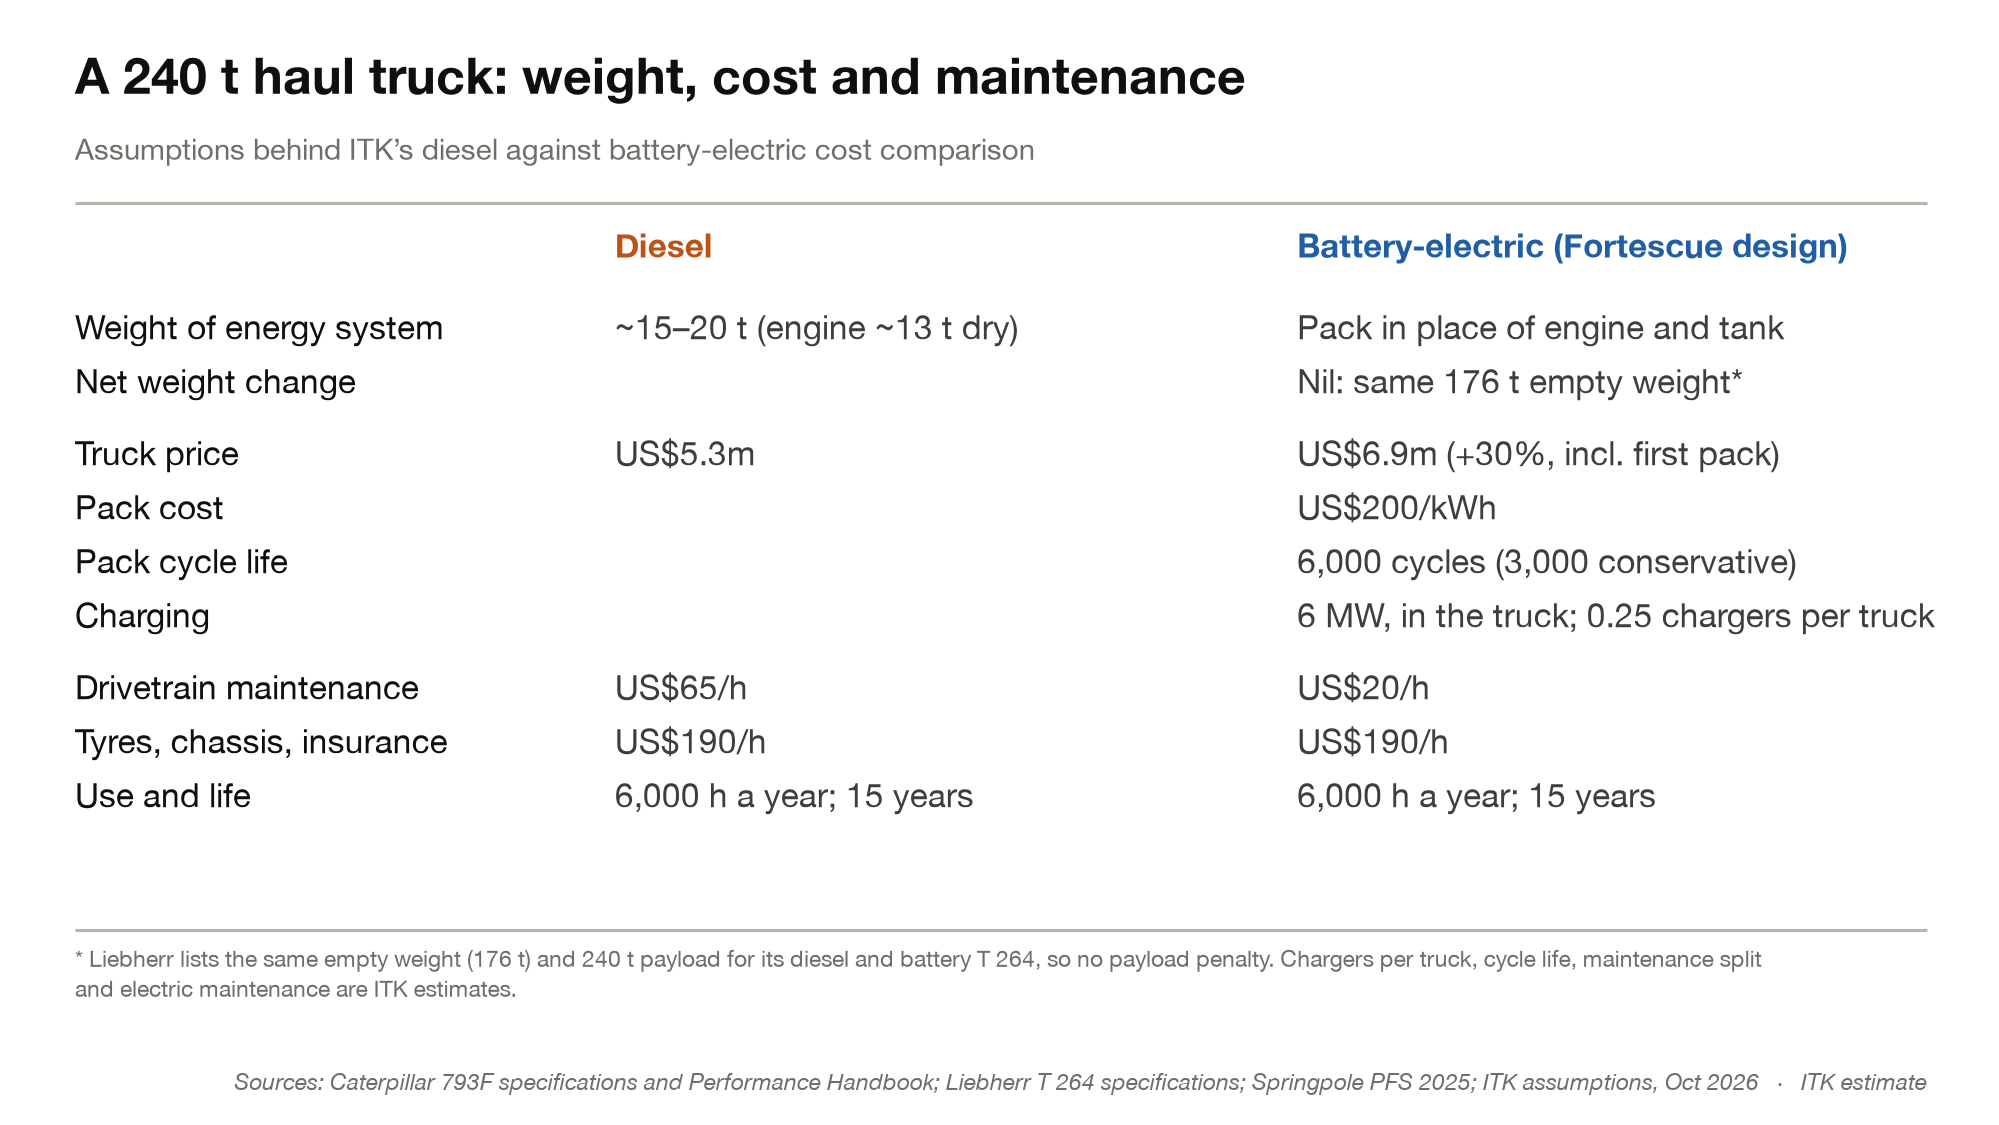
A 240 t haul truck: weight, cost and maintenance
Truck prices, pack costs, cycle life and maintenance behind the comparison.
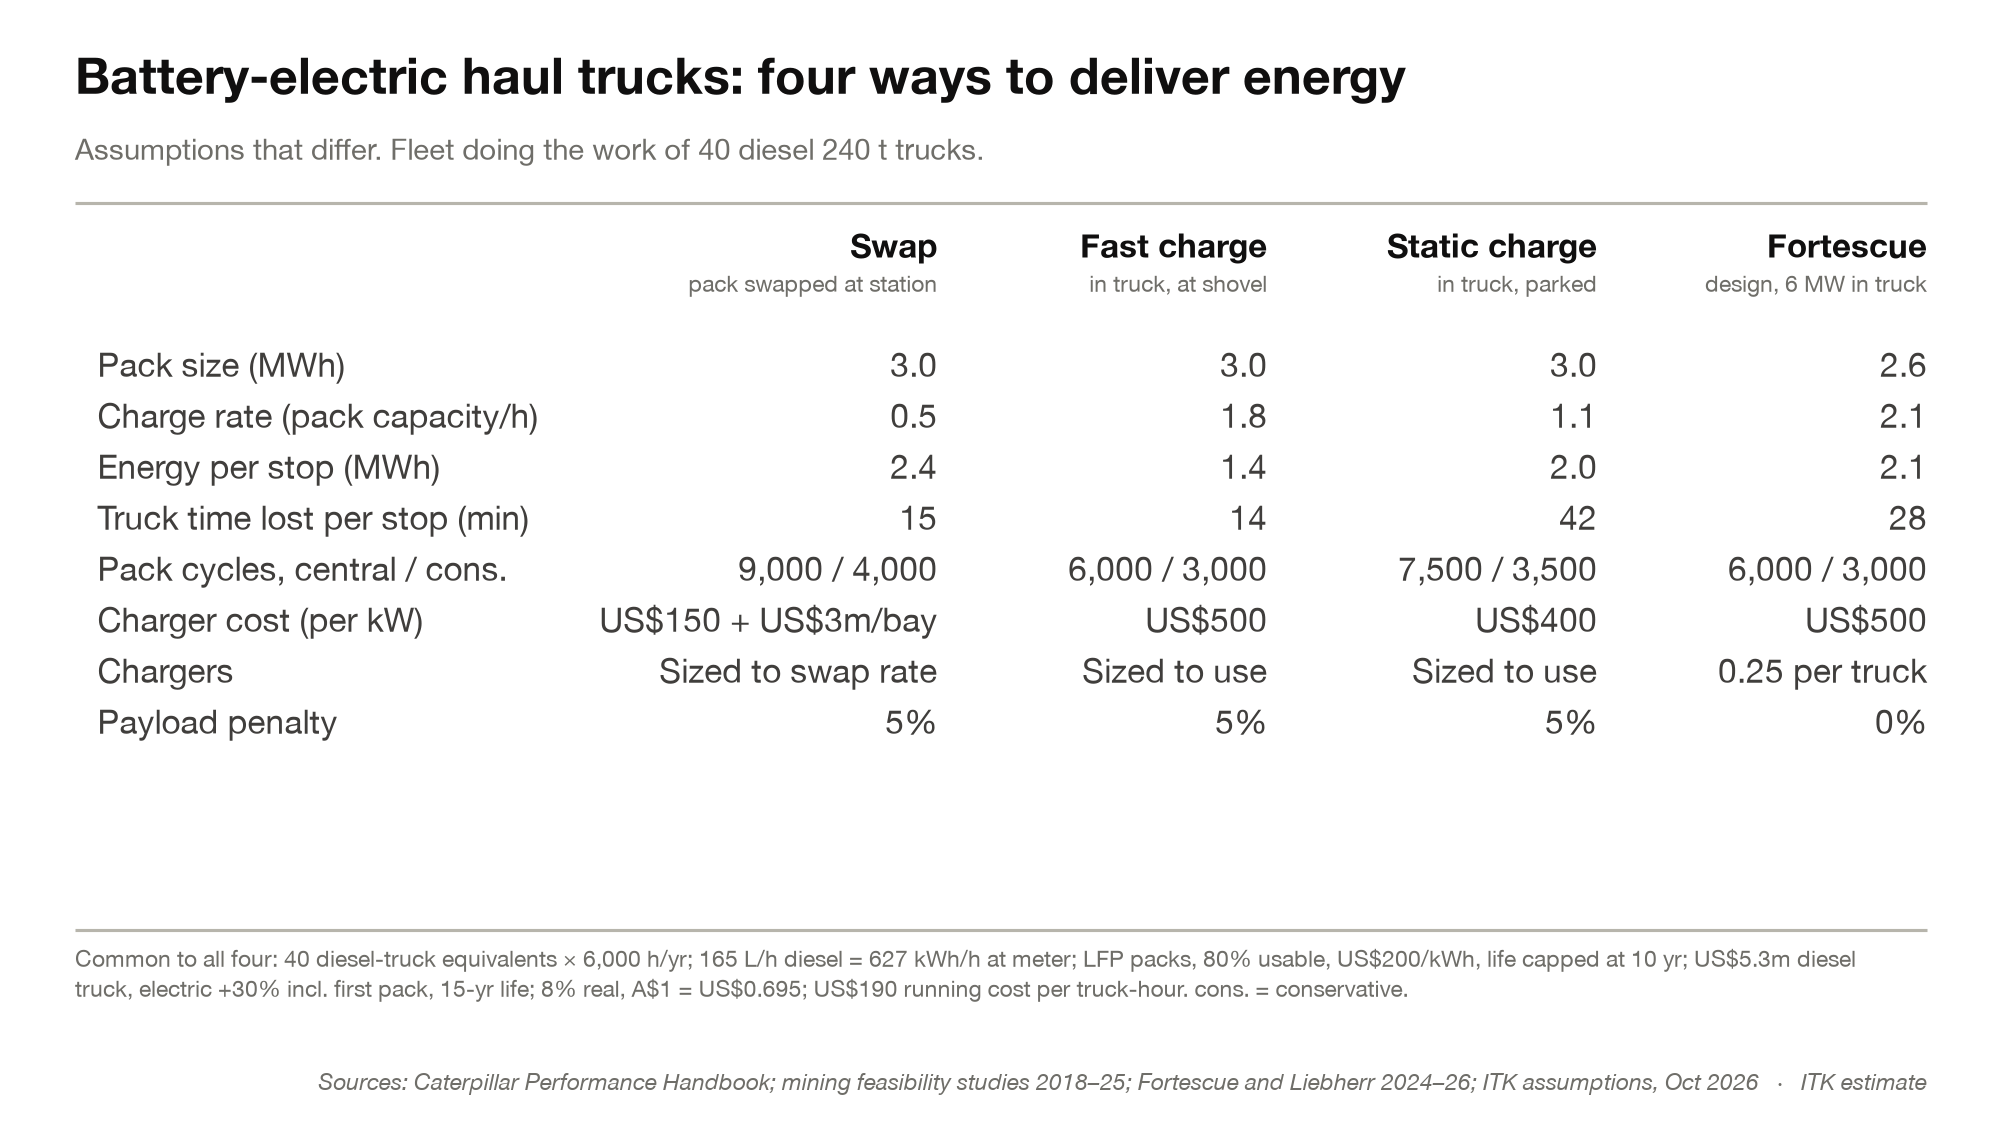
Four ways to get energy into the truck
Battery swap, fast charge, static charge and Fortescue’s in-truck 6 MW design.
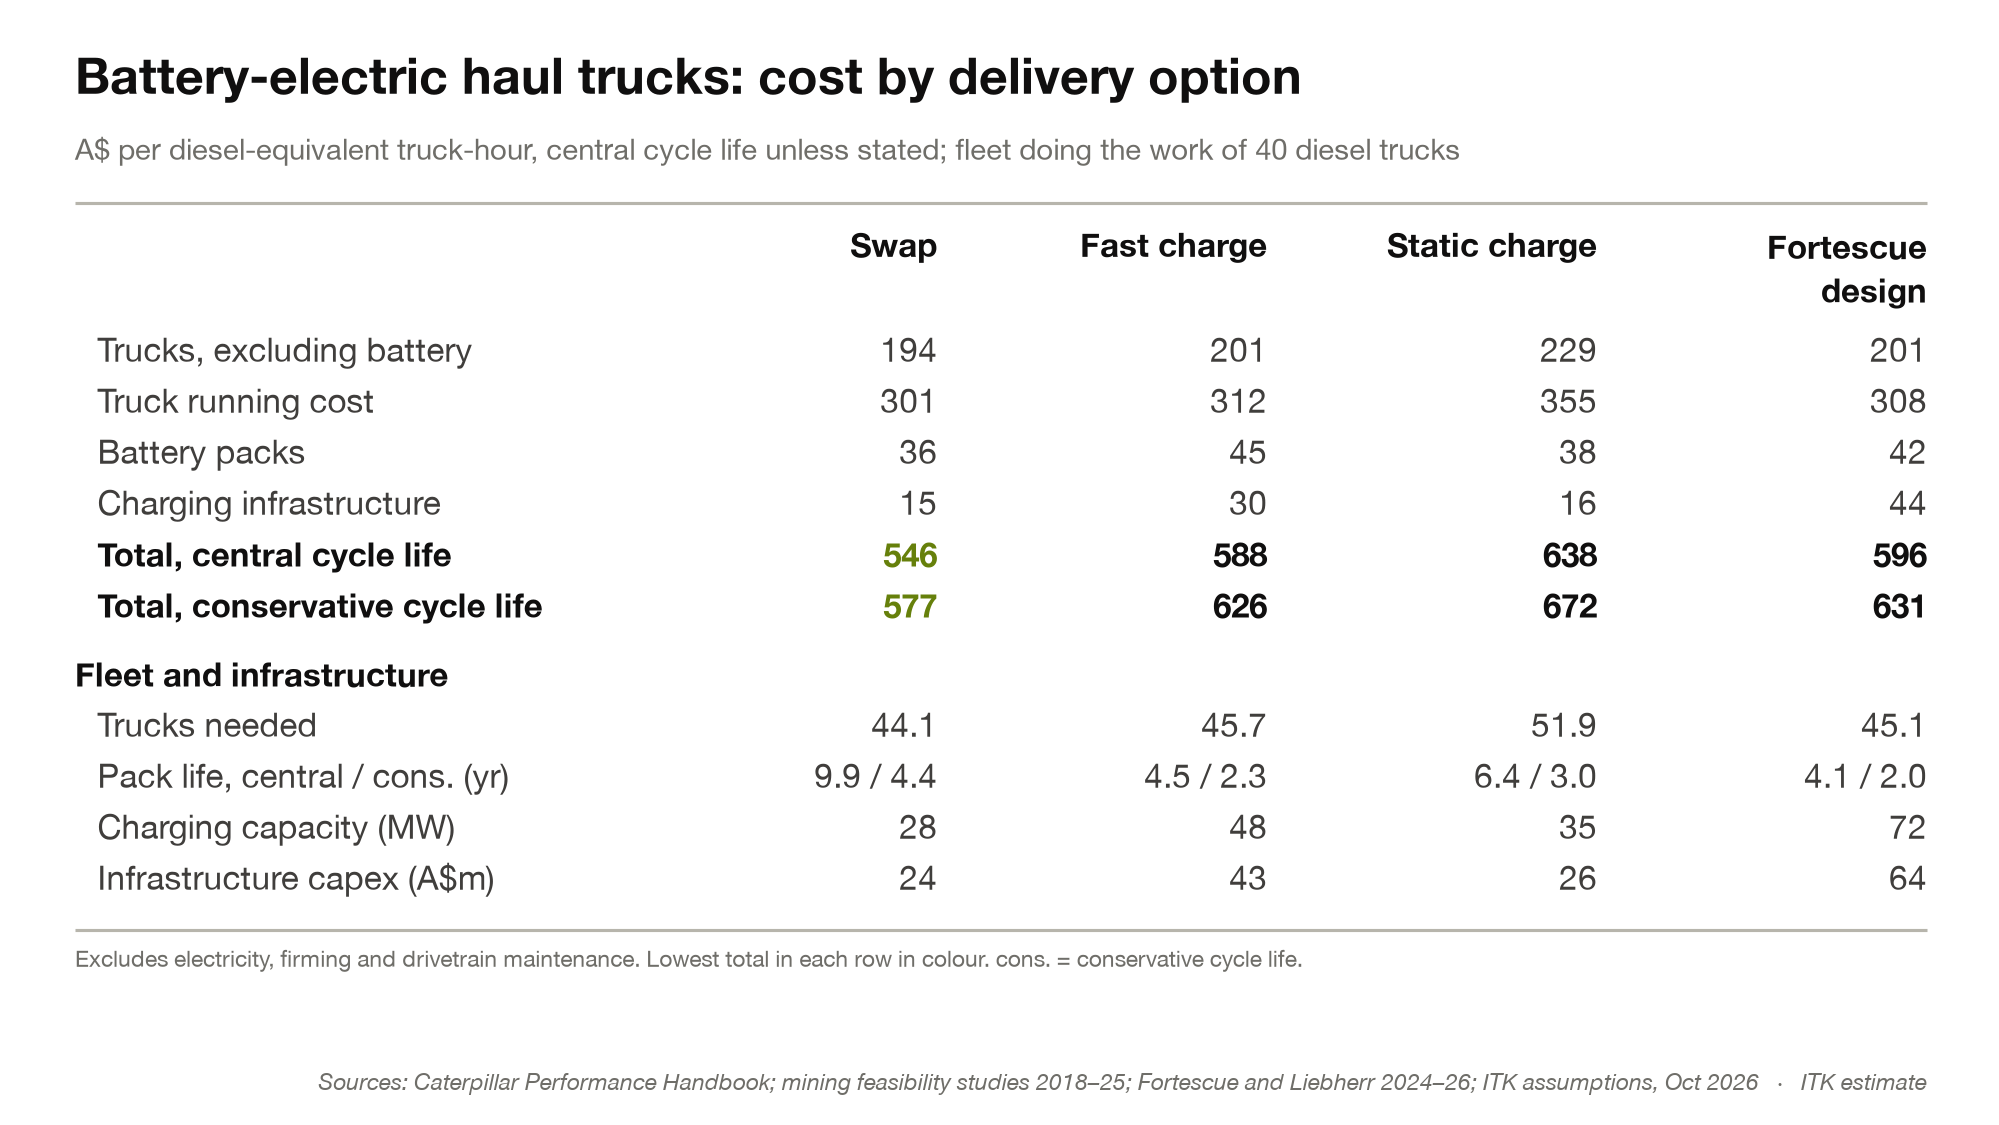
Cost by energy delivery option
A$ per diesel-equivalent truck-hour, before electricity.
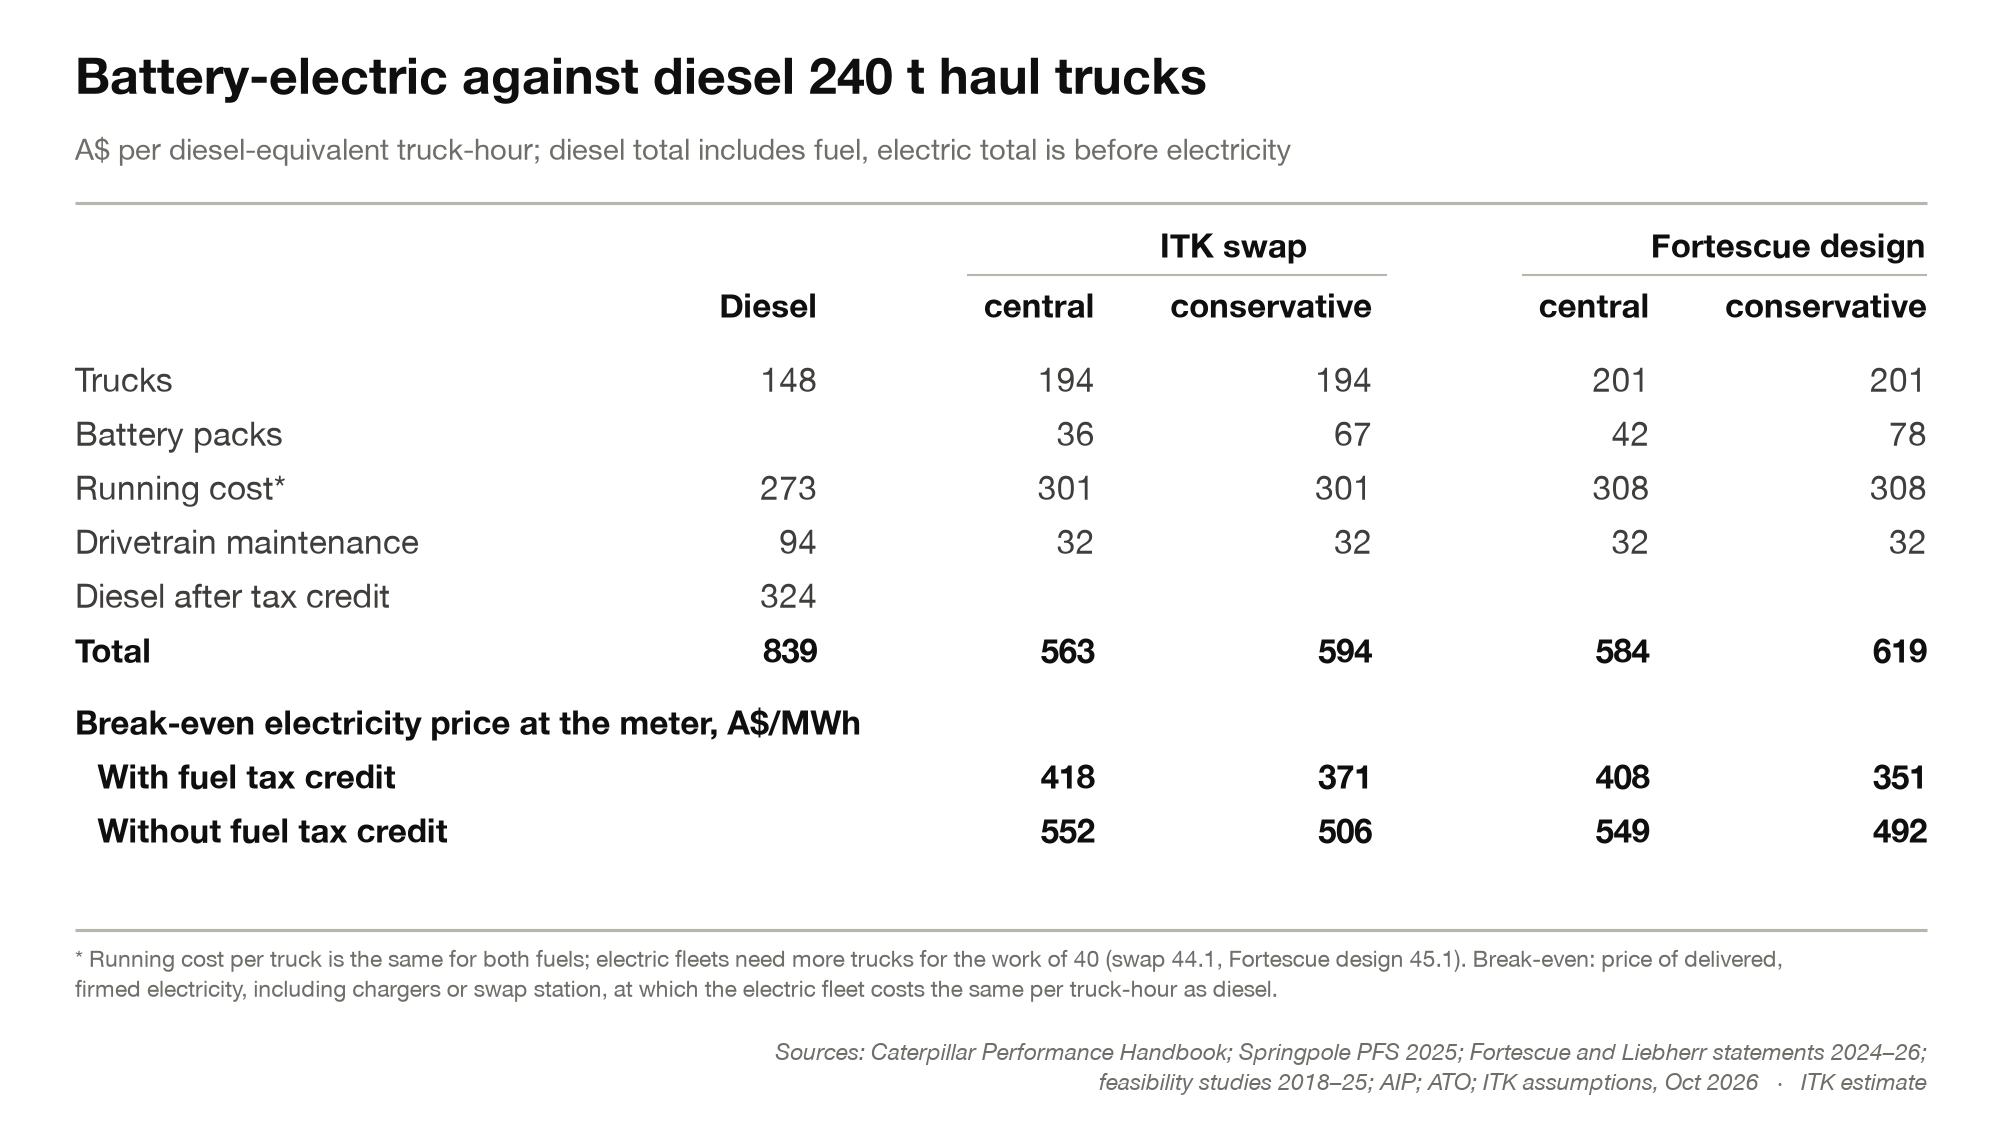
Electric against diesel, per truck-hour
Break-even electricity price A$408/MWh for the Fortescue design, with the fuel tax credit.
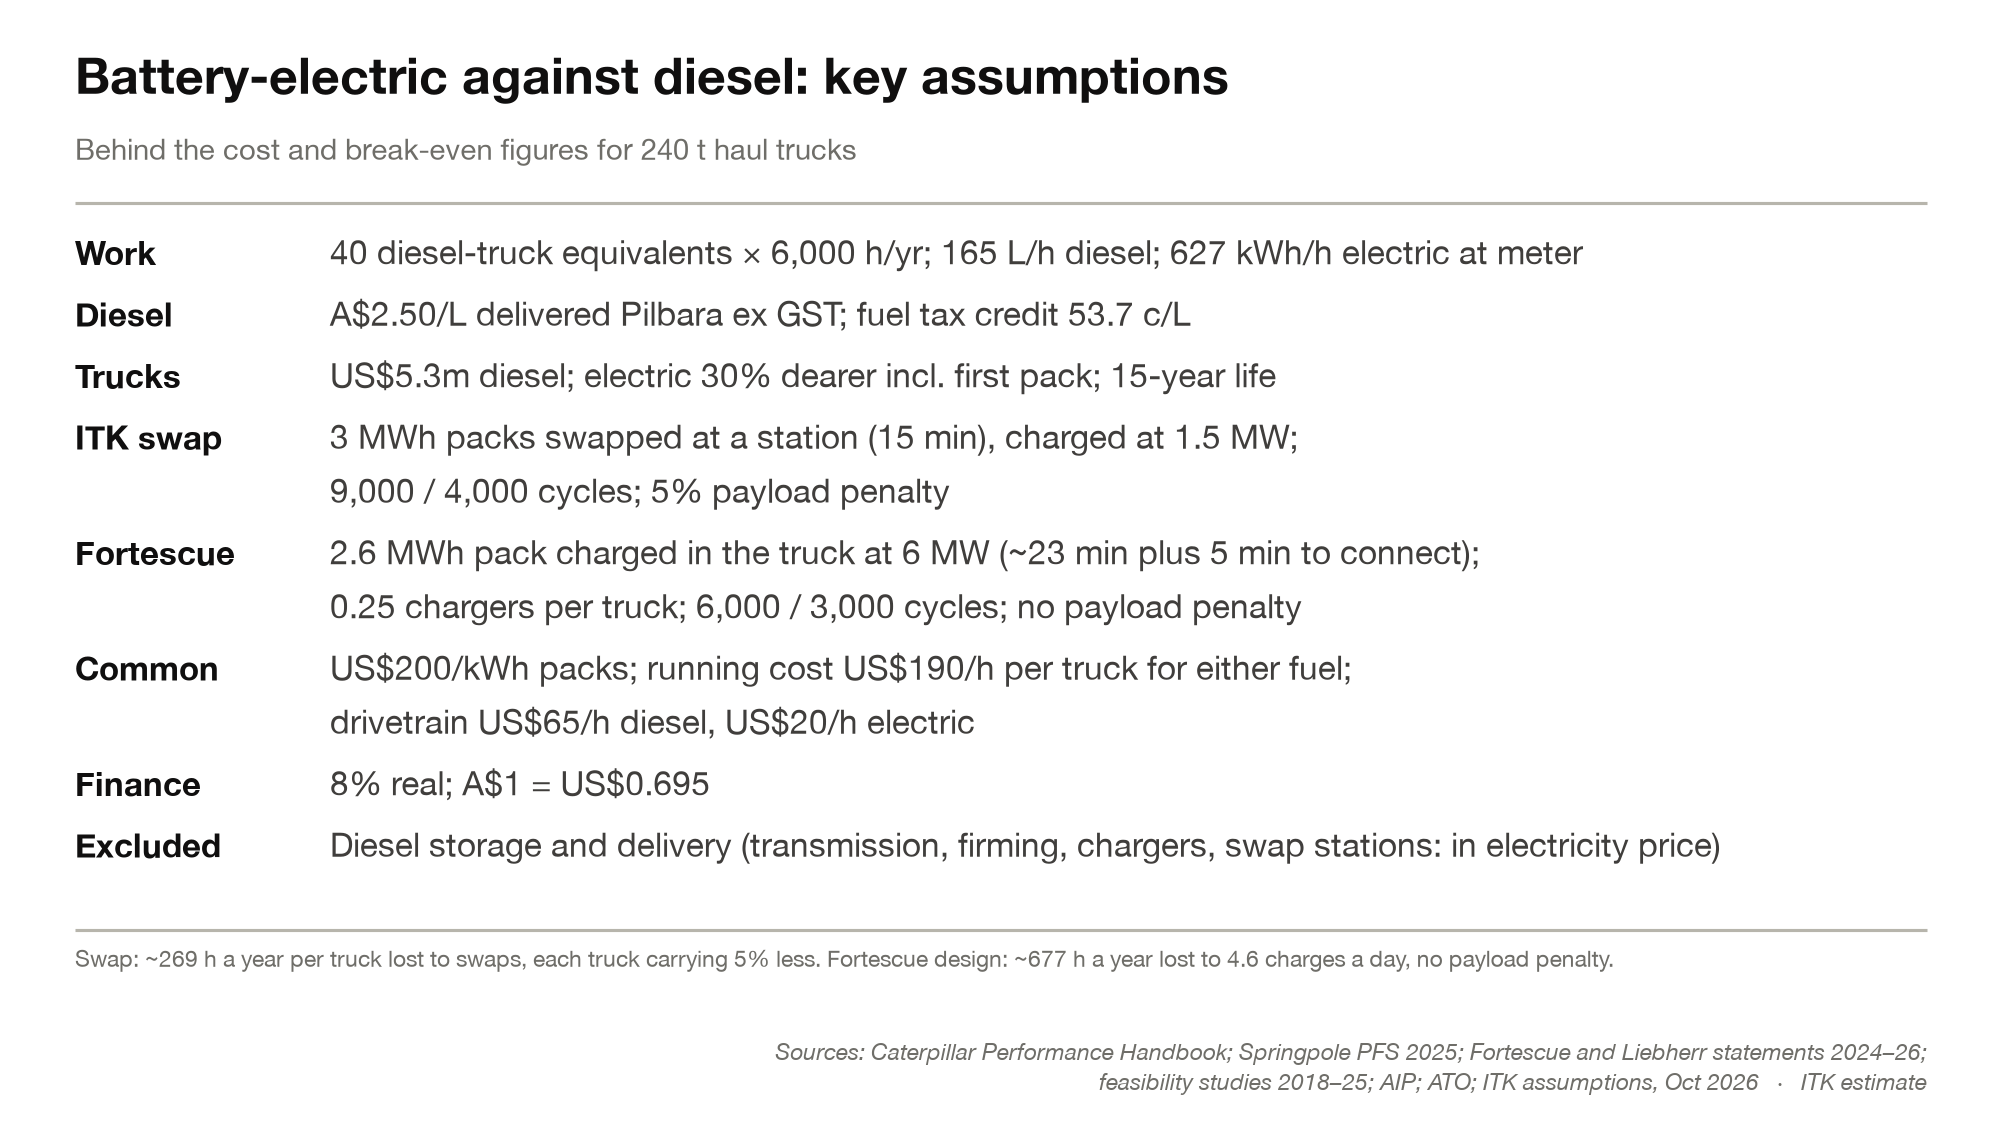
Electric against diesel: key assumptions
The inputs behind the truck-hour comparison.
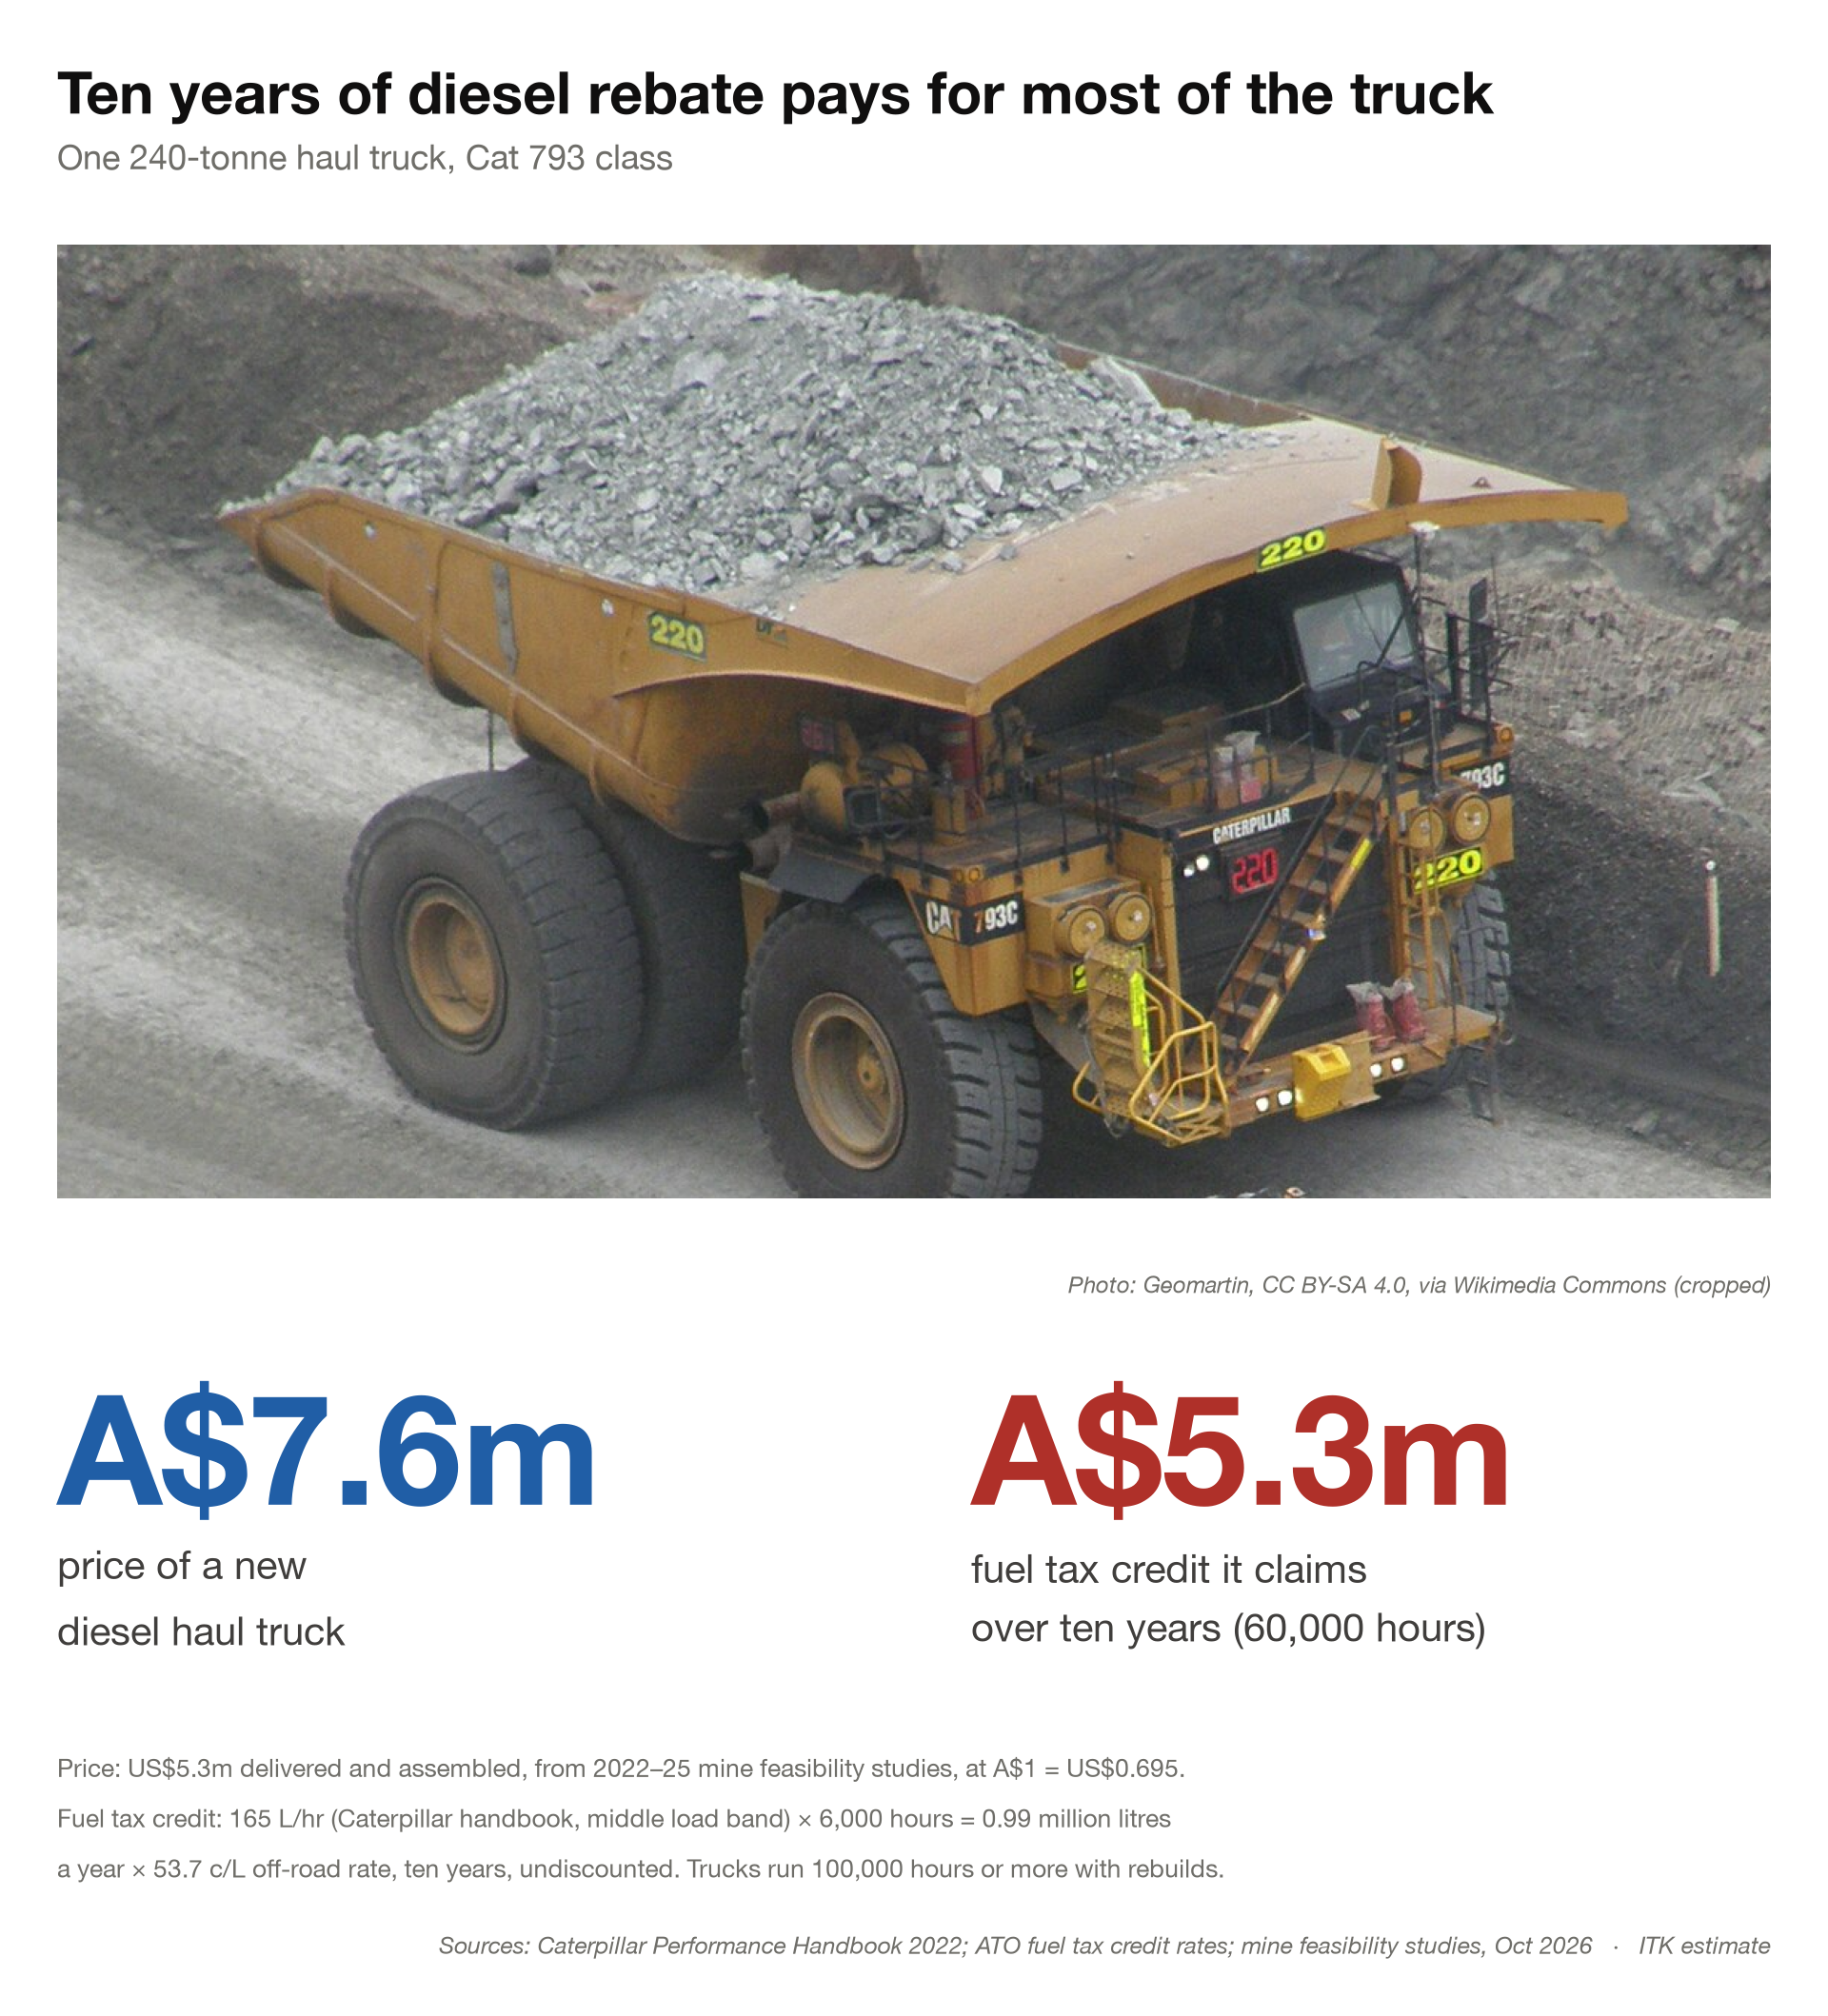
Ten years of diesel rebate pays for most of the truck
One 240 t truck costs A$7.6m and claims A$5.3m of fuel tax credit over ten years.
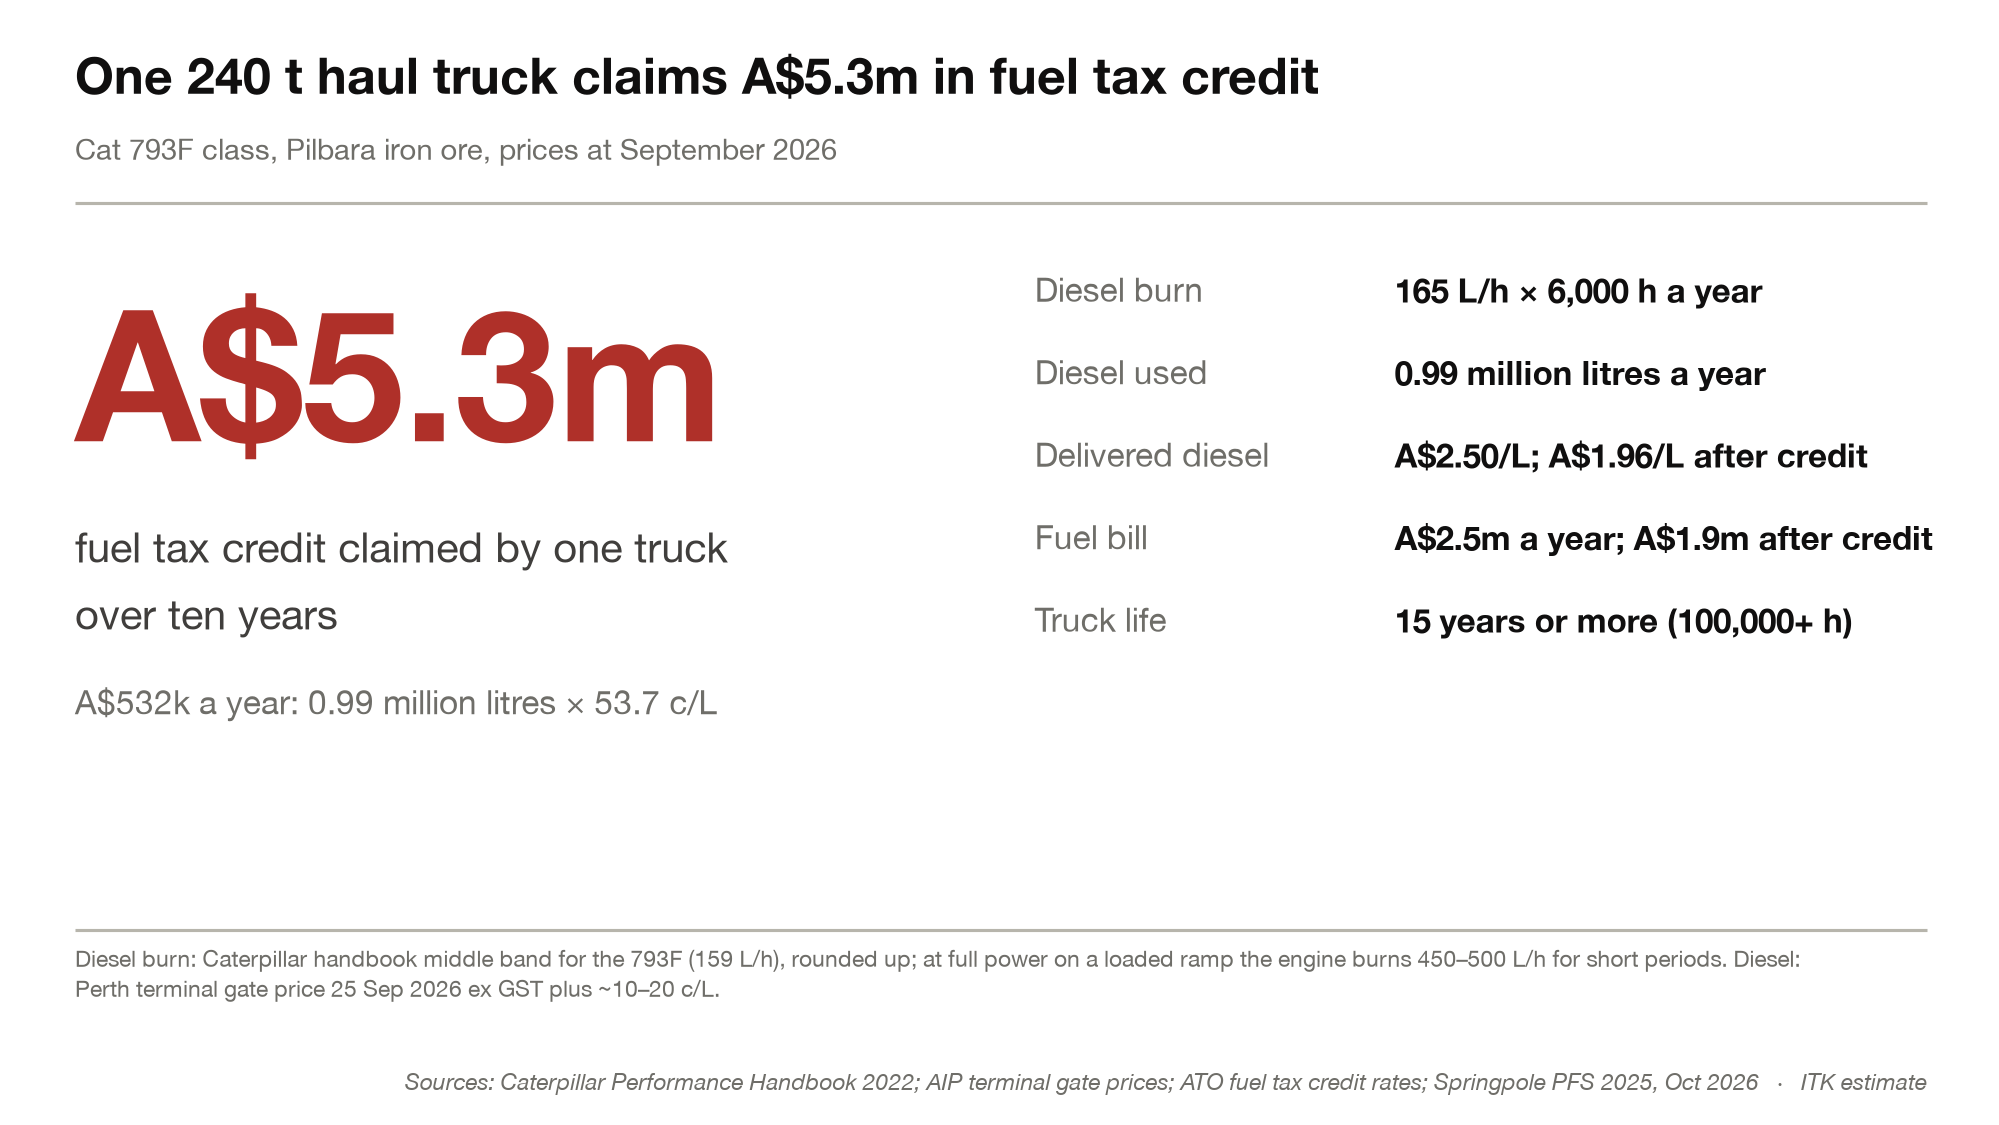
The fuel tax credit on one truck
A$532k a year of credit on 0.99 million litres.
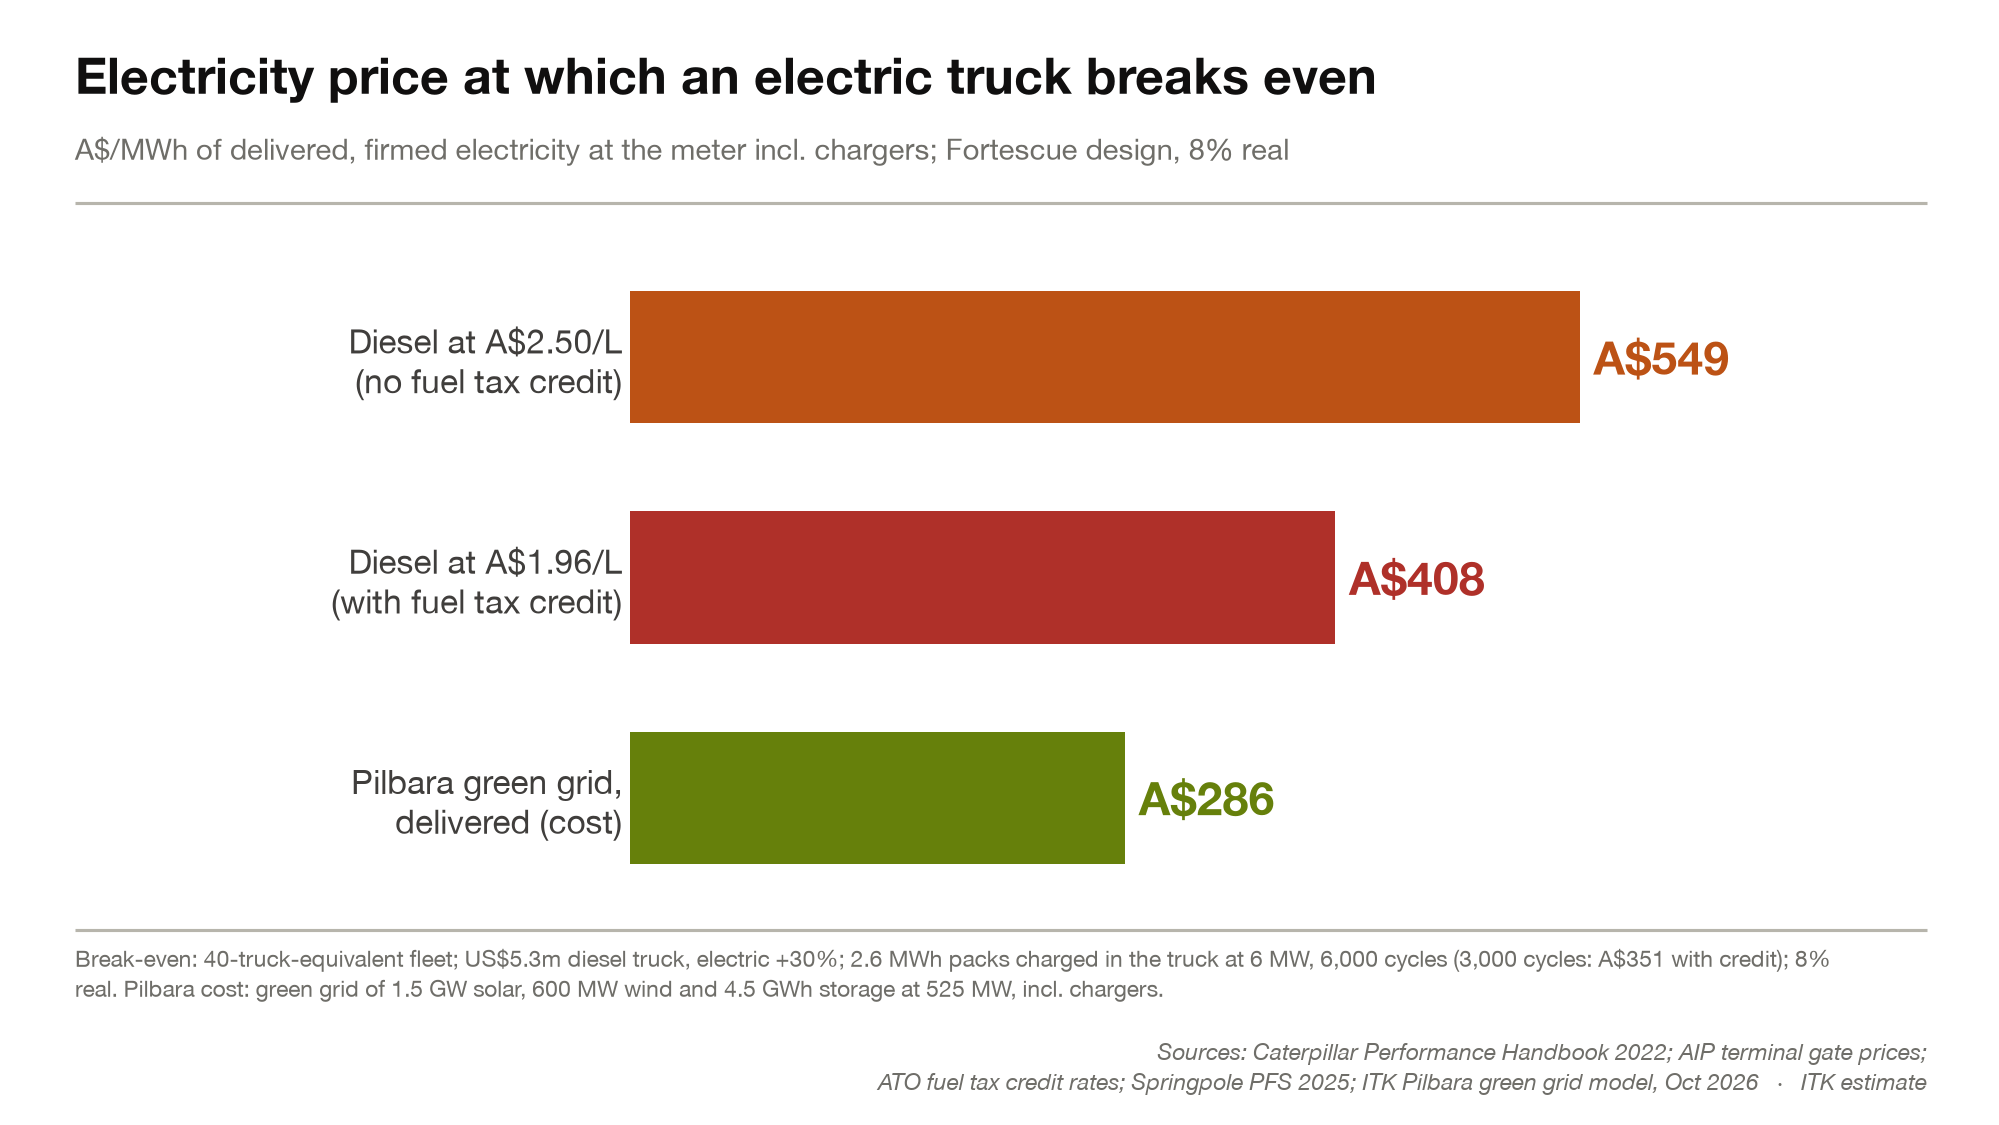
Electricity price at which an electric truck breaks even
A$549 without the credit, A$408 with it, against A$286 delivered from the green grid.
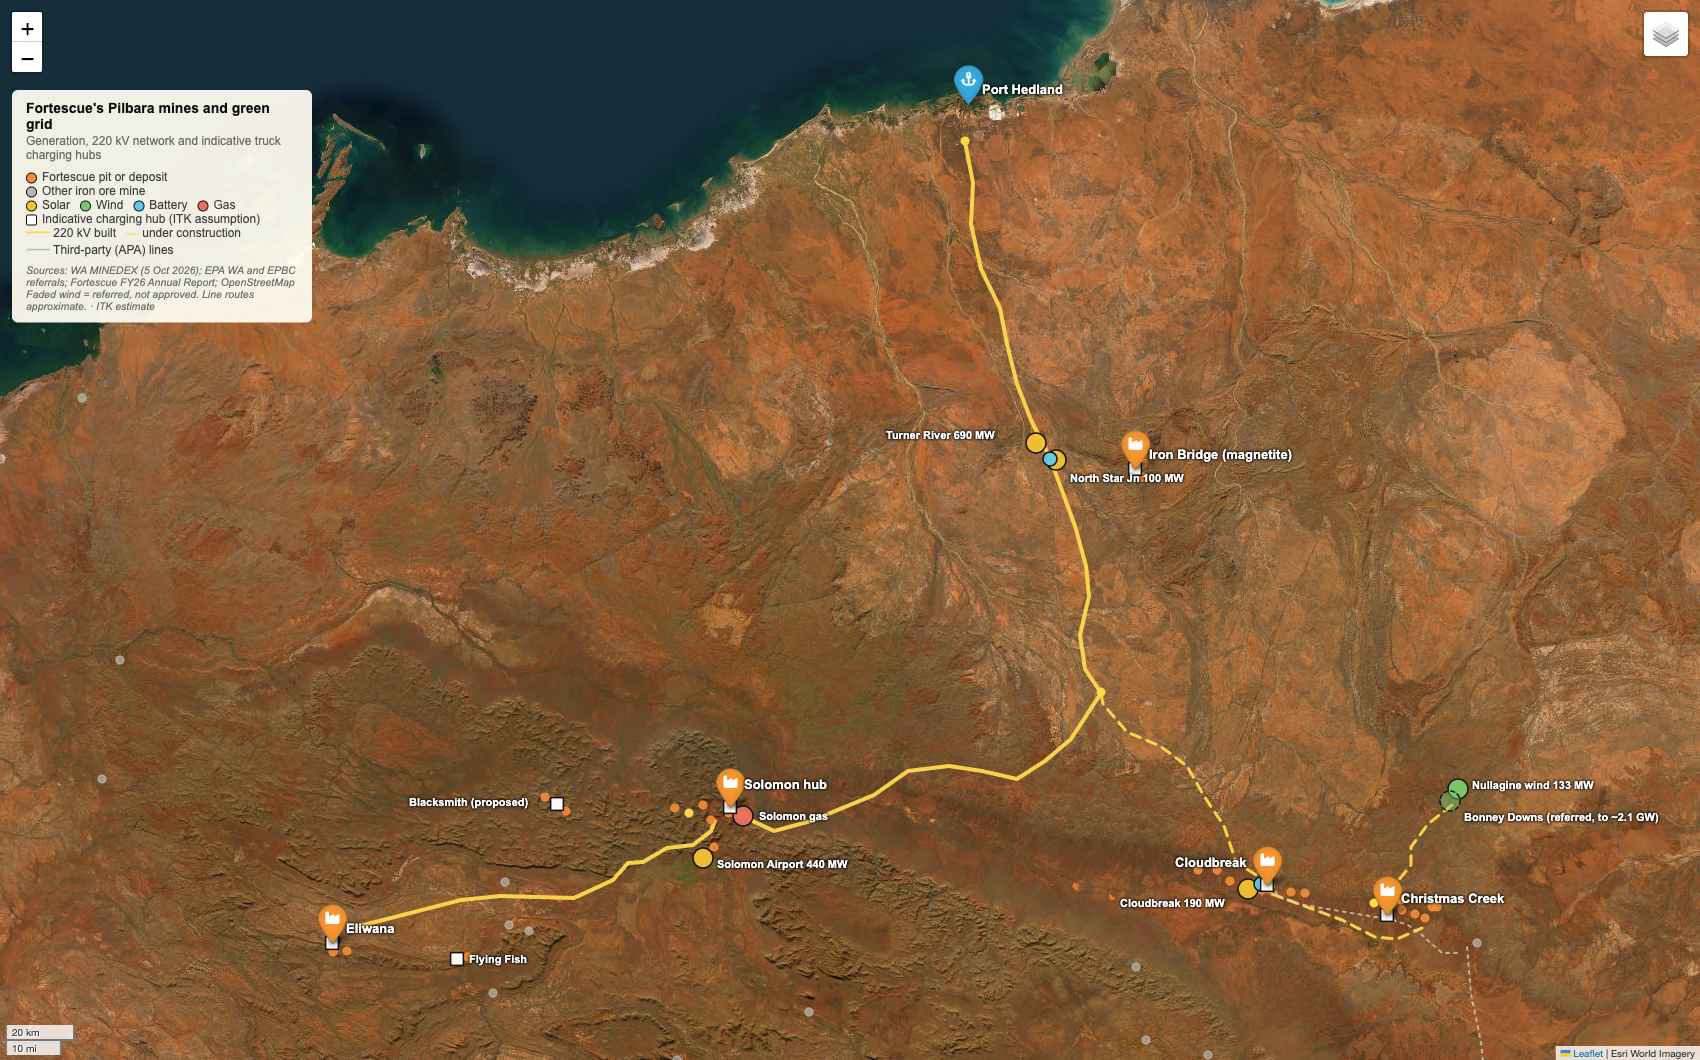
The grid on the map
Fortescue’s mines, solar and wind sites, 220 kV transmission and indicative charging hubs.
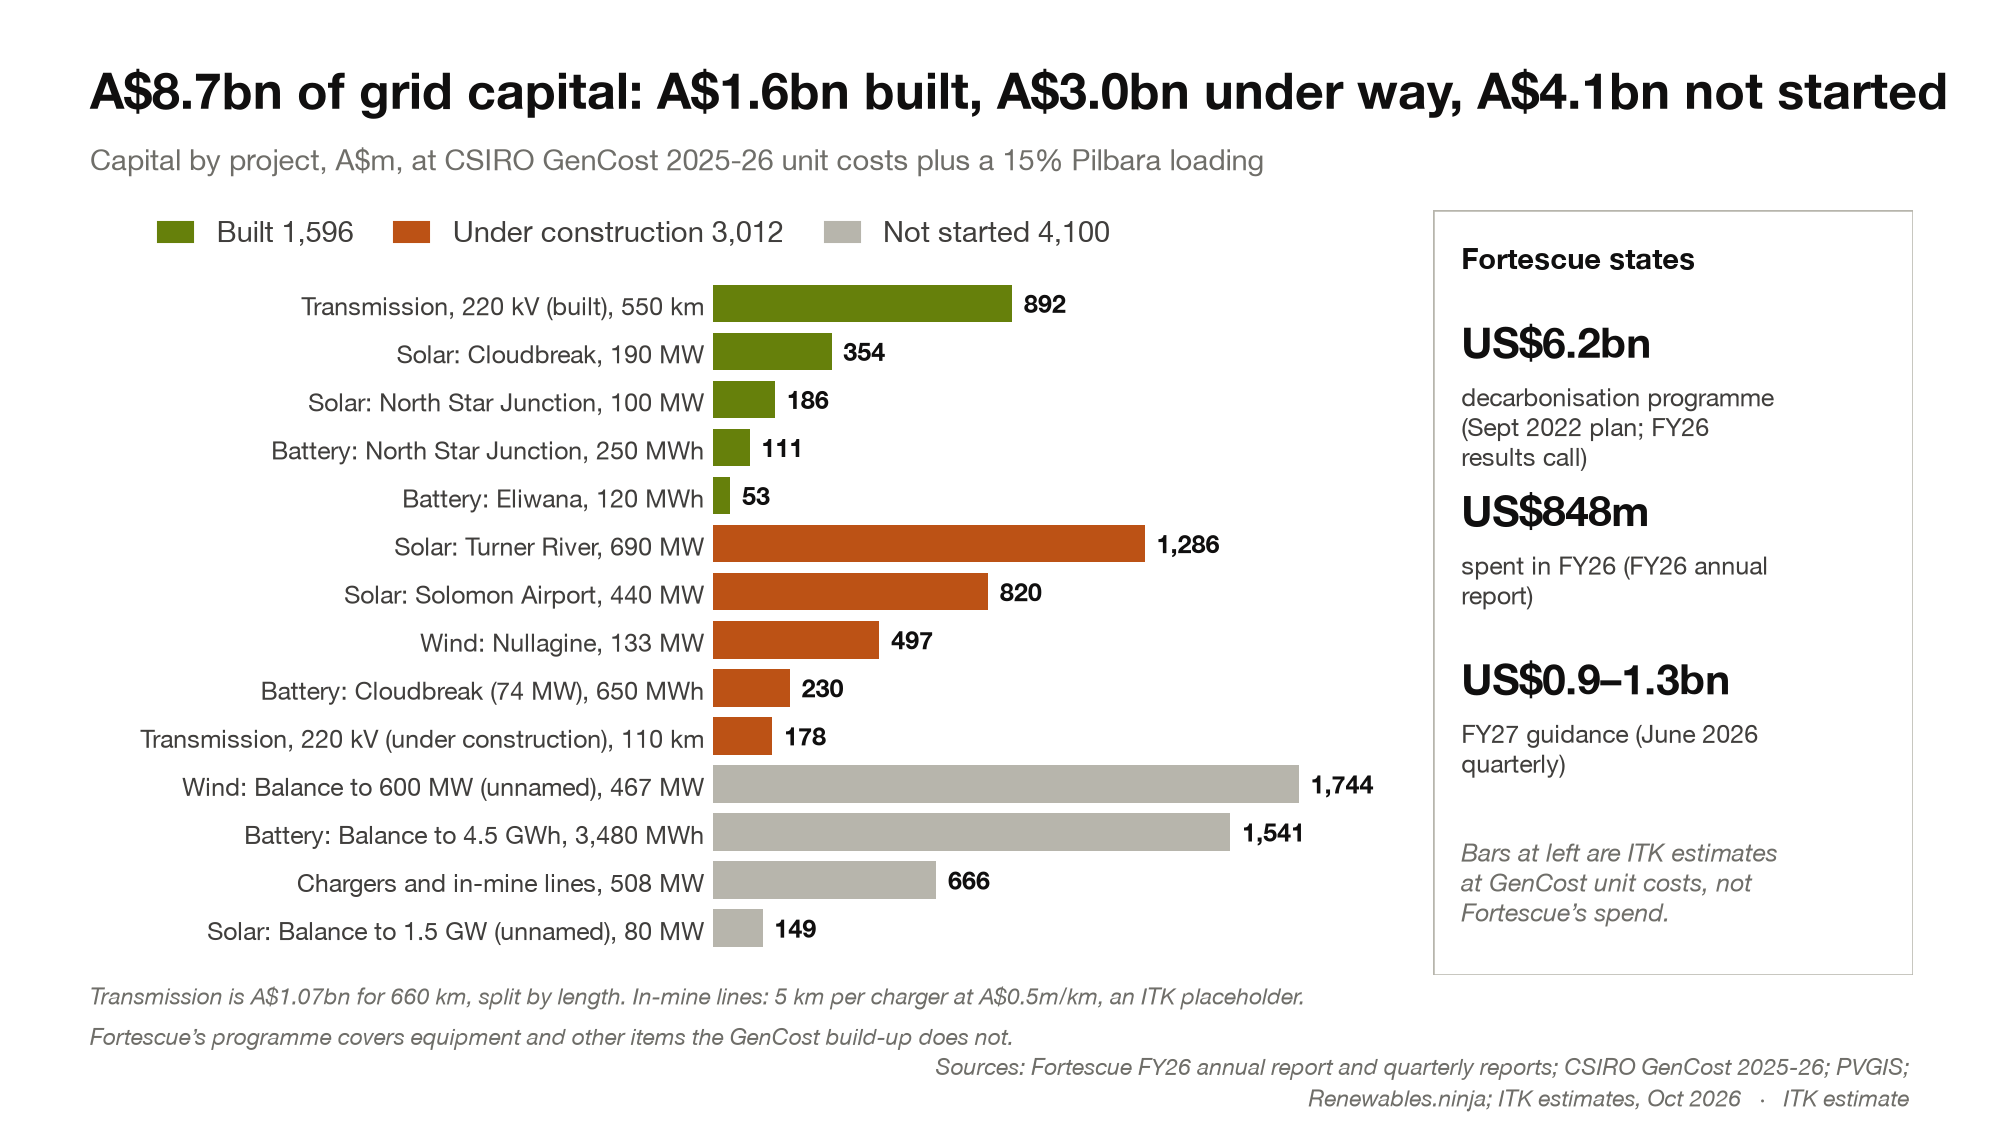
Investments by project and build status
A$8.7bn of grid capital: A$1.6bn built, A$3.0bn under construction, A$4.1bn not started.
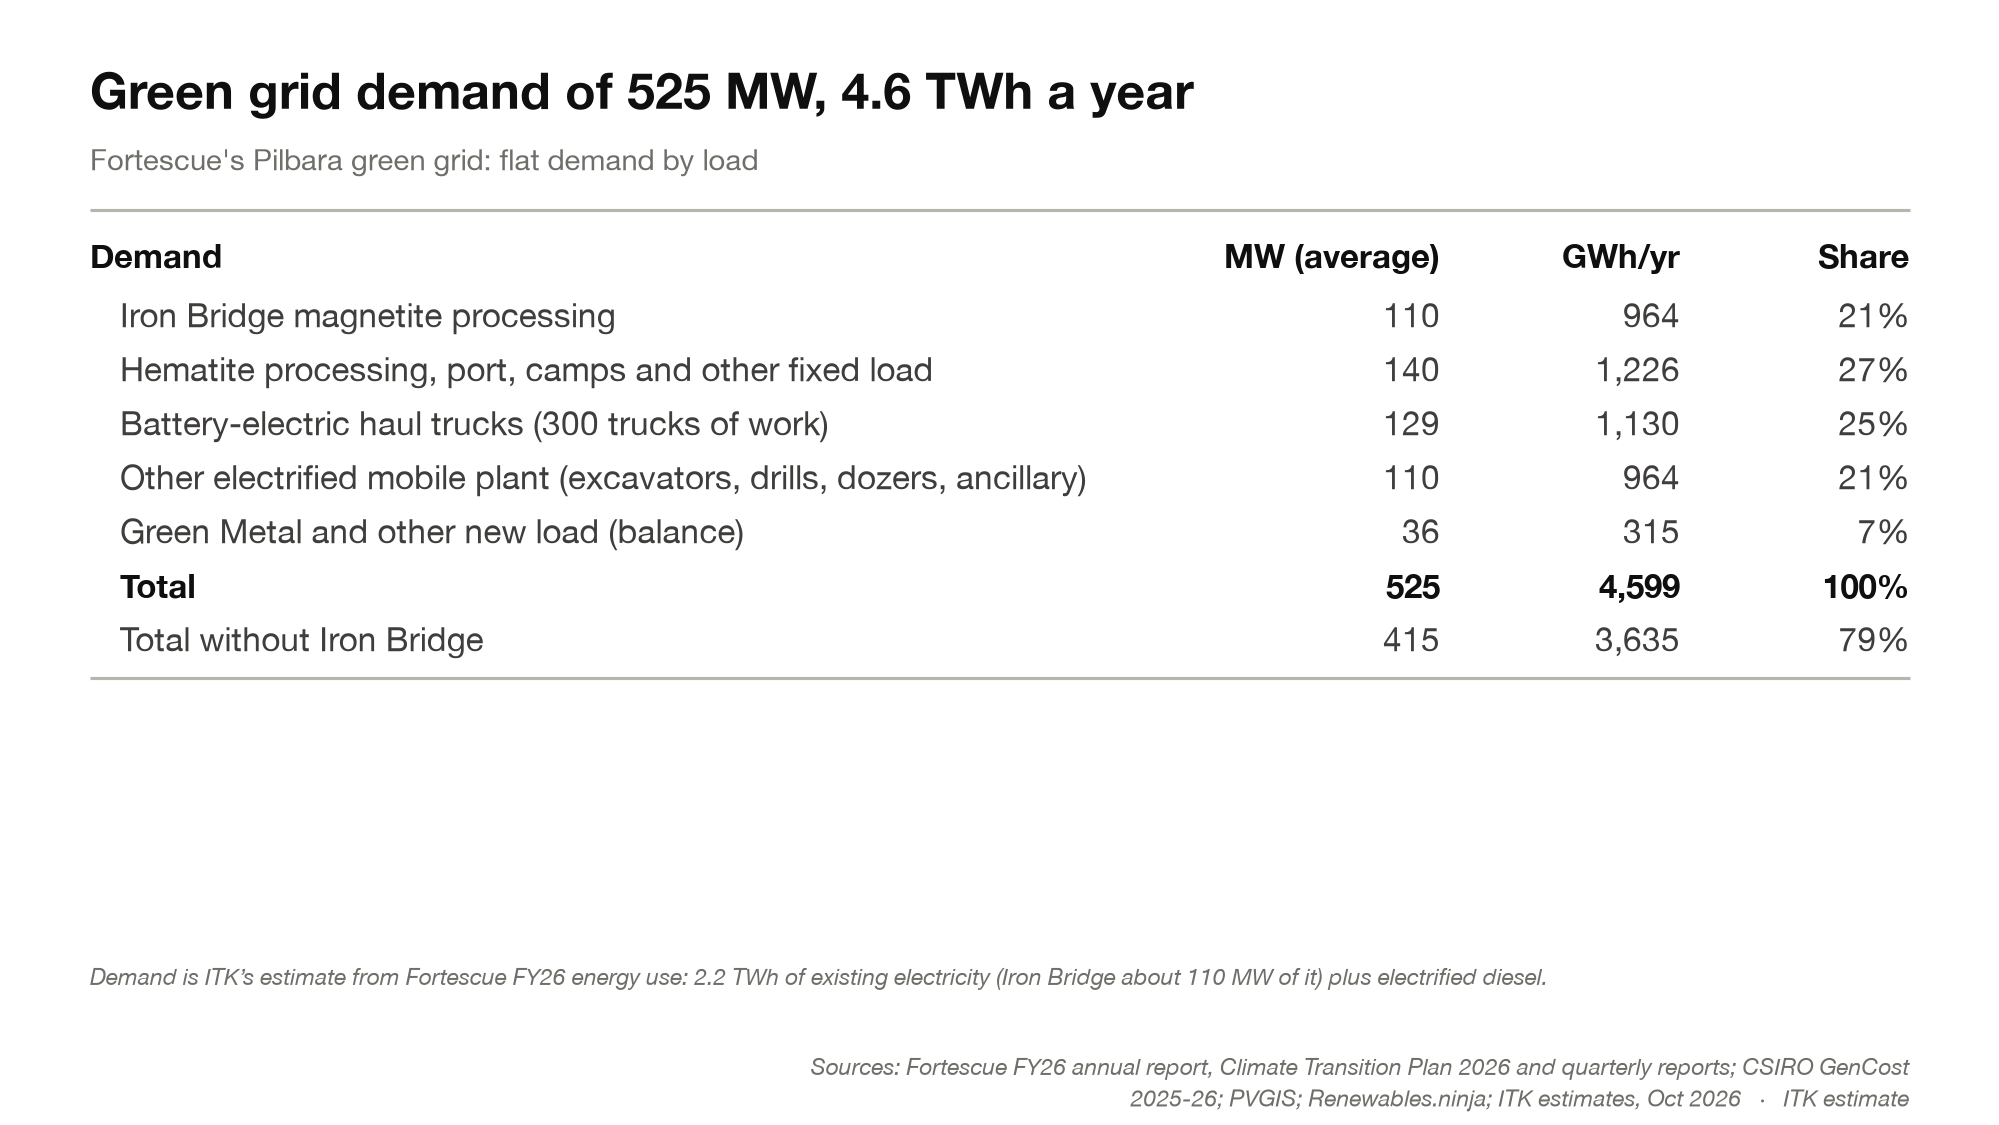
Green grid demand
525 MW of flat demand, 4.6 TWh a year.
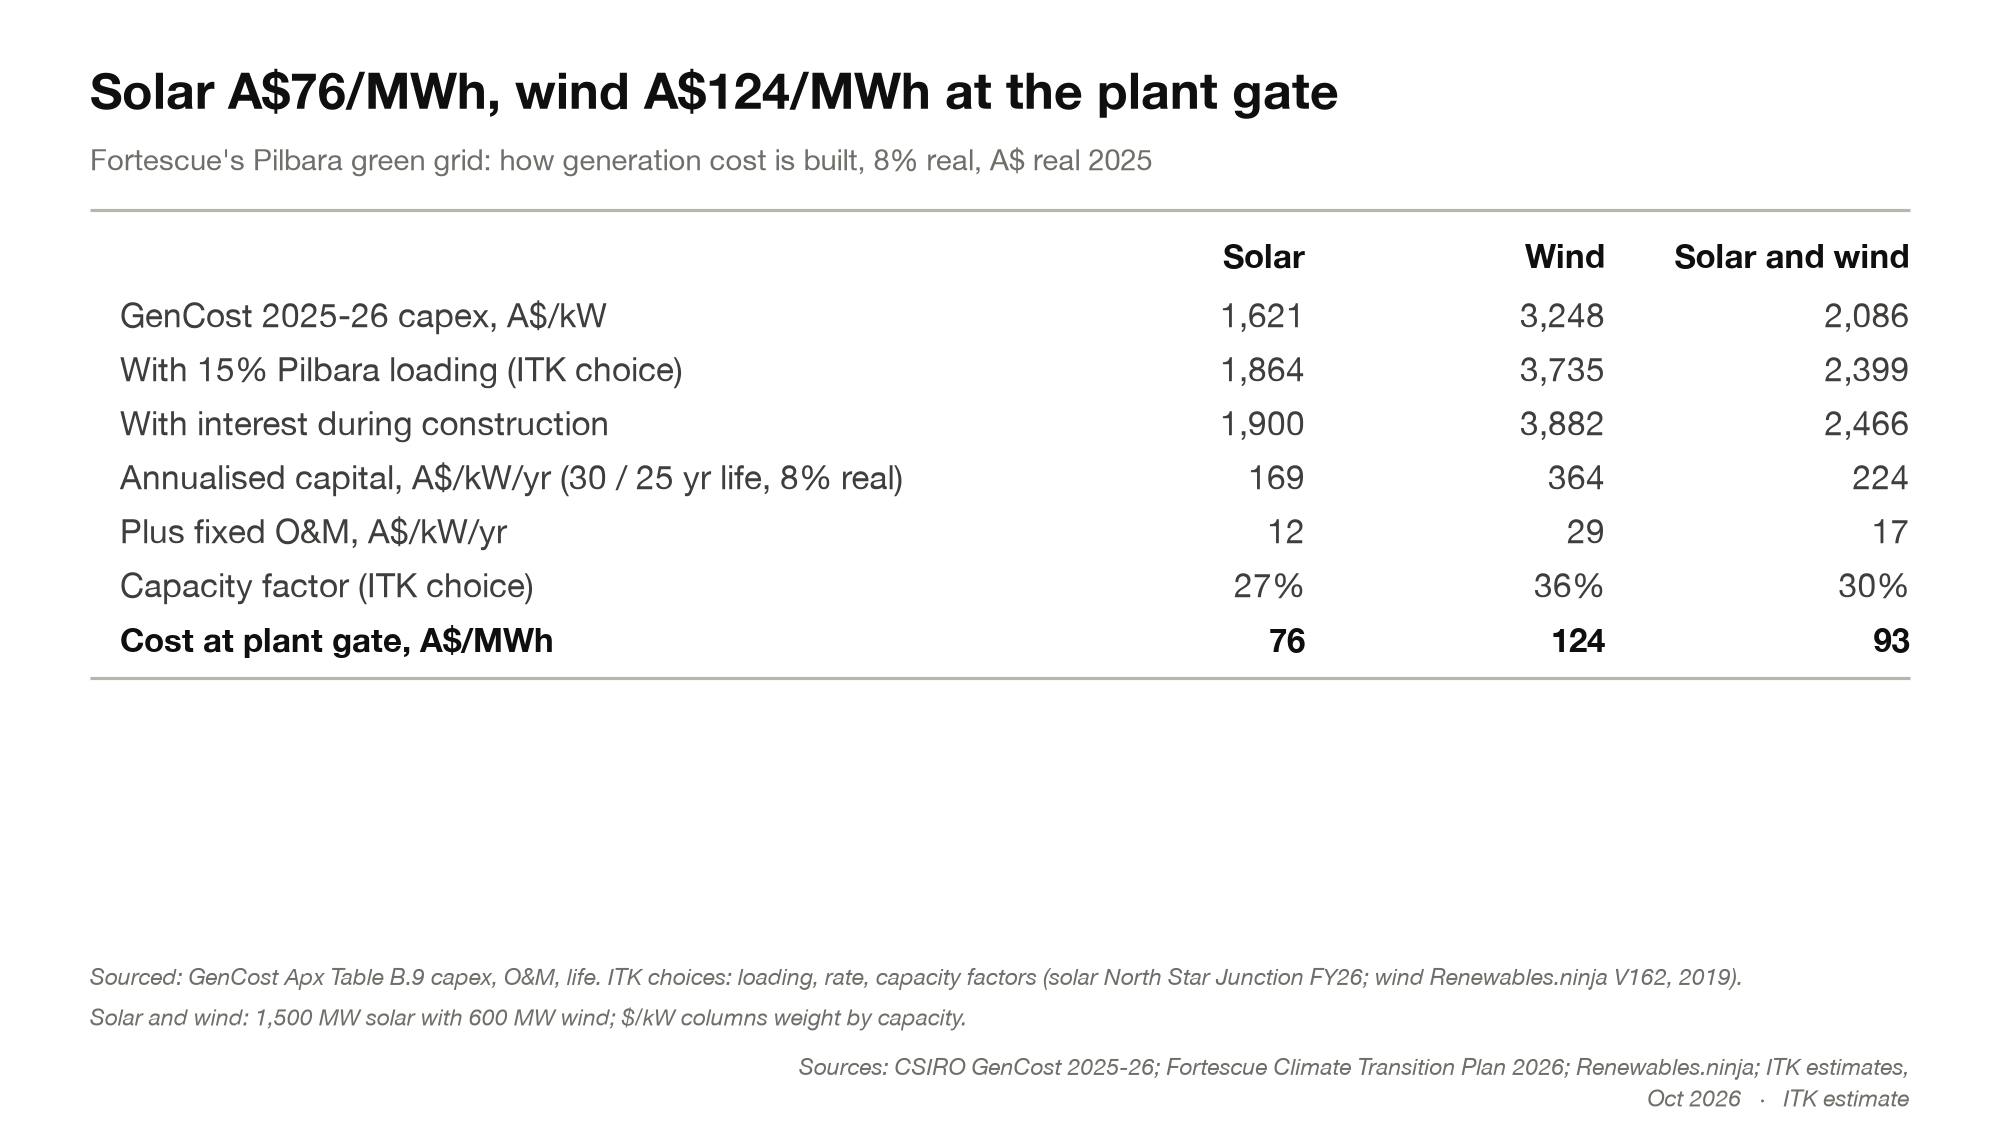
How generation cost is built
Solar A$76/MWh, wind A$124/MWh at the plant gate, A$93 blended.
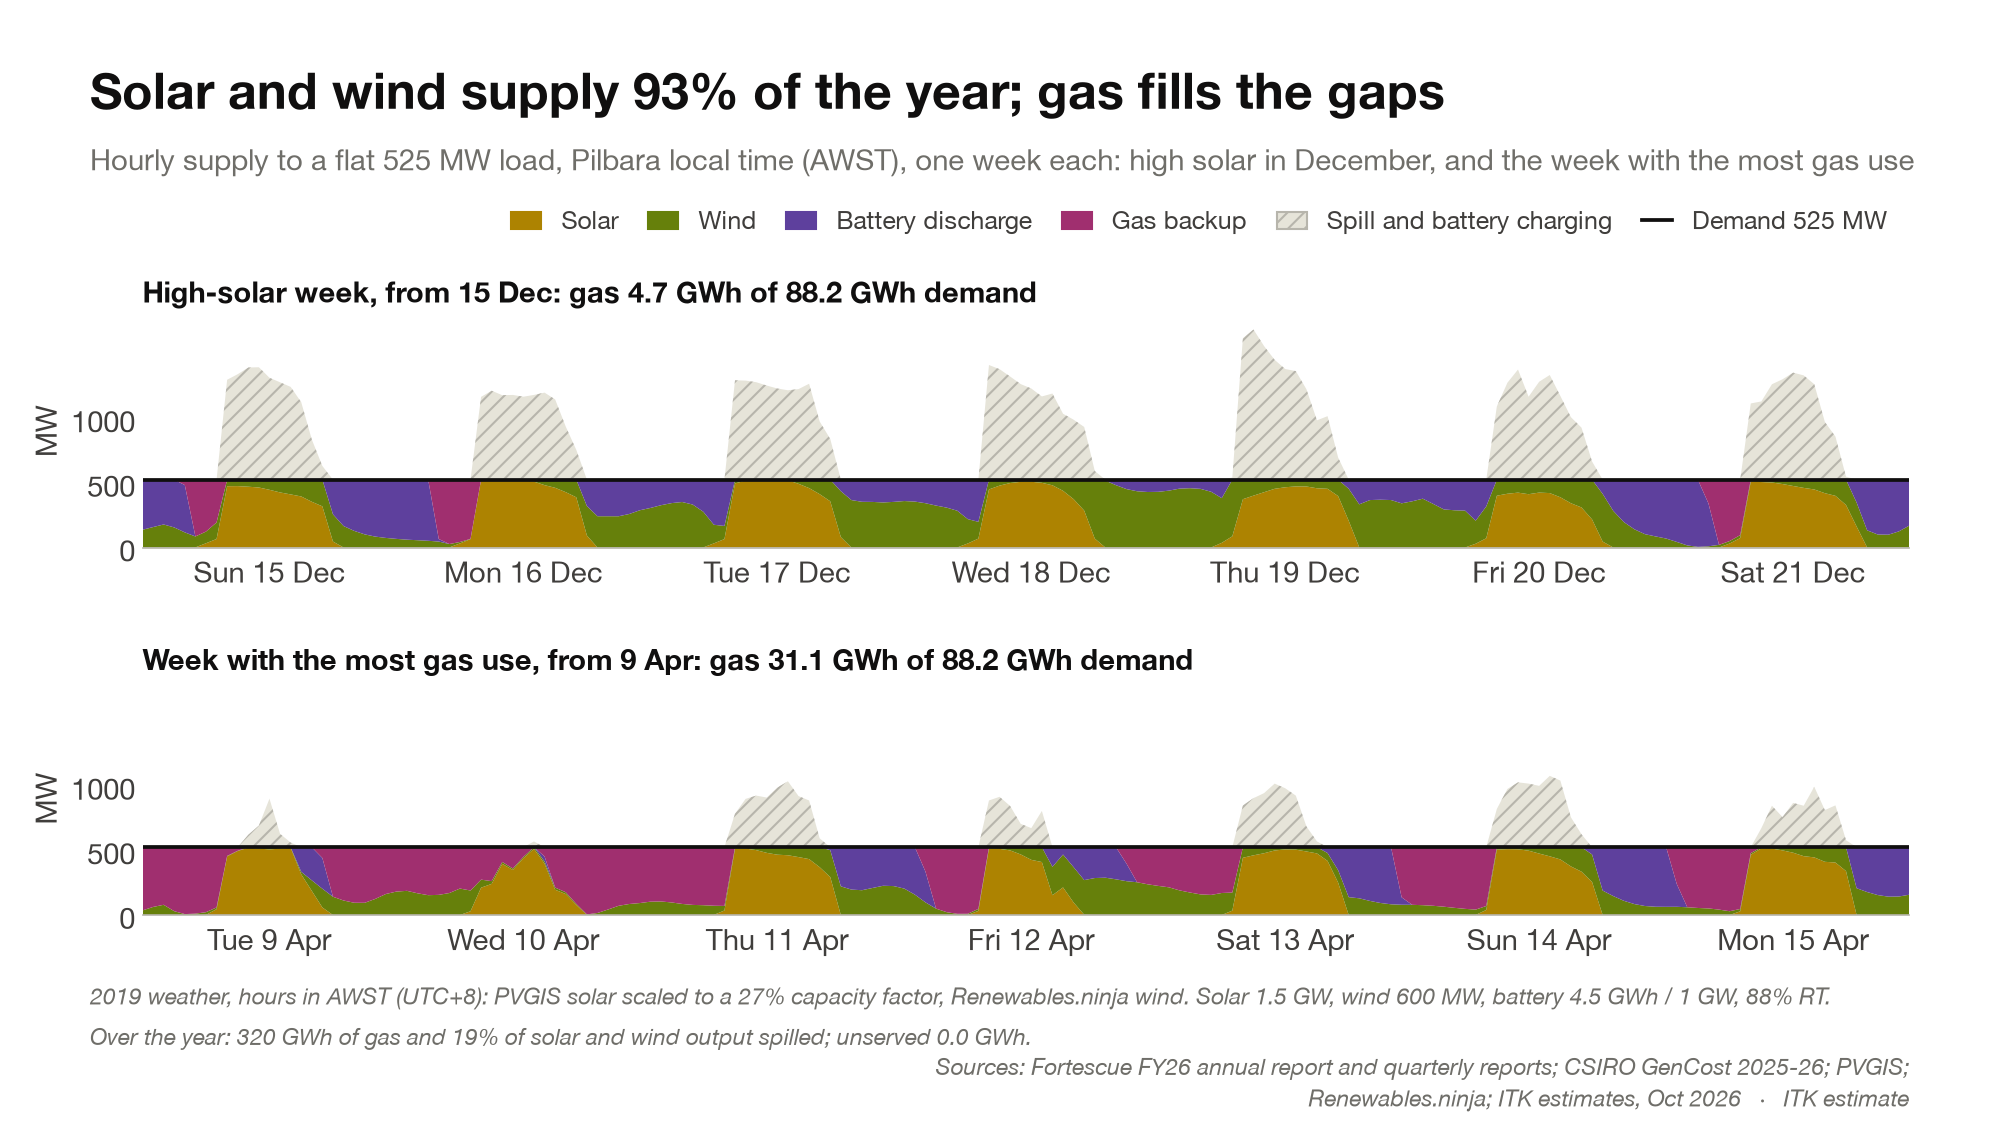
How the grid runs hour by hour
Solar and wind supply 93% of a flat 525 MW load; gas fills the gaps.
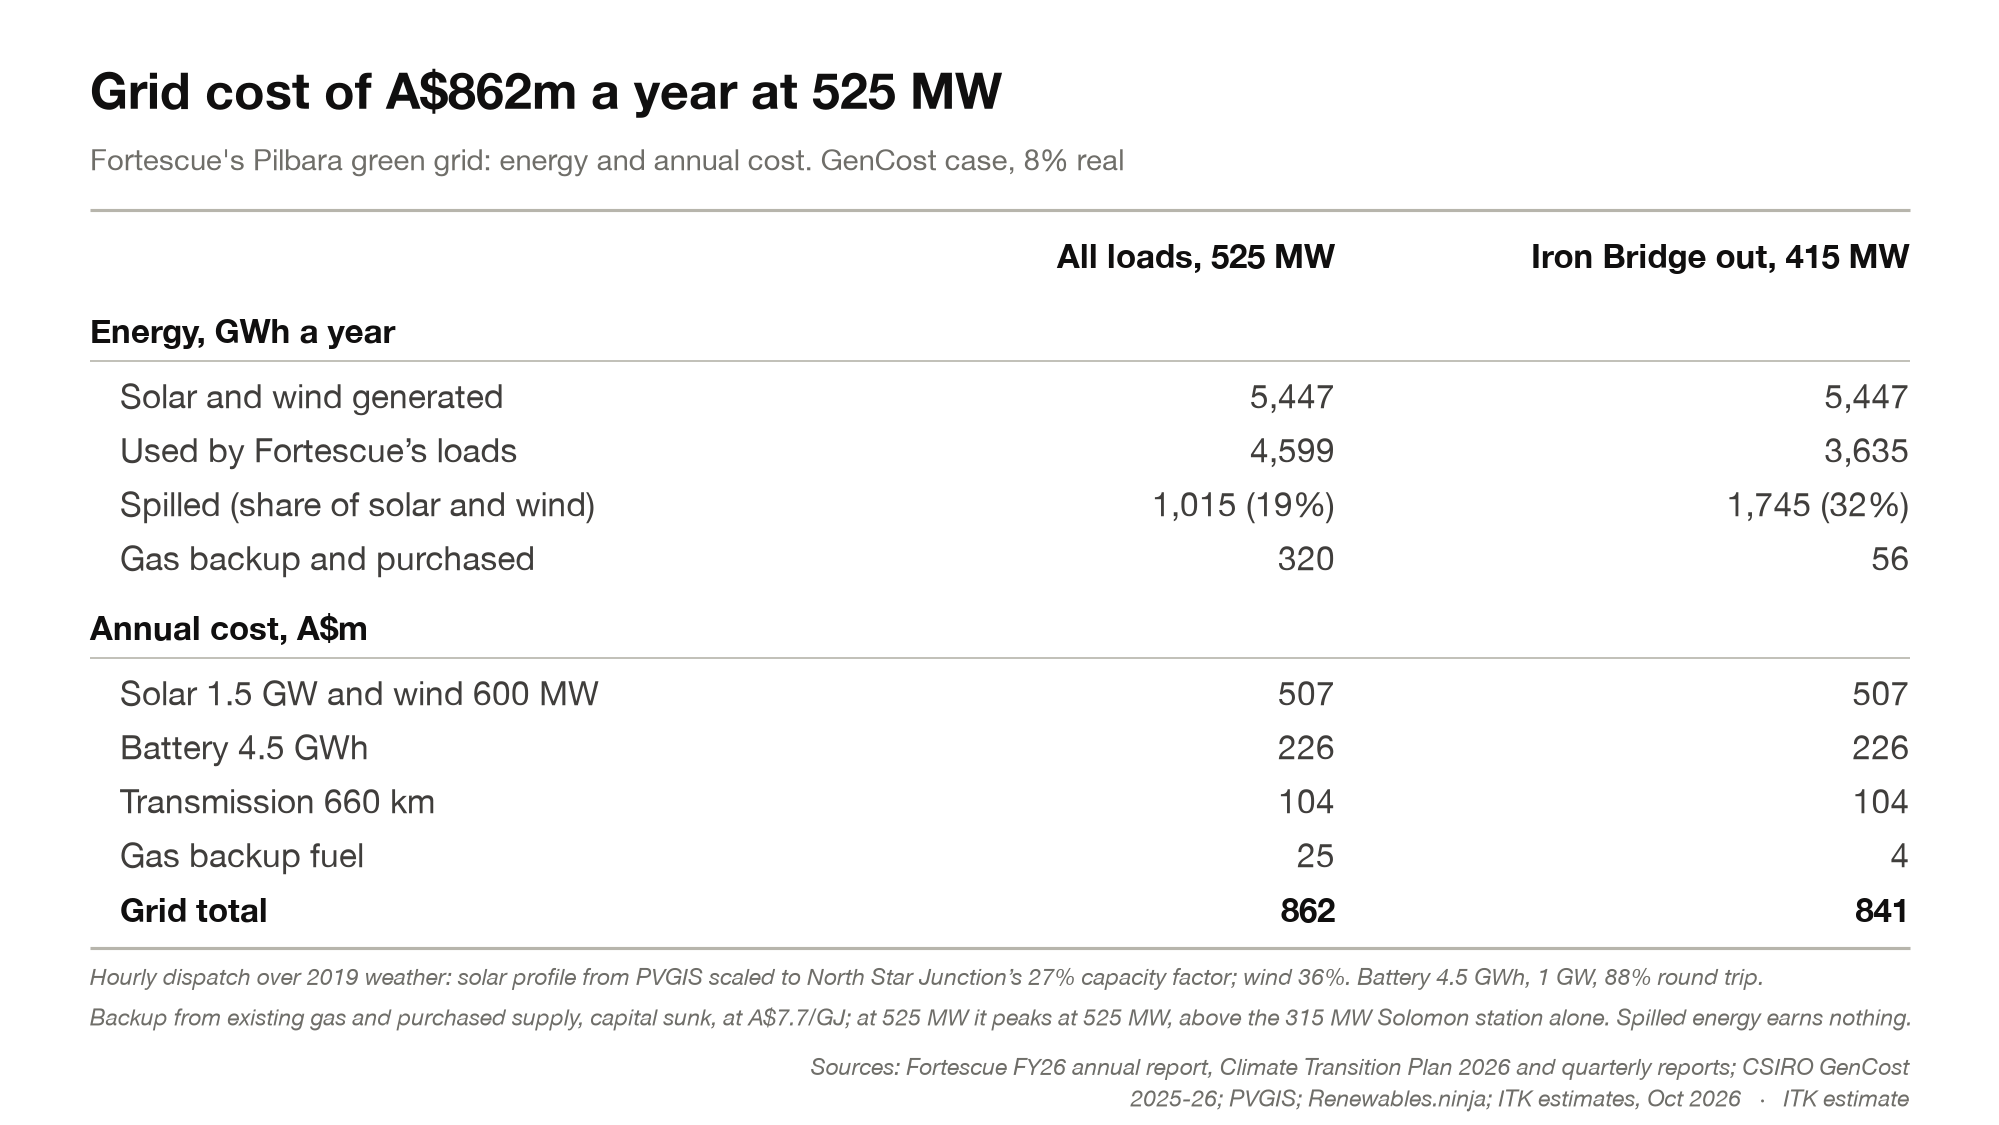
Energy and annual cost of the grid
A$862m a year at 525 MW.
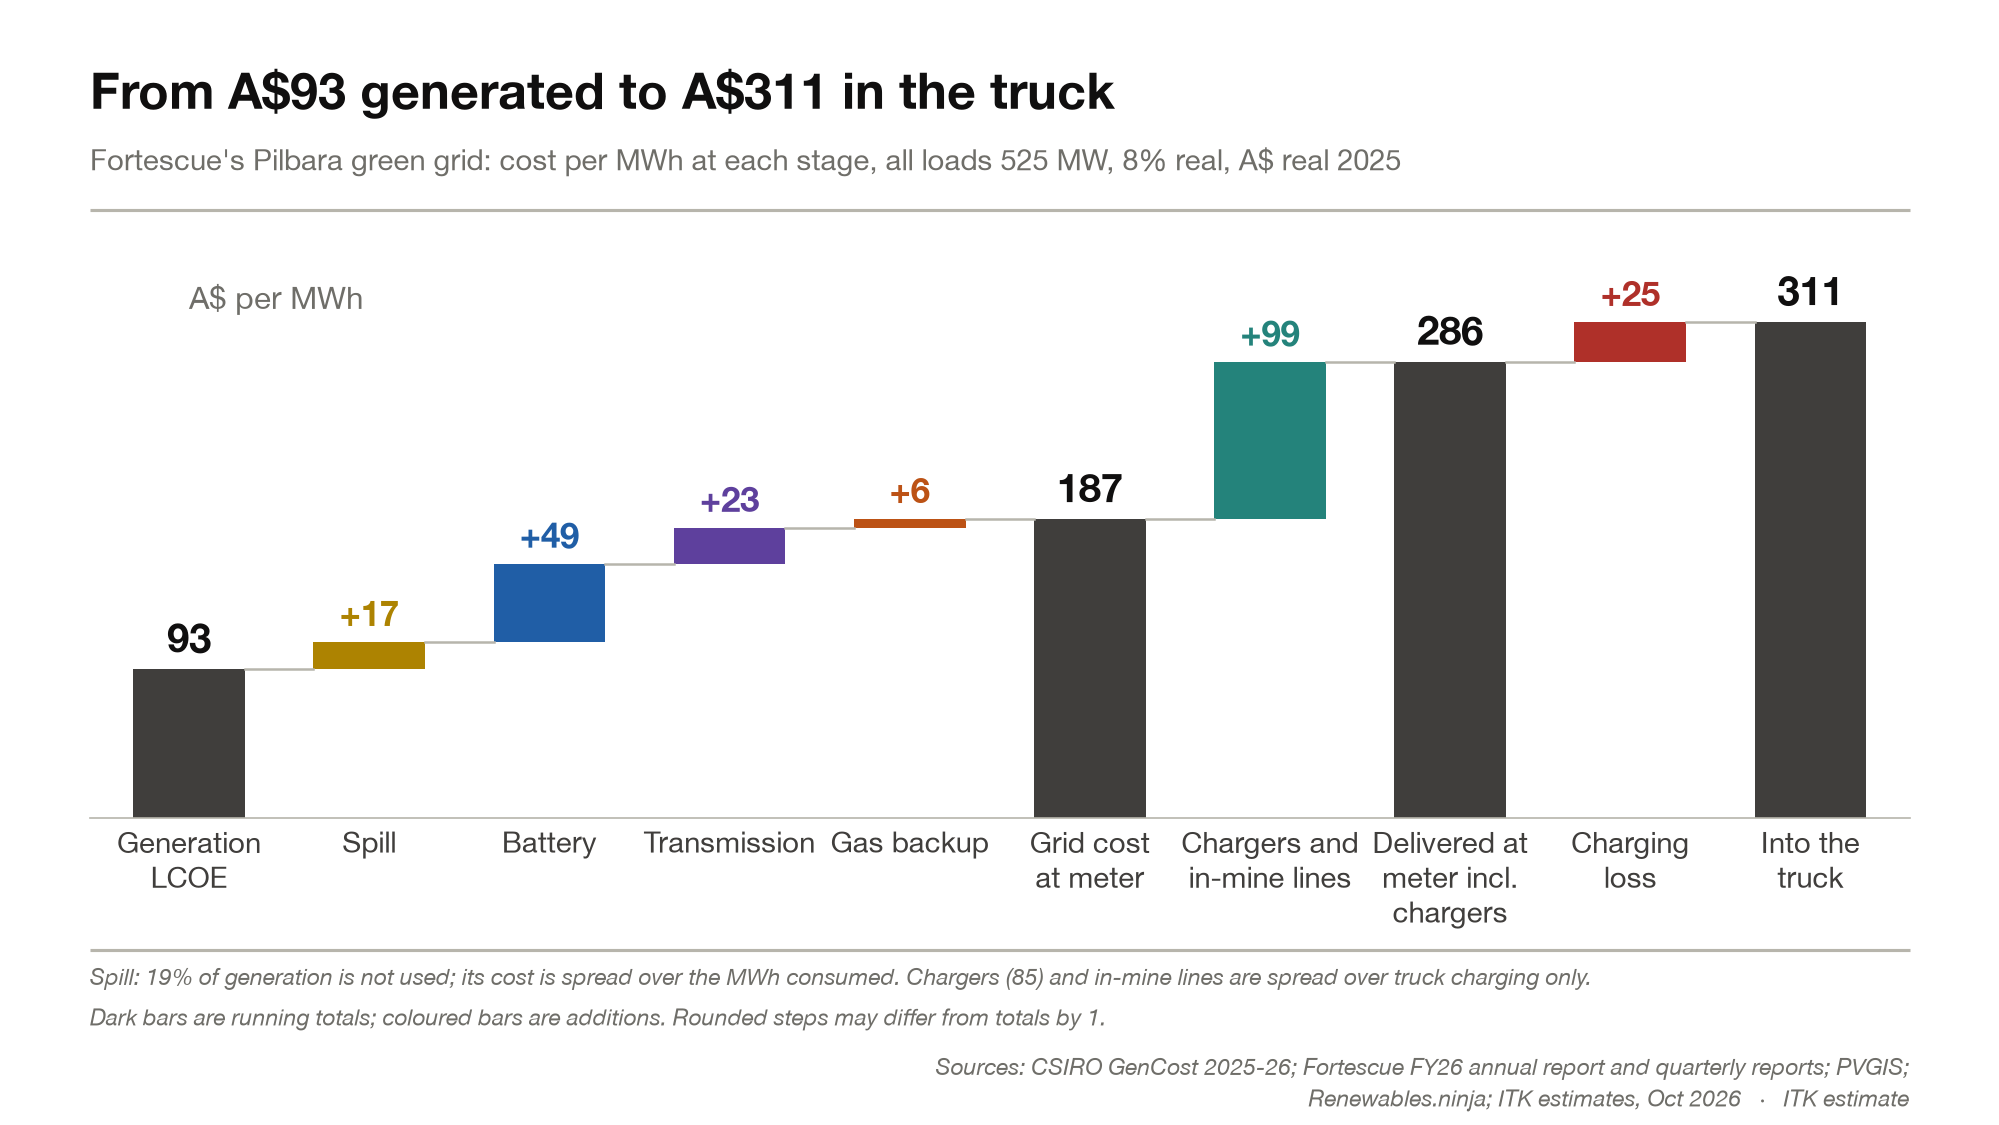
From generation to the truck
A$93/MWh generated becomes A$311/MWh in the truck.
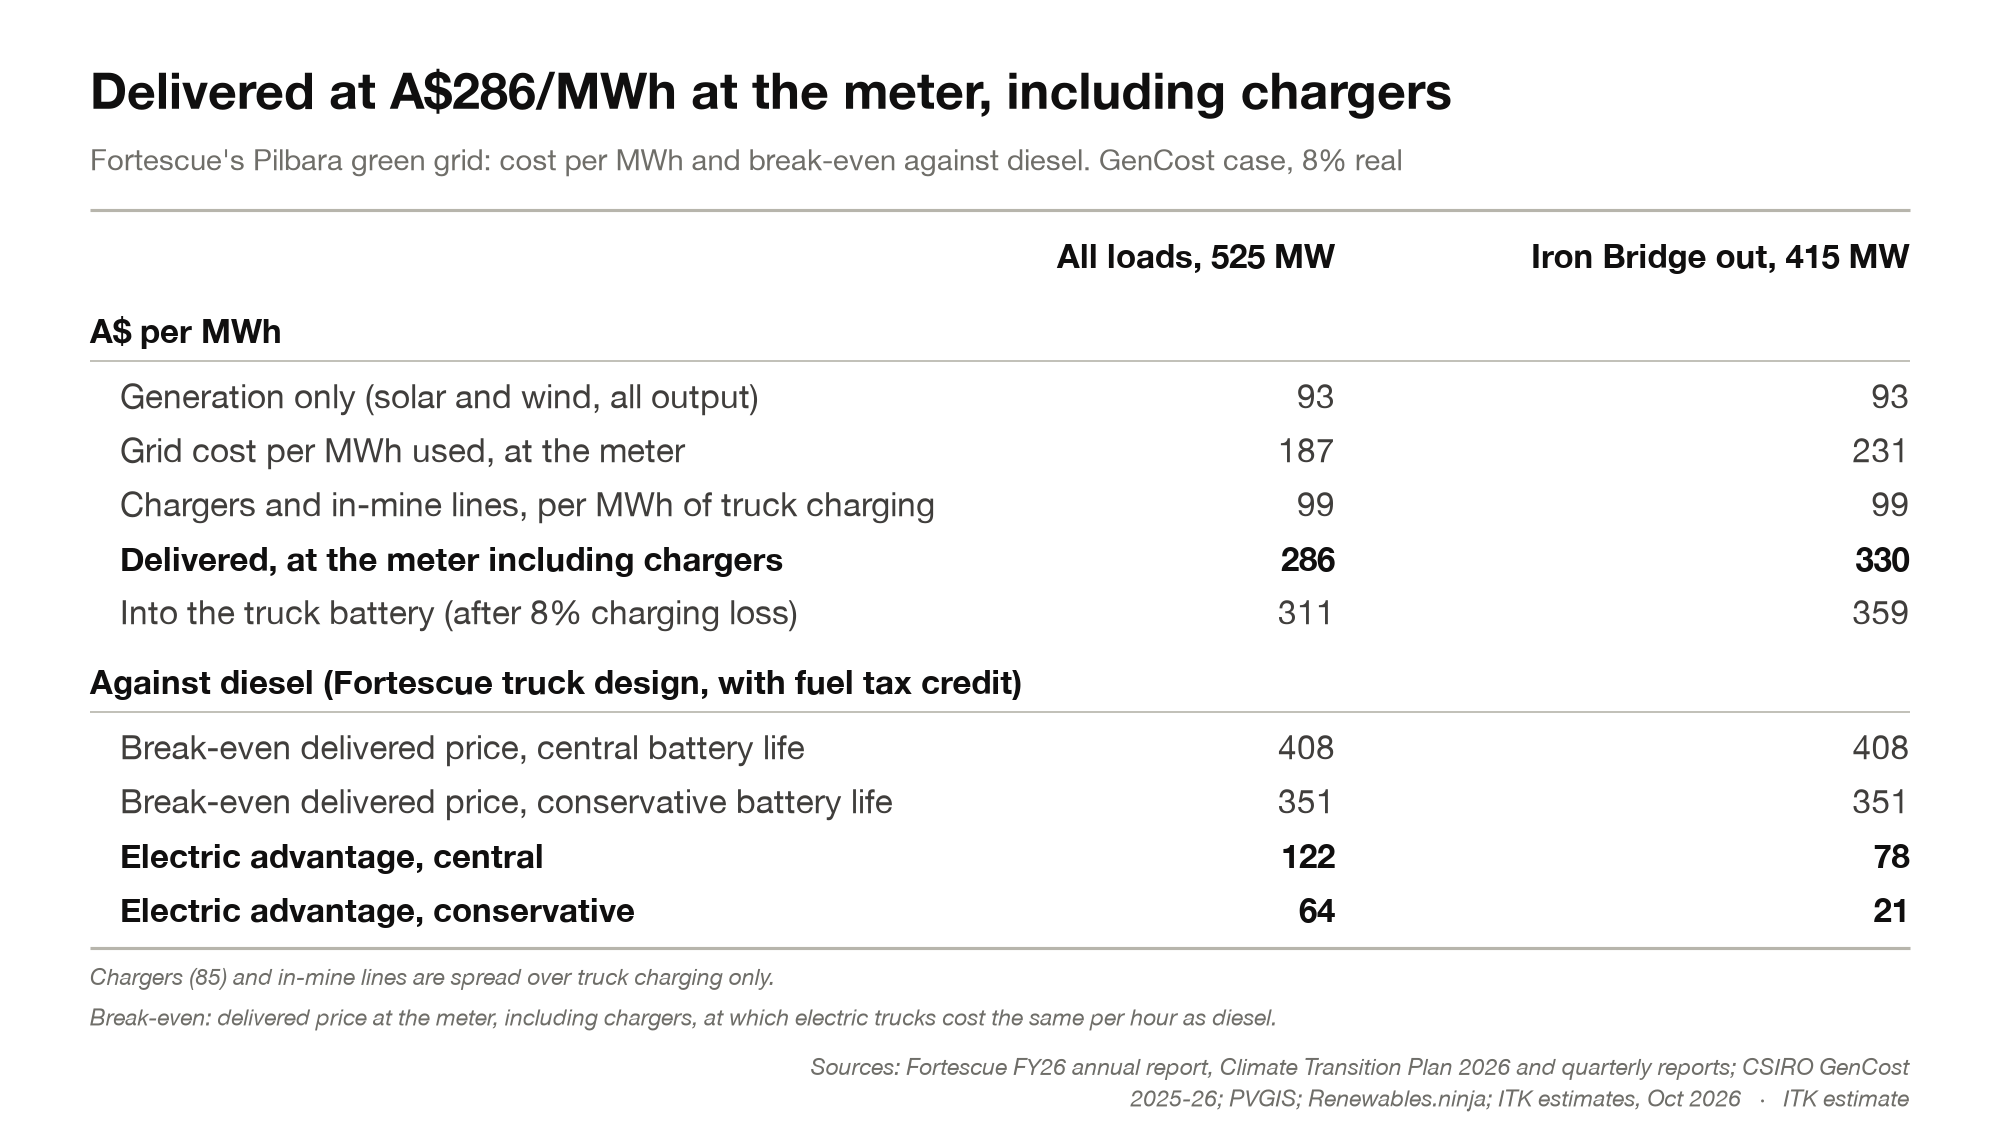
Delivered cost and break-even against diesel
Delivered at A$286/MWh against a break-even of A$408: an electric advantage of A$122/MWh.
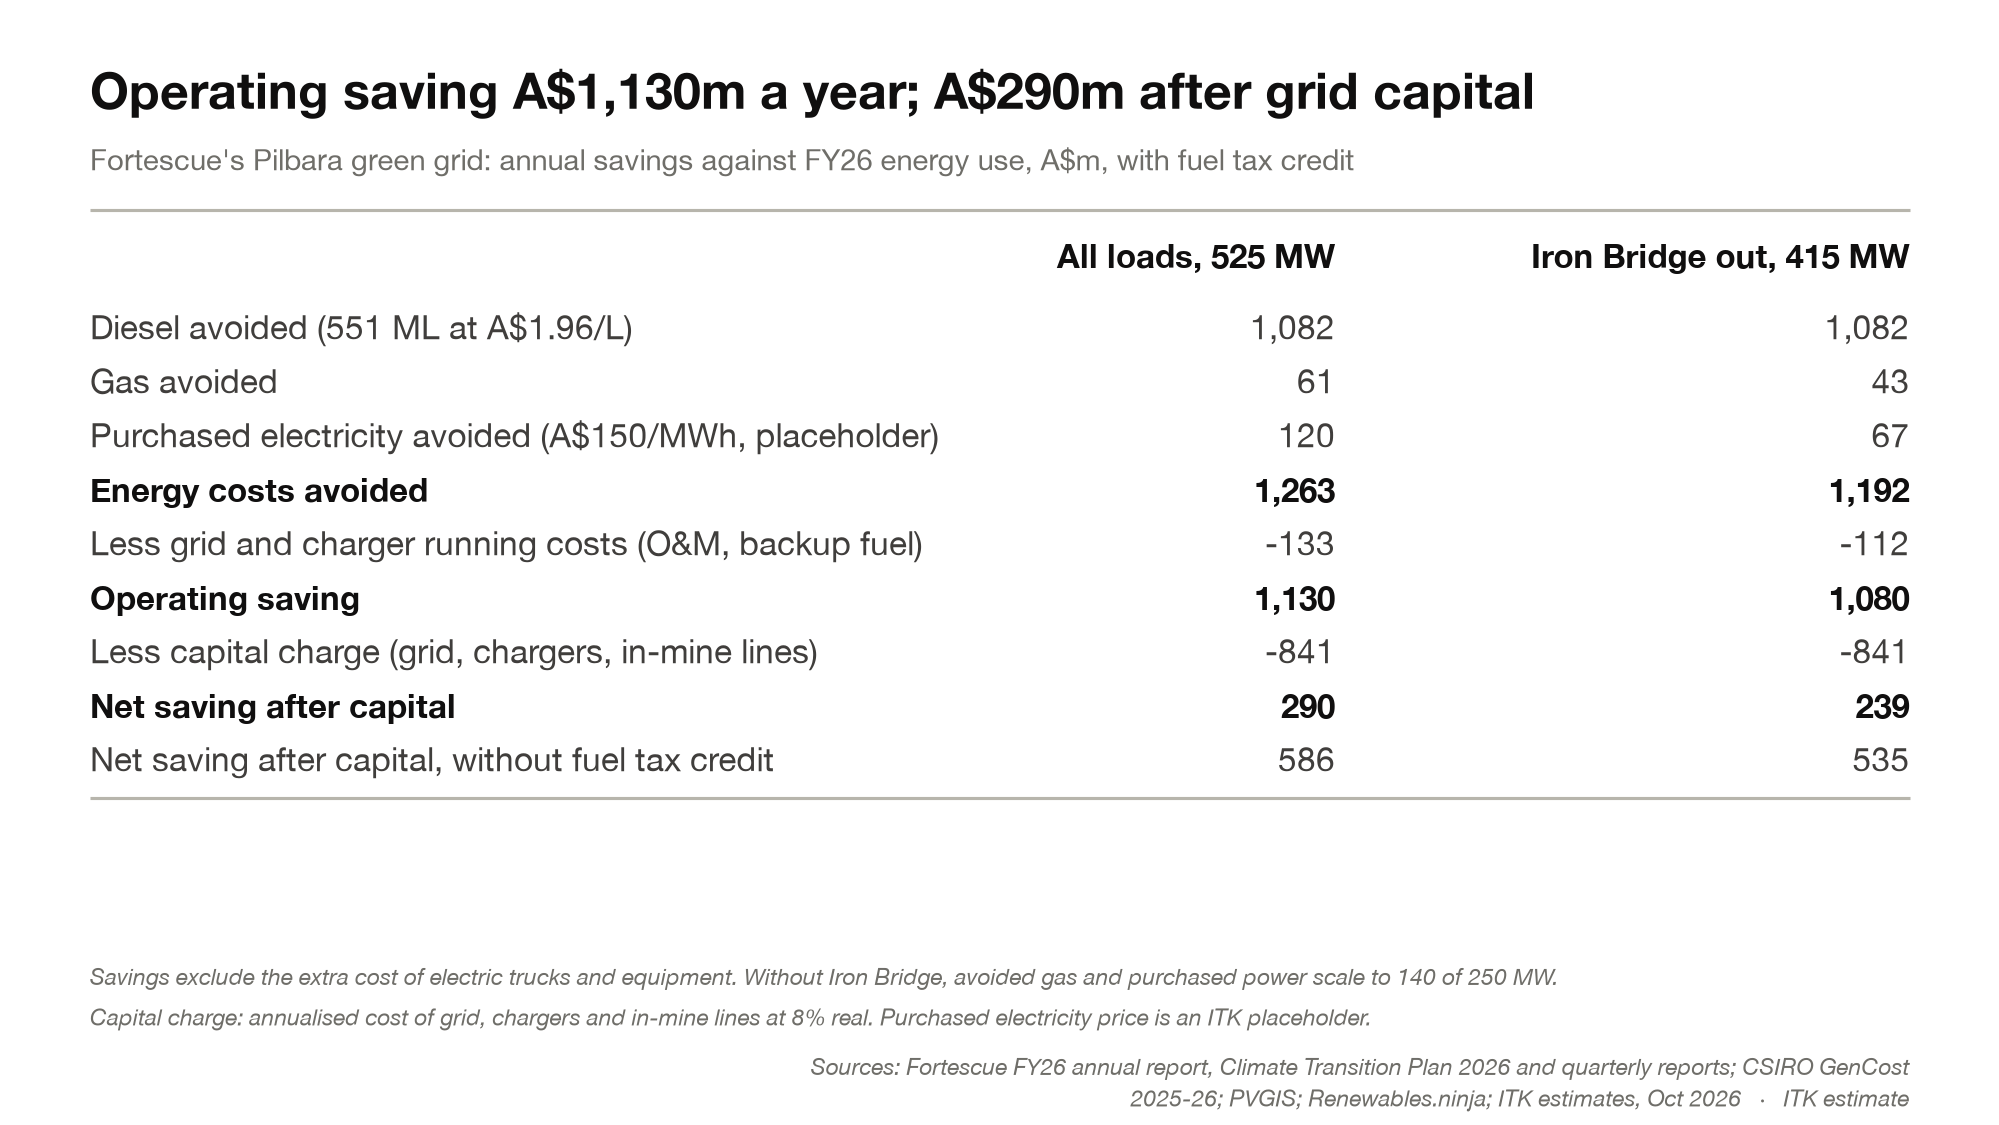
Annual savings against FY26 energy use
Operating saving A$1,130m a year; A$290m after grid capital.
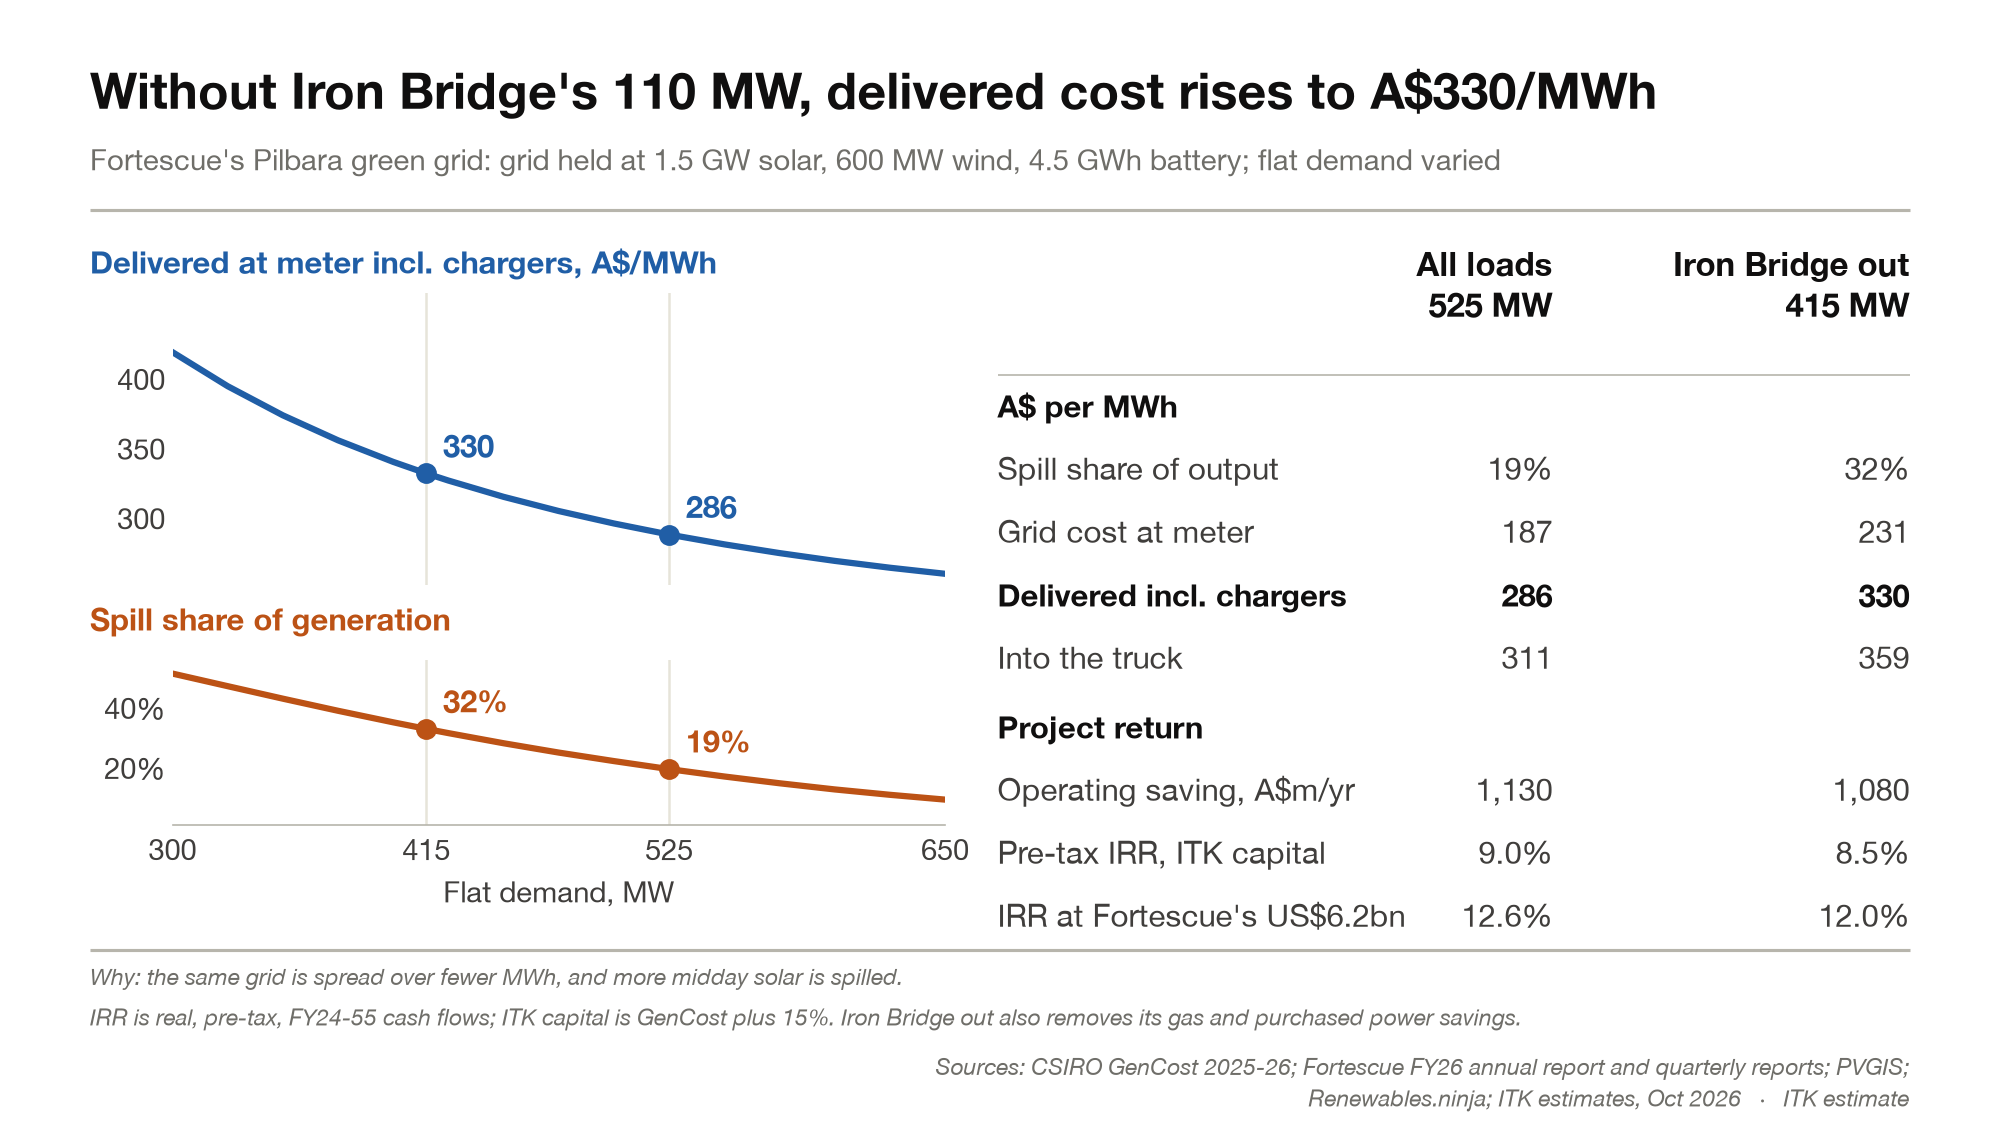
Iron Bridge sensitivity
Without Iron Bridge’s 110 MW, delivered cost rises to A$330/MWh and the IRR to 8.5%.